Modulation of Melanogenesis by Heme Oxygenase-1 via p53 in Normal Human Melanocytes
- Affiliations
-
- 1Department of Dermatology, Chonnam National University Medical School, Gwangju, Korea. sjyun@chonnam.ac.kr
- KMID: 2152655
- DOI: http://doi.org/10.4068/cmj.2016.52.1.45
Abstract
- As a key regulator of melanogenesis, p53 controls microphthalmia-associated transcription factor (MITF) and tyrosinase expression. The anti-oxidant enzyme heme oxygenase-1 (HO-1) is induced by various forms of cellular stress and diverse oxidative stimuli. However, few studies have examined the role of HO-1 in melanogenesis. Therefore, the aim of this study was to determine the role of HO-1 in melanogenesis and the mechanism underlying this relationship. Cultures of normal human melanocytes were treated with the HO-1 inducer cobalt protoporphyrin (CoPP) or the HO-1 inhibitor zinc protoporphyrin (ZnPP). We then measured the melanin content of the cells. Additional analyses consisted of Western blotting and RT-PCR. The results showed that the cellular melanin content was increased by CoPP and decreased by ZnPP. The Western blot and RT-PCR analyses showed that CoPP increased p53, MITF and tyrosinase levels, and ZnPP reduced all of them. The knockdown of p53 by siRNA transfection was followed by large decreases in the expression levels of p53, MITF and tyrosinase at 3 h of transfection. The presence of CoPP or ZnPP had no significant increased or decreased effects on MITF and tyrosinase levels from 15 h in the siRNA transfectants. Our results suggest that HO-1 modulates melanogenesis in human melanocytes via a p53-dependent pathway.
MeSH Terms
-
Blotting, Western
Cobalt
Heme Oxygenase-1*
Heme*
Humans*
Melanins
Melanocytes*
Microphthalmia-Associated Transcription Factor
Monophenol Monooxygenase
RNA, Small Interfering
Transfection
Zinc
Cobalt
Heme
Heme Oxygenase-1
Melanins
Microphthalmia-Associated Transcription Factor
Monophenol Monooxygenase
RNA, Small Interfering
Zinc
Figure
-
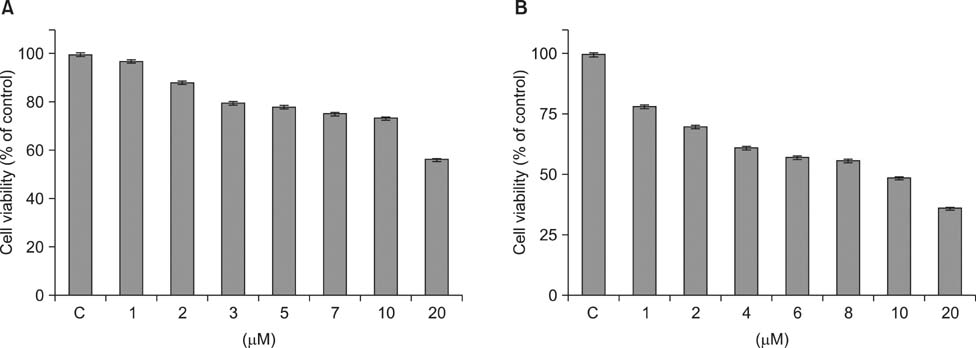
FIG. 1 MTT cell viability assay. (A) The HO-1 inducer CoPP and (B) the HO-1 inhibitor ZnPP treatments show decrease of cell viability in a dose-dependent manner. The results are not statistically significant in CoPP treatment groups compared with control (p=0.081), but marked decrease of cell viability at 20 µM below 50% in ZnPP treatment groups compared with control (p=0.016). C: control.
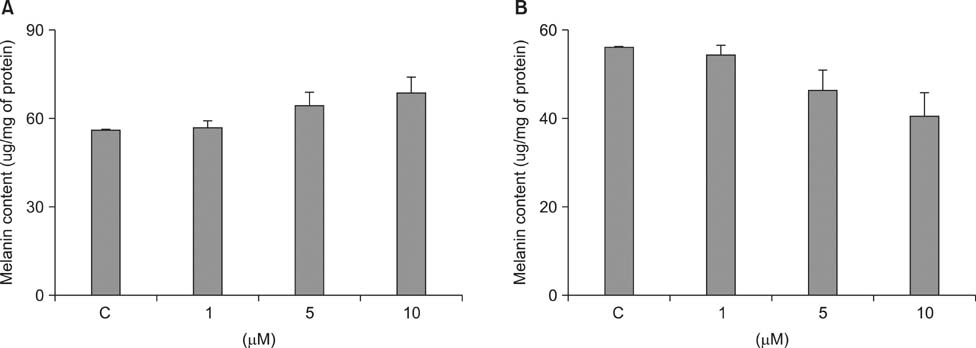
FIG. 2 Measurement of melanin content in normal human melanocytes. (A) CoPP increased (p=0.018) and (B) ZnPP decreased (p=0.012) cellular melanin content in a dose-dependent manner compared with control. C: control.
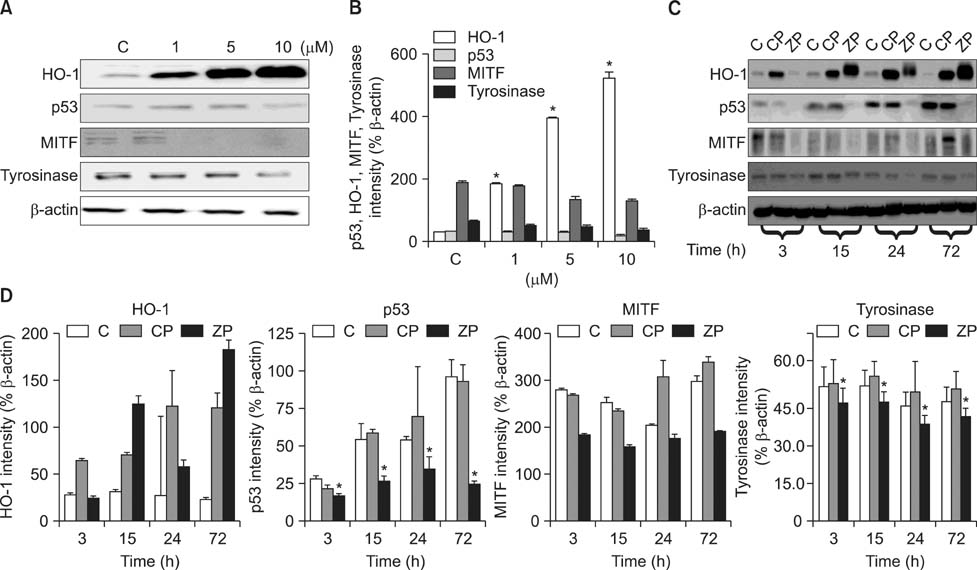
FIG. 3 Western blot analysis. (A) ZnPP decreases p53, MITF, and tyrosinase expressions in normal human melanocytes in a dose-dependent manner. (B) Scanned chemiluminescent signals were analyzed with the image analysis program. Each bar represents band intensity normalized with that of β-actin. Only increase in HO-1 expression is statistically significant according to the treatment doses of ZnPP compared to control group (p=0.043). (C) CoPP (10 µM) treatments increase expressions of p53, MITF, and tyrosinase, and ZnPP (10 µM) treatments decrease expressions in p53, tyrosinase, and MITF until 72 h after treatment. (D) Scanned chemiluminescent signals were analyzed with an image analysis program. Each intensity bar represents normalized with β-actin. Only decreases in p53 (p=0.045) and tyrosinase (p=0.025) expressions upon ZnPP treatment are statistically significant compared with control groups. All experiments were performed at least three times independently, and representative results are shown. The data represent mean±SD. C: control, CP: CoPP, ZP: ZnPP, *Statistical significance (p<0.05).
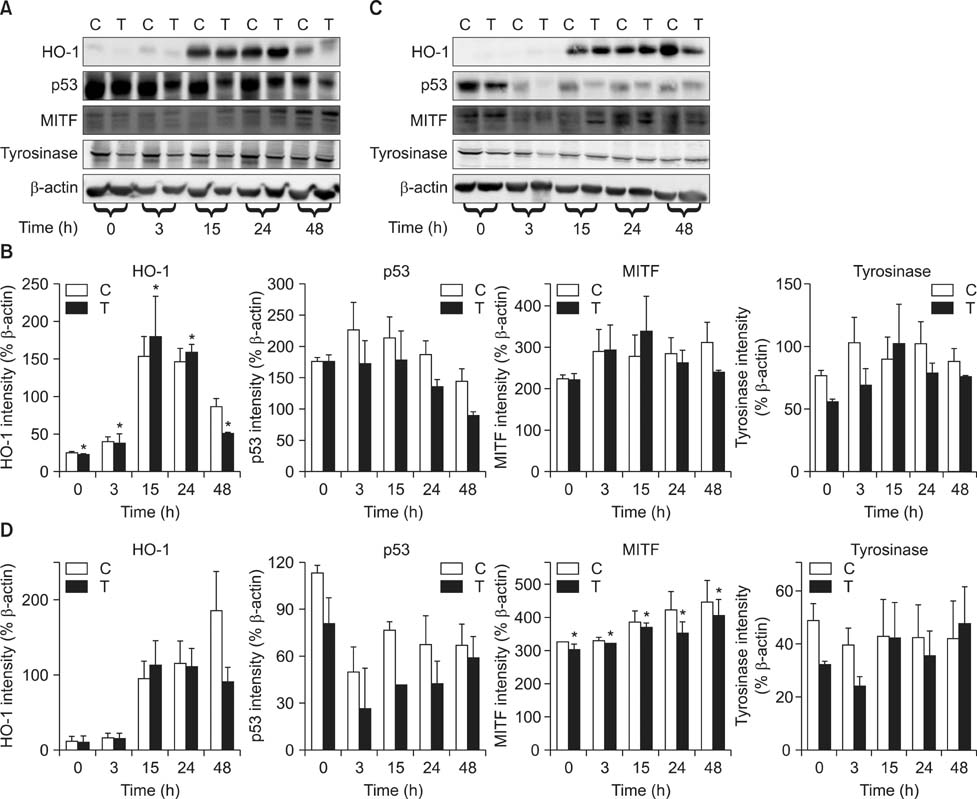
FIG. 4 Western blot analysis in normal human melanocytes transfected with p53 siRNA. (A) HO-1, p53, MITF, and tyrosinase levels decrease from 3 h post-transfection. There are no increases in MITF and tyrosinase proteins in response to the HO-1 inducer CoPP treatment after transfection. (B) Scanned chemiluminescent signals were analyzed with the image analysis program. Each bar represents band intensity normalized with that of β-actin. Only HO-1 expressions by CoPP treatment groups after transfection are statistically significant compared with control groups without transfection (p=0.019). C: CoPP treatment, T: transfection and CoPP treatment. (C) HO-1, p53, MITF, and tyrosinase levels decreased markedly and progressively 3 h post-transfection. (D) Scanned chemiluminescent signals were analyzed with an image analysis program. Each bar represents band intensity normalized with that of β-actin. There are slight decrease in MITF, but no decrease in tyrosinase in response to the HO-1 inhibitor ZnPP after transfection. Only MITF (p=0.032) expressions by ZnPP treatment groups after transfection are statistically significant compared with control groups without transfection. C: ZnPP treatment, T: transfection and ZnPP treatment. All experiments were performed at least three times independently, and representative results are shown. The data represent mean±SD. *Statistical significance (p< 0.05).
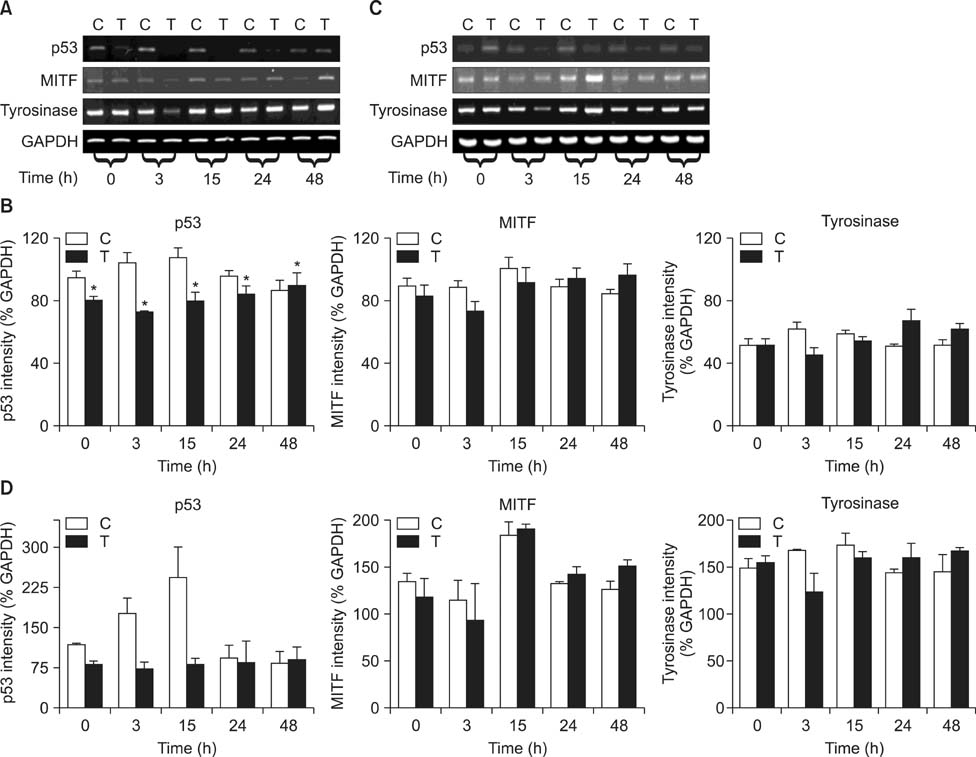
FIG. 5 RT-PCR analysis after p53 siRNA transfection. (A) MITF and tyrosinase mRNA levels decreased 3 h and 15 h post-transfection and CoPP treatment. (B) Scanned chemiluminescent signals were analyzed with the image analysis program. Each bar represents band intensity normalized with that of GAPDH. Only p53 expressions by CoPP treatment groups after transfection are statistically significant compared with control groups without transfection (p=0.014). There are no increases in MITF and tyrosinase mRNAs in response to the HO-1 inducer CoPP from 24 h. C: CoPP treatment, T: transfection and CoPP treatment. (C) p53 and tyrosinase mRNA levels decrease at 3 h and 15 h post-transfection and ZnPP treatment. (D) Scanned chemiluminescent signals were analyzed with the image analysis program. Each bar represents band intensity normalized with that of GAPDH. There are no decreases MITF and tyrosinase mRNAs from 15 h and 24 h, respectively, in response to the HO-1 inhibitor ZnPP treatments after transfection. All expressions are not statistically significant. C: ZnPP treatment, T: transfection and ZnPP treatment. All experiments were performed at least three times independently, and representative results are shown. The data represent mean±SD. *Statistical significance (p<0.05).
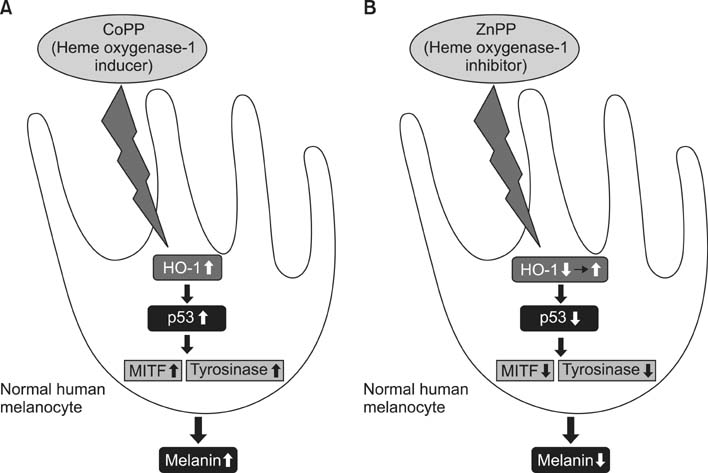
FIG. 6 Modulation of melanogenesis by HO-1 via p53 in normal human melanocytes. (A) HO-1 inducer, CoPP, increases melanin production by inducing p53, which in turn stimulates both MITF and tyrosinase expression. (B) HO-1 inhibitor, ZnPP, decreases melanin production by suppressing p53 which decreases both MITF and tyrosinase expression.
Reference
-
1. Amersi F, Buelow R, Kato H, Ke B, Coito AJ, Shen XD, et al. Upregulation of heme oxygenase-1 protects genetically fat Zucker rat livers from ischemia/reperfusion injury. J Clin Invest. 1999; 104:1631–1639.
Article2. Schallreuter KU, Kothari S, Chavan B, Spencer JD. Regulation of melanogenesis--controversies and new concepts. Exp Dermatol. 2008; 17:395–404.3. Zhao H, Ozen M, Wong RJ, Stevenson DK. Heme oxygenase-1 in pregnancy and cancer: similarities in cellular invasion, cytoprotection, angiogenesis, and immunomodulation. Front Pharmacol. 2015; 5:295.
Article4. Jian Z, Li K, Liu L, Zhang Y, Zhou Z, Li C, et al. Heme oxygenase-1 protects human melanocytes from H2O2-induced oxidative stress via the Nrf2-ARE pathway. J Invest Dermatol. 2011; 131:1420–1427.
Article5. Jin SA, Park JJ, Lee JB, Lee SC, Yun SJ. Decreased heme oxygenase-1 expression distinguishes human melanomas from melanocytic nevi. Pigment Cell Melanoma Res. 2010; 23:841–844.
Article6. Immenschuh S, Ramadori G. Gene regulation of heme oxygenase-1 as a therapeutic target. Biochem Pharmacol. 2000; 60:1121–1128.
Article7. Box NF, Terzian T. The role of p53 in pigmentation, tanning and melanoma. Pigment Cell Melanoma Res. 2008; 21:525–533.
Article8. Park HY, Kosmadaki M, Yaar M, Gilchrest BA. Cellular mechanisms regulating human melanogenesis. Cell Mol Life Sci. 2009; 66:1493–1506.
Article9. Lee SY, Jo HJ, Kim KM, Song JD, Chung HT, Park YC. Concurrent expression of heme oxygenase-1 and p53 in human retinal pigment epithelial cell line. Biochem Biophys Res Commun. 2008; 365:870–874.
Article10. Nam SY, Sabapathy K. p53 promotes cellular survival in a context-dependent manner by directly inducing the expression of haeme-oxygenase-1. Oncogene. 2011; 30:4476–4486.
Article11. Kim DH, Song NY, Kim EH, Na HK, Joe Y, Chung HT, et al. 15-deoxy-Δ12,14-prostaglandin J2 induces p53 expression through Nrf2-mediated upregulation of heme oxygenase-1 in human breast cancer cells. Free Radic Res. 2014; 48:1018–1027.
Article12. Eisinger M, Lee JS, Hefton JM, Darzynkiewicz Z, Chiao JW, de Harven E. Human epidermal cell cultures: growth and differentiation in the absence of differentiation in the absence of dermal components or medium supplements. Proc Natl Acad Sci U S A. 1979; 76:5340–5344.
Article13. Elassiuty YE, Klarquist J, Speiser J, Yousef RM, El Refaee AA, Hunter NS, et al. Heme oxygenase-1 expression protects melanocytes from stress-induced cell death: implications for vitiligo. Exp Dermatol. 2011; 20:496–501.
Article14. Marrot L, Belaïdi JP, Jones C, Perez P, Meunier JR. Molecular responses to stress induced in normal human caucasian melanocytes in culture by exposure to simulated solar UV. Photochem Photobiol. 2005; 81:367–375.
Article
- Full Text Links
-
- Actions
-
Cited
- CITED
-
- Close
- Share
-
- Similar articles
-
- Translocation of p53 Protein in Melanocytes and Malignant Melanoma Cells After UVB Irradiation
- Heme Oxygenase-1: Its Therapeutic Roles in Inflammatory Diseases
- Activation of Toll-like Receptors 1, 2, 4, 5, and 7 on Human Melanocytes Modulate Pigmentation
- Effects of Oxidative Stress and Antioxidant on the Expression of Heme Oxygenase-1 in Human RPE
- Possible Role of Heme Oxygenase-1 and Prostaglandins in the Pathogenesis of Cerebral Malaria: Heme Oxygenase-1 Induction by Prostaglandin D2 and Metabolite by a Human Astrocyte Cell Line
