Effect of Retinoic Acid in a Mouse Model of Allergic Rhinitis
- Affiliations
-
- 1Department of Otolaryngology-Head and Neck Surgery, St. Vincent's Hospital, College of Medicine, The Catholic University of Korea, Suwon, Korea.
- 2Department of Otolaryngology-Head and Neck Surgery, Seoul St. Mary's Hospital, College of Medicine, The Catholic University of Korea, Seoul, Korea. kshent@catholic.ac.kr
- KMID: 2130266
- DOI: http://doi.org/10.4168/aair.2015.7.6.590
Abstract
- PURPOSE
All-trans retinoic acid (ATRA) modulates immune responses by affecting T cells. Several studies have revealed that allergic inflammation of the lower airways is negatively associated with the vitamin A concentration. However, the role of ATRA in allergic inflammation of the upper airways is unclear. We investigated the effects of ATRA in an allergic rhinitis mouse model.
METHODS
BALB/c mice except control groups (CON group) were sensitized with and challenged intra-nasally with Dermatophagoides farina (AR group). The ATRA groups were administered ATRA intraperitoneally. The steroid groups were administered steroid intranasally (ST group). Allergic symptoms and the average eosinophil number were counted. Cytokines and transcription factors were measured by Real-Time PCR and Western blotting. Der f-specific immunoglobulin E (IgE) was measured. Flow cytometry results of CD4+CD25+Foxp3+ T cells were analyzed.
RESULTS
The symptom scores were lower in the ATRA group than in the AR group and higher than in the CON group. The levels of IgE were lower in the ATRA group than in the AR group and higher than in the CON and ST groups. The levels of Foxp3, TGF-beta, and IL-10 mRNA, as well as the percentage of CD4+CD25+Foxp3+ T cells, were higher in the ATRA group than in theAR group. In the ATRA group the levels of IFN-gamma mRNA were higher, and the levels of GATA-3 and IL-4 mRNA, and ROR-gammat were lower. In Western blotting analyses, the expression patterns of all factors, except Foxp3, showed similar to those of mRNA expression.
CONCLUSIONS
ATRA has anti-allergic effects in an allergic rhinitis model, and its underlying mechanisms mainly include the induction of regulatory T cells and the inhibition of Th2 responses.
MeSH Terms
-
Animals
Blotting, Western
Cytokines
Eosinophils
Flow Cytometry
Immunoglobulin E
Immunoglobulins
Inflammation
Interleukin-10
Interleukin-4
Mice*
Nuclear Receptor Subfamily 1, Group F, Member 3
Pyroglyphidae
Real-Time Polymerase Chain Reaction
Rhinitis*
RNA, Messenger
T-Lymphocytes
T-Lymphocytes, Regulatory
Th17 Cells
Th2 Cells
Transcription Factors
Transforming Growth Factor beta
Tretinoin*
Vitamin A
Cytokines
Immunoglobulin E
Immunoglobulins
Interleukin-10
Interleukin-4
Nuclear Receptor Subfamily 1, Group F, Member 3
RNA, Messenger
Transcription Factors
Transforming Growth Factor beta
Tretinoin
Vitamin A
Figure
-
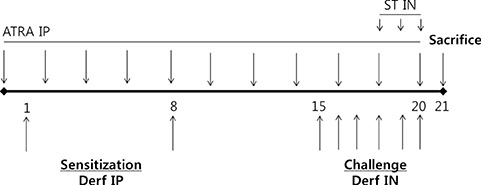
Fig. 1 Schematic representation of the experimental allergic rhinitis model and treatment protocol. Der f, Dermatophagoides farinae; IN, intranasal administration; IP, intraperitoneal administration; ATRA, all-trans retinoic acid; ST, steroid (cicleosonide). Units are days.

Fig. 2 Nasal symptom score. Sneezing (A) and nose-rubbing motions (B) of the CON (n=10), AR (n=10), ATRA (n=10), and ST (n=10) groups were measured for a 15-min period. Results are expressed as absolute number of sneezing and nose-rubbing motions. Box and whiskers plot show median and interquartile range. The number of sneezing motion was significantly higher in the AR group than in the ATRA group. The number of nasal rubbing motion was higher in the AR group than in the ATRA group. Control group; CON, Dermatophagoides farina group; AR, all-trans retinoic acid group; ATRA, steroid group; ST. *P<0.05, ATRA vs CON; **P<0.05, ATRA vs AR according to Kruskal-Wallis tests.
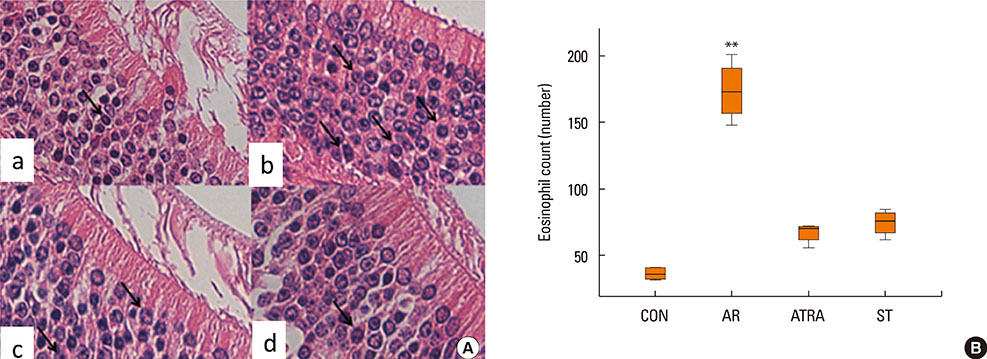
Fig. 3 Infiltration of eosinophils (cell/2,500 µm3) into the nasal mucosa of BALB/c mice (A) (a) CON (n=4), (b) AR (n=4), (c) ATRA (n=4), and (d) ST (n=4). (Hematoxylin and eosin staining; original magnification, ×200). Black arrows indicate infiltration of eosinophils. (B) Eosinophil counts in the nasal mucosa in 50 µm ×50 µm area under a light microscope (×200). The eosinophil count was significantly higher in the AR group than in the ATRA group Other abbreviations as in Fig. 2.Box and whiskers plot show median and interquartile range. **P<0.05, ATRA vs AR.
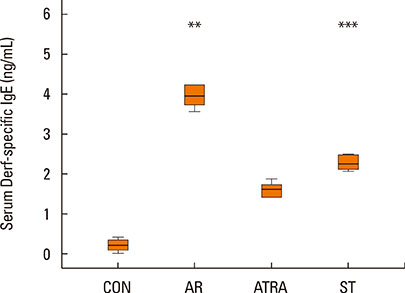
Fig. 4 Serum levels of Dermatophagoides farinae-specific immunoglobulin E. The level of Der f-specific IgE in the serum was higher in the AR group and ST groups than in the ATRA group. Other abbreviations as in Fig. 2. Box and whiskers plot show median and interquartile range. **P<0.05, ATRA vs AR; ***P<0.05, ATRA vs ST.
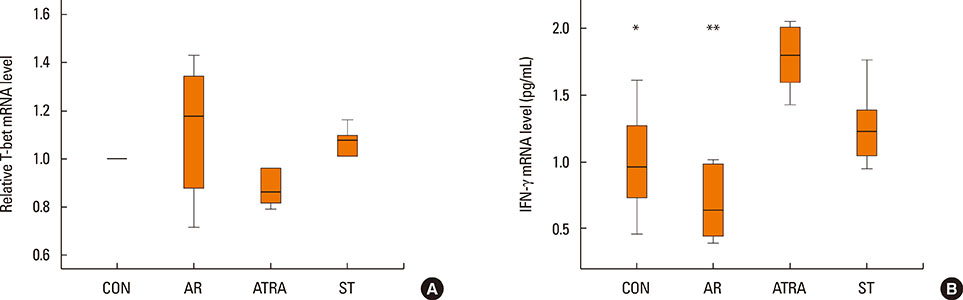
Fig. 5 Quantitative analysis of the cytokine levels by real-time PCR from the nasal mucosa of CON (n=6), AR (n=6), ATRA (n=6), and ST (n=6) group in the Th1 response: (A) relative mRNA level of T-bet, (B) expression level of interferon-γ mRNA. The results were normalized relative to GAPDH expression. The expression level of IFN-γ mRNA was lower in the AR groups than in the ATRA group. Other abbreviations as in Fig. 2. Box and whiskers plot show median and interquartile range. *P<0.05, ATRA vs CON; **P<0.05, ATRA vs AR.

Fig. 6 Quantitative analysis of the cytokine levels by Real-Time PCR from the nasal mucosa of CON (n=6), AR (n=6), ATRA (n=6), and ST (n=6) group in the Th2 response: (A) relative mRNA level of GATA-3, (B) expression level of interleukin-4 mRNA were measured by real time PCR. The results were normalized relative to GAPDH expression. In the Th2 response, the relative level of GATA-3 mRNA was higher in the AR group than in the ATRA group. The expression level of IL-4 mRNA was also higher in the AR group than in the ATRA group. Other abbreviations as in Fig. 2.Box and whiskers plot show median and interquartile range. *P<0.05, ATRA vs CON; **P<0.05, ATRA vs AR.
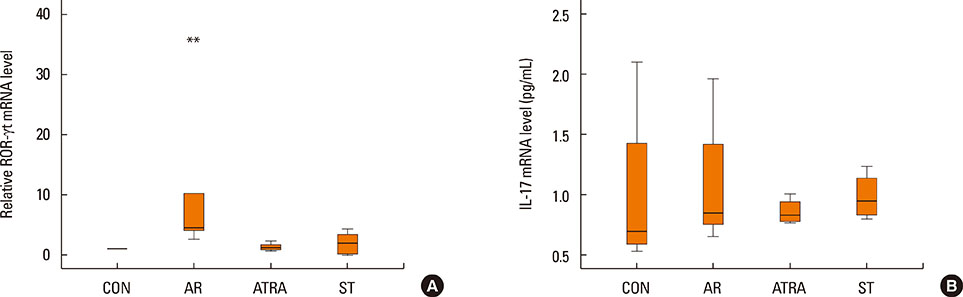
Fig. 7 Quantitative analysis of the cytokine levels by real-time PCR from the nasal mucosa of CON (n=6), AR (n=6), ATRA (n=6), and ST (n=6) group in the Th17 response: (A) relative mRNA level of ROR-γt, (B) expression level of interleukin-17 mRNA were measured by real time PCR. The results were normalized relative to GAPDH expression. The relative level of ROR-γt mRNA was higher in the AR group than in the other groups. The level of IL-17 mRNA showed no significant difference among the groups. Other abbreviations as in Fig. 2. Box and whiskers plot show median and interquartile range. **P<0.05, ATRA vs AR.
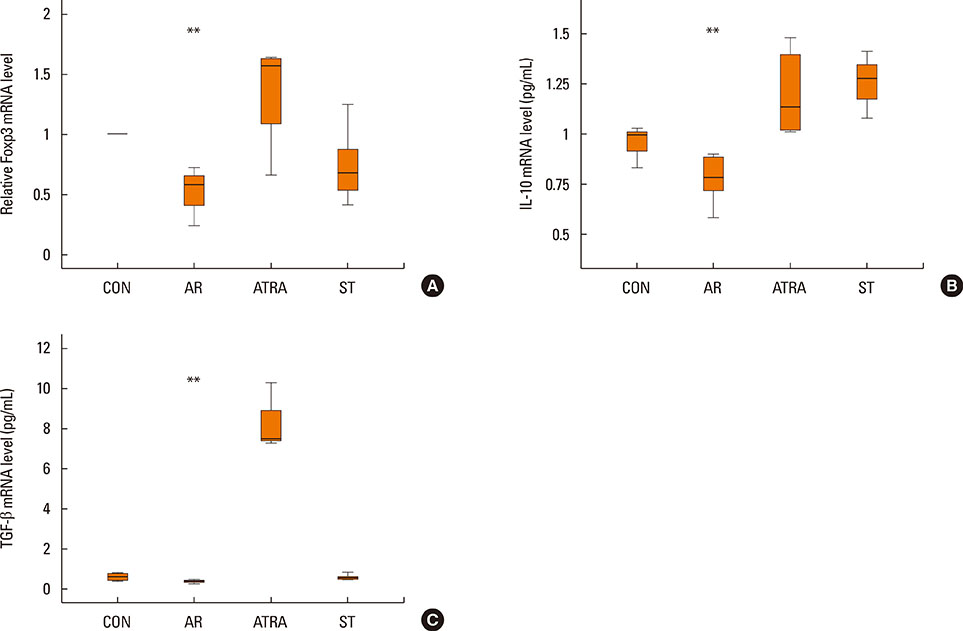
Fig. 8 Quantitative analysis of the cytokine levels in the nasal mucosa of CON (n=6), AR (n=6), ATRA (n=6), and ST (n=6) group in the regulatory T response: (A) relative mRNA level of Foxp3, (B) expression level of Interleukin-10 mRNA, (C) expression level of TGF-β mRNA were measured by Real Time PCR. The results were normalized relative to GAPDH expression. The relative expression levels of Foxp3 were lower in the AR group than in the ATRA group. The expression level of IL-10 mRNA was also lower in the AR group than in the ATRA group. The level of TGF-β was lower in the AR group than in the ATRA group. Other abbreviations as in Fig. 2. Box and whiskers plot show median and interquartile range. **P<0.05, ATRA vs AR.

Fig. 9 Effect of ATRA on cytokines and transcription factors measured by Western blotting to confirm the protein express patterns of the cytokines and transcription factors. CON group (A, n=6), AR group (B, n=6), ATRA group (C, n=6), ST group (D, n=6). The expression patterns of all factors, except Foxp3, showed similar patterns to that of mRNA expression. Other abbreviations as in Fig. 2.
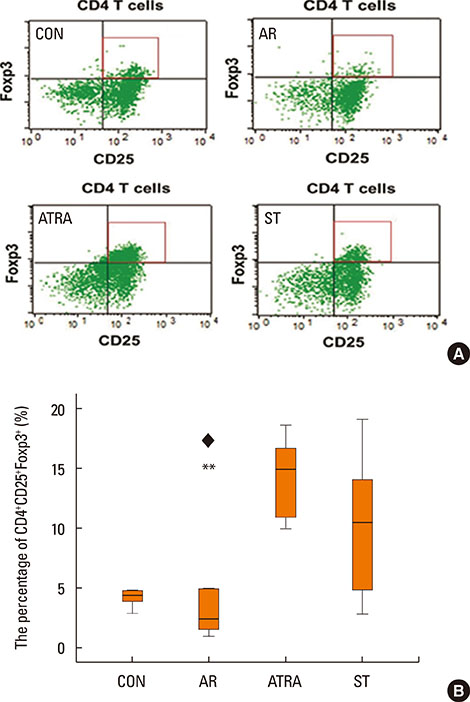
Fig. 10 Flow cytometric analysis of CD4+CD25+Foxp3+ T cell subsets. (A) Representative flurorescence-activated cell sorting analysis in CON (n=10), AR (n=10), ATRA (n=10), and ST (n=10) groups. (B) The percentage of splenic mononuclear cells that were CD4+CD25+Foxp3+ T cells. RU=upper right quadrant, which represents CD4+CD25+Foxp3+ T cells. The ATRA and ST groups had significantly higher percentages of these cells than the AR group. Other abbreviations as in Fig. 2. Box and whiskers plot show median and interquartile range. **P<0.05, ATRA vs AR, ♦P<0.05, ST vs AR.
Cited by 1 articles
-
Effect of Proparacaine in a Mouse Model of Allergic Rhinitis
Hwan Soo Kim, Sulmui Won, Eu Kyoung Lee, Yoon Hong Chun, Jong-Seo Yoon, Jin Tack Kim, Hyun Hee Kim
Clin Exp Otorhinolaryngol. 2017;10(4):325-331. doi: 10.21053/ceo.2017.00101.
Reference
-
1. Bellanti JA, Wallerstedt DB. Allergic rhinitis update: Epidemiology and natural history. Allergy Asthma Proc. 2000; 21:367–370.2. The International Study of Asthma and Allergies in Childhood (ISAAC) Steering Committee. Worldwide variation in prevalence of symptoms of asthma, allergic rhinoconjunctivitis, and atopic eczema: ISAAC. Lancet. 1998; 351:1225–1232.3. Seaton A, Godden DJ, Brown K. Increase in asthma: a more toxic environment or a more susceptible population? Thorax. 1994; 49:171–174.4. Patel S, Murray CS, Woodcock A, Simpson A, Custovic A. Dietary antioxidant intake, allergic sensitization and allergic diseases in young children. Allergy. 2009; 64:1766–1772.5. Allen S, Britton JR, Leonardi-Bee JA. Association between antioxidant vitamins and asthma outcome measures: systematic review and meta-analysis. Thorax. 2009; 64:610–619.6. Al Senaidy AM. Serum vitamin A and beta-carotene levels in children with asthma. J Asthma. 2009; 46:699–702.7. McGowan SE. Vitamin A deficiency increases airway resistance following C-fiber stimulation. Respir Physiol Neurobiol. 2007; 157:281–289.8. Seo JH, Kwon SO, Lee SY, Kim HY, Kwon JW, Kim BJ, et al. Association of antioxidants with allergic rhinitis in children from seoul. Allergy Asthma Immunol Res. 2013; 5:81–87.9. Kompauer I, Heinrich J, Wolfram G, Linseisen J. Association of carotenoids, tocopherols and vitamin C in plasma with allergic rhinitis and allergic sensitisation in adults. Public Health Nutr. 2006; 9:472–479.10. Devereux G, Seaton A. Diet as a risk factor for atopy and asthma. J Allergy Clin Immunol. 2005; 115:1109–1117.11. Hall JA, Cannons JL, Grainger JR, Dos Santos LM, Hand TW, Naik S, et al. Essential role for retinoic acid in the promotion of CD4(+) T cell effector responses via retinoic acid receptor alpha. Immunity. 2011; 34:435–447.12. Ertesvag A, Austenaa LM, Carlsen H, Blomhoff R, Blomhoff HK. Retinoic acid inhibits in vivo interleukin-2 gene expression and T-cell activation in mice. Immunology. 2009; 126:514–522.13. Ross AC. Vitamin A and retinoic acid in T cell-related immunity. Am J Clin Nutr. 2012; 96:1166S–1172S.14. Kimura A, Kishimoto T. IL-6: regulator of Treg/Th17 balance. Eur J Immunol. 2010; 40:1830–1835.15. Matheu V, Berggård K, Barrios Y, Barrios Y, Arnau MR, Zubeldia JM, et al. Impact on allergic immune response after treatment with vitamin A. Nutr Metab (Lond). 2009; 6:44.16. Matheu V, Bäck O, Mondoc E, Issazadeh-Navikas S. Dual effects of vitamin D-induced alteration of TH1/TH2 cytokine expression: enhancing IgE production and decreasing airway eosinophilia in murine allergic airway disease. J Allergy Clin Immunol. 2003; 112:585–592.17. Kim BY, Shin JH, Park HR, Kim SW, Kim SW. Comparison of antiallergic effects of pneumococcal conjugate vaccine and pneumococcal polysaccharide vaccine in a murine model of allergic rhinitis. Laryngoscope. 2013; 123:2371–2377.18. Shin JH, Kim BY, Park HR, Kim SW, Kim SW. The effect of pneumococcal polysaccharide vaccine in a mouse model of allergic rhinitis. Otolaryngol Head Neck Surg. 2013; 148:383–390.19. Wang W, Zhu Z, Zhu B, Ma Z. Peroxisome proliferator-activated receptor-gamma agonist induces regulatory T cells in a murine model of allergic rhinitis. Otolaryngol Head Neck Surg. 2011; 144:506–513.20. Gourley TS, Patel DR, Nickerson K, Hong SC, Chang CH. Aberrant expression of Fas ligand in mice deficient for the MHC class II transactivator. J Immunol. 2002; 168:4414–4419.21. Akdis M, Akdis CA. Therapeutic manipulation of immune tolerance in allergic disease. Nat Rev Drug Discov. 2009; 8:645–660.22. Akdis M, Verhagen J, Taylor A, Karamloo F, Karagiannidis C, Crameri R, et al. Immune responses in healthy and allergic individuals are characterized by a fine balance between allergen-specific T regulatory 1 and T helper 2 cells. J Exp Med. 2004; 199:1567–1575.23. Iwata M, Eshima Y, Kagechika H. Retinoic acids exert direct effects on T cells to suppress Th1 development and enhance Th2 development via retinoic acid receptors. Int Immunol. 2003; 15:1017–1025.24. Stephensen CB, Rasooly R, Jiang X, Ceddia MA, Weaver CT, Chandraratna RA, et al. Vitamin A enhances in vitro Th2 development via retinoid X receptor pathway. J Immunol. 2002; 168:4495–4503.25. Stephensen CB, Jiang X, Freytag T. Vitamin A deficiency increases the in vivo development of IL-10-positive Th2 cells and decreases development of Th1 cells in mice. J Nutr. 2004; 134:2660–2666.26. Ma Y, Chen Q, Ross AC. Retinoic acid and polyriboinosinic:polyribocytidylic acid stimulate robust anti-tetanus antibody production while differentially regulating type 1/type 2 cytokines and lymphocyte populations. J Immunol. 2005; 174:7961–7969.27. Benson MJ, Pino-Lagos K, Rosemblatt M, Noelle RJ. All-trans retinoic acid mediates enhanced T reg cell growth, differentiation, and gut homing in the face of high levels of co-stimulation. J Exp Med. 2007; 204:1765–1774.28. Mucida D, Park Y, Cheroutre H. From the diet to the nucleus: vitamin A and TGF-beta join efforts at the mucosal interface of the intestine. Semin Immunol. 2009; 21:14–21.29. Weaver CT, Hatton RD. Interplay between the TH17 and TReg cell lineages: a (co-)evolutionary perspective. Nat Rev Immunol. 2009; 9:883–889.30. Rubin RN, Navon L, Cassano PA. Relationship of serum antioxidants to asthma prevalence in youth. Am J Respir Crit Care Med. 2004; 169:393–398.31. Harik-Khan RI, Muller DC, Wise RA. Serum vitamin levels and the risk of asthma in children. Am J Epidemiol. 2004; 159:351–357.32. Grievink L, Smit HA, Ocké MC, van't Veer P, Kromhout D. Dietary intake of antioxidant (pro)-vitamins, respiratory symptoms and pulmonary function: the MORGEN study. Thorax. 1998; 53:166–171.33. Troisi RJ, Willett WC, Weiss ST, Trichopoulos D, Rosner B, Speizer FE. A prospective study of diet and adult-onset asthma. Am J Respir Crit Care Med. 1995; 151:1401–1408.34. Mucida D, Park Y, Kim G, Turovskaya O, Scott I, Kronenberg M, et al. Reciprocal TH17 and regulatory T cell differentiation mediated by retinoic acid. Science. 2007; 317:256–260.
- Full Text Links
-
- Actions
-
Cited
- CITED
-
- Close
- Share
-
- Similar articles
-
- Allergic Rhinitis Mouse Model
- Principles and Application of Mouse Model of Allergic Rhinitis
- Understanding the Mouse Model of Respiratory Allergic Diseases
- The Effect of Nano-Silver on Allergic Rhinitis Model in Mice
- The Role of Aviation Medical Examiners in the Diagnosis, Treatment and Aeromedical Assessment of Patients with Allergic Rhinitis
