Role of STAT3 Phosphorylation in Ethanol-Mediated Proliferation of Breast Cancer Cells
- Affiliations
-
- 1Department of Biotechnology, Anna University, Chennai, India. lakshmibs@annauniv.edu
- 2Department of Biochemistry, University of Madras, Chennai, India.
- 3Centre for Food Technology, Department of Biotechnology, Anna University, Chennai, India.
- KMID: 2308962
- DOI: http://doi.org/10.4048/jbc.2016.19.2.122
Abstract
- PURPOSE
In this study, we investigated the molecular mechanism involved in ethanol (EtOH)-mediated proliferation of breast cancer cells.
METHODS
EtOH concentration was optimized by studying its effect on cell proliferation in MCF-7 and MDA MB-231 cells. We used flow cytometry and immunoblot analysis to evaluate the increased proliferation caused by the optimized concentrations of EtOH. The mechanism of EtOH-mediated proliferation was determined using reactive oxygen species (ROS) release assay, reverse transcription polymerase chain reaction, and immunoblot studies. Gene silencing followed by quantitative real-time polymerase chain reaction studies and inhibitor studies indicated the involvement of signal transducer and activator of transcription 3 (STAT3) in EtOH-mediated breast cancer proliferation.
RESULTS
Exposure to EtOH caused an increase in cell proliferation and an accumulation of cells in S-phase in MCF-7 (347 µM EtOH) and MDA MB-231 (173 µM EtOH) cells. Additionally, increased release of ROS and the expression of pro-inflammatory cytokines, such as interleukin 6 and tumor necrosis factor α, confirmed that the proliferation was induced by the ROS-linked inflammatory response in breast cancer. The proinflammatory response was followed by phosphorylation of STAT3. The importance of STAT3 activation in EtOH-mediated proliferation was confirmed through the silencing of STAT3, followed by an investigation on the expression of cyclins and matrix metalloproteinases. Finally, studies using specific inhibitors indicated that the EtOH-mediated effect on STAT3 activation could be regulated by phosphoinositide-3-kinase and Janus kinase 2.
CONCLUSION
The study demonstrates the involvement of STAT3 signaling in EtOH-mediated breast cancer proliferation.
Keyword
MeSH Terms
-
Breast Neoplasms*
Breast*
Cell Proliferation
Cyclins
Cytokines
Ethanol
Flow Cytometry
Gene Silencing
Inflammation
Interleukin-6
Janus Kinase 2
Matrix Metalloproteinases
Phosphorylation*
Polymerase Chain Reaction
Reactive Oxygen Species
Real-Time Polymerase Chain Reaction
Reverse Transcription
STAT3 Transcription Factor
Tumor Necrosis Factor-alpha
Cyclins
Cytokines
Ethanol
Interleukin-6
Janus Kinase 2
Matrix Metalloproteinases
Reactive Oxygen Species
STAT3 Transcription Factor
Tumor Necrosis Factor-alpha
Figure
-
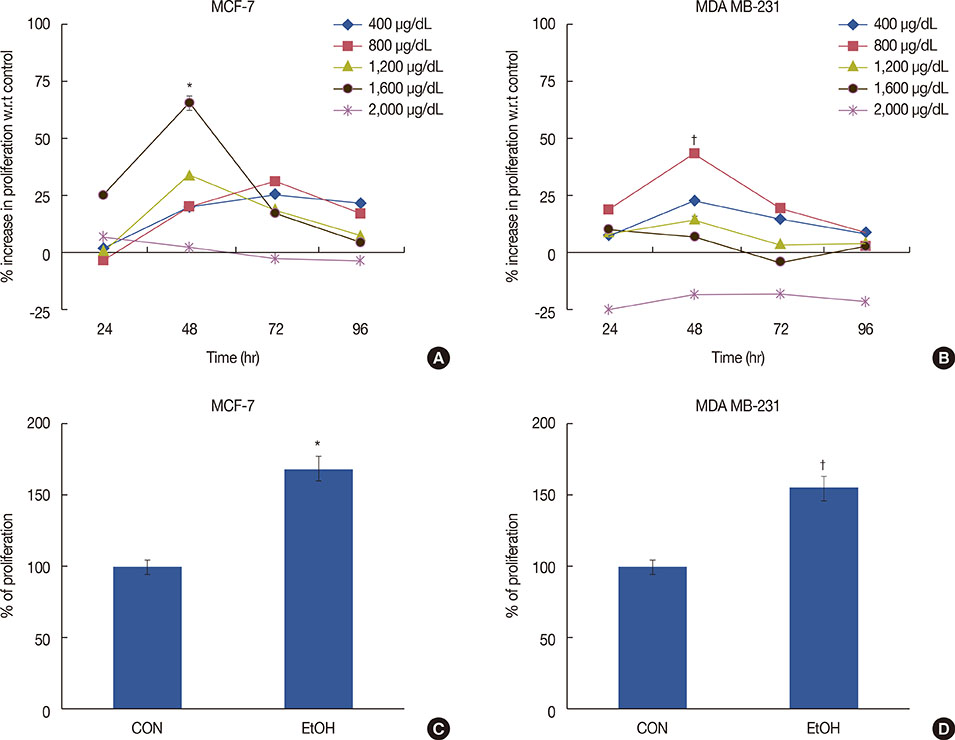
Figure 1 Dose and time course effect of EtOH on proliferation in MCF-7 and MDA MB-231 cells. (A) MTT assay in MCF-7 cells. (B) MTT assay in MDA MB-231 cells. Cells were treated with 400–1,600 µg/dL of EtOH for 24, 48, 72, and 96 hours. (C) Thymidine incorporation assay in MCF-7 cells. (D) Thymidine incorporation assay in MDA MB-231 cells. Cells were treated with the optimized concentration of EtOH 1,600 and 800 µg/dL for 48 hours. Results are expressed as percentage of proliferation. Data expressed as mean±SD from triplicates of three independent experiments. CON=control; EtOH=ethanol. *p≤0.005; †p≤0.05.

Figure 2 EtOH induced G1-S phase transition at 48 hours. Results of flow cytometry analysis (A) MCF-7. (B) MDA MB-231. (C) Immunoblot analysis of cell cycle proteins. (D) Expression of cell cycle proteins Integrated density value (IDV) in MCF-7 and MDA MB-231 cells. Target protein expressions were measured as IDVs using Image J and was normalized with β-actin expression. Data expressed as mean±SD from triplicates of three independent experiments. CON=control; EtOH=ethanol. *p≤0.005; †p≤0.05.
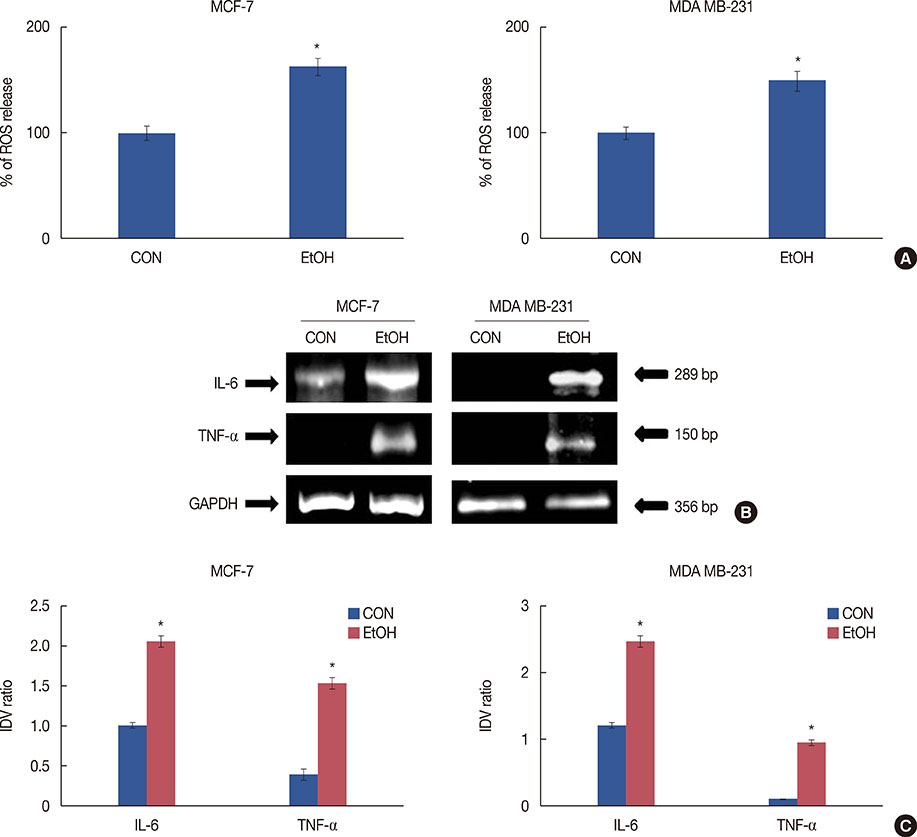
Figure 3 (A) EtOH induced reactive oxygen species (ROS) accumulation at 48 hours in MCF-7 and MDA MB-231 cells. Results of nitro blue tetrazolium assay. (B) Effect of EtOH on the expression of interleukin 6 (IL-6) and tumor necrosis factor α (TNF-α) in MCF-7 and MDA MB-231 cells at 48 hours using reverse transcription polymerase chain reaction. (C) Expression of target genes normalized with glyceraldehyde 3-phosphate dehydrogenase (GAPDH) expression in MCF-7 and MDA MB-231 cells. Data were observed from three independent experiments performed in triplicates. CON=control; EtOH=ethanol; IDV=Integrated density value. *p≤0.005.

Figure 4 (A) EtOH induced phosphorylation of STAT3 in MCF-7 and MDA MB-231 cells at 48 hours. Results of immunoblot analysis. (B) Expression of target protein normalized with β-actin expression. (C) Gene silencing studies for optimising the maximum transfection efficiency in MCF-7 and MDA MB-231 cells using immunoblot analysis. (D) Expression of target protein normalized with β-actin expression in MCF-7 and MDA MB-231 cells. CON=control; EtOH=ethanol; siSTAT3=signal transducer and activator of transcription 3 silenced cells; IDV=Integrated density value.
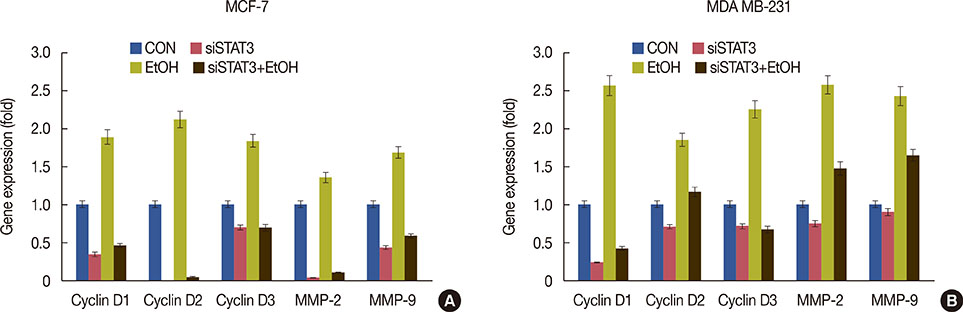
Figure 5 Quantitative real-time polymerase chain reaction analysis for STAT3 targeted proteins (cyclins and MMPs) at 48 hours. (A) MCF-7. (B) MDA MB-231 cells. Results are expressed as mean of gene expression values±SD from duplicates of two independent experiments. MMPs=matrix metalloproteinases; CON=control; siSTAT3=signal transducer and activator of transcription 3 silenced cells; EtOH=ethanol; siSTAT3+EtOH=STAT3 silenced cells in presence of ethanol.
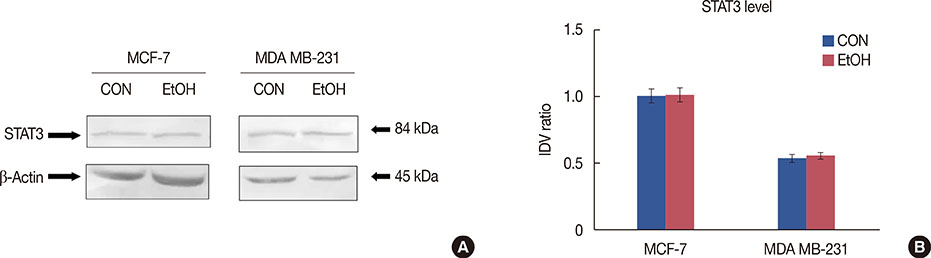
Figure 6 Effect of EtOH on the expression of total signal transducer and activator of transcription 3 (STAT3) in MCF-7 and MDA MB-231 cells at 48 hours. (A) Results of immunoblot analysis. (B) Expression of target protein normalized with β-actin expression in MCF-7 and MDA MB-231 cells. CON=control; EtOH=ethanol; IDV=Integrated density value.
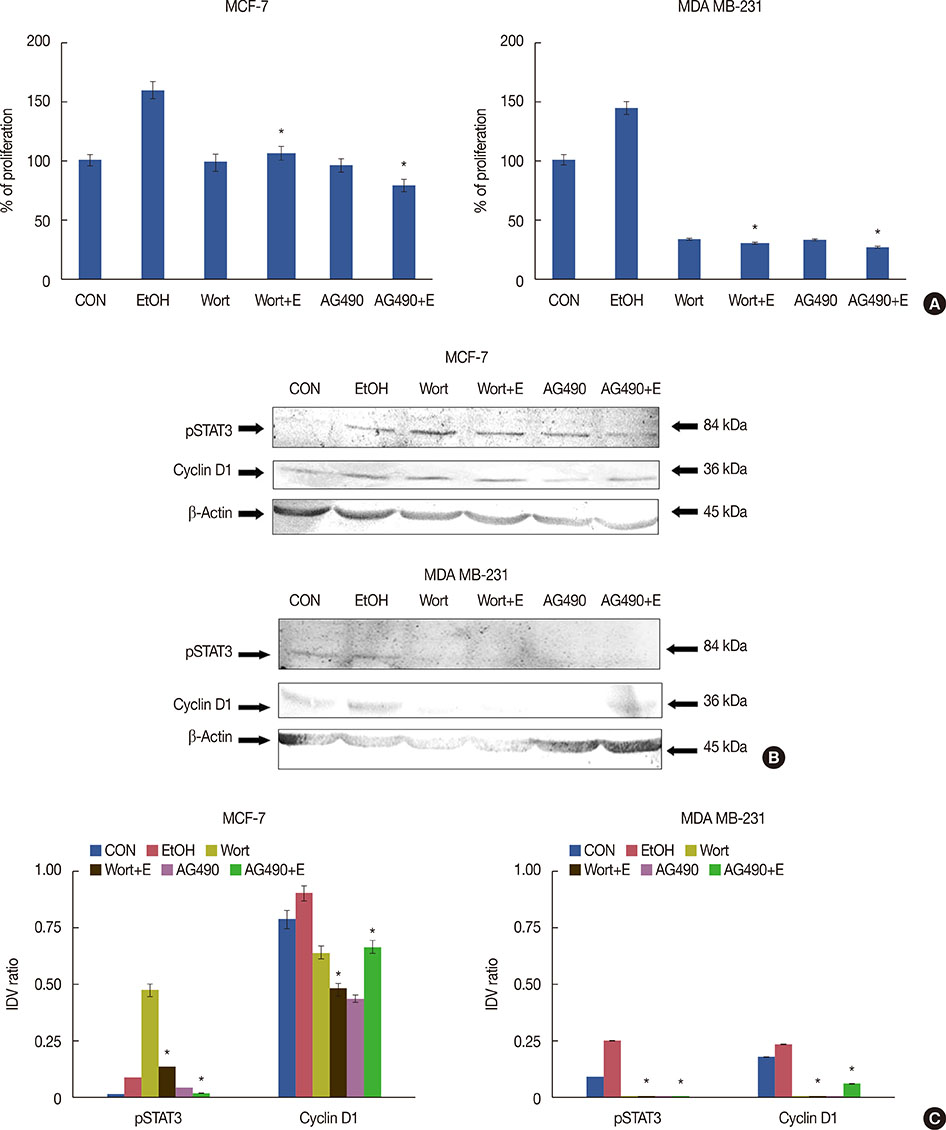
Figure 7 Effect of PI3K and JAK2 inhibitors on EtOH-mediated proliferation at 48 hours. (A) MTT assay in MCF-7 and MDA MB-231 cells. (B) Effect of PI3K and JAK2 inhibitors on STAT3 and cyclin D1 expression using immunoblot analysis. Results were based on three independent experiments performed in triplicates. (C) Expression of target protein normalized with β-actin expression in MCF-7 and MDA MB-231 cells. CON=control; EtOH=ethanol; Wort=wortmannin; Wort+E=wortmannin in presence of ethanol; IDV=Integrated density value. *p≤0.005.
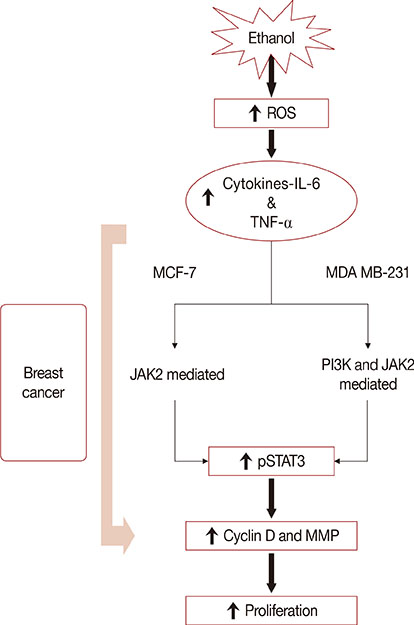
Figure 8 Schematic representation of the proposed mechanism of ethanol-mediated proliferation in MCF-7 (ER+) and MDA MB-231 (ER-) cells. ER=estrogen receptor; ROS=reactive oxygen species; IL-6=interleukin 6; TNF-α=tumor necrosis factor α; PI3K=phosphatidylinositol-3-kinases; JAK2=Janus kinase 2; STAT3=signal transducer and activator of transcription 3; MMP=matrix metalloproteinase.
Reference
-
1. Grivennikov SI, Greten FR, Karin M. Immunity, inflammation, and cancer. Cell. 2010; 140:883–899.
Article2. Oyesanmi O, Snyder D, Sullivan N, Reston J, Treadwell J, Schoelles KM. Alcohol Consumption and Cancer Risk: Understanding Possible Causal Mechanisms for Breast and Colorectal Cancers. Rockville: Agency for Healthcare Research and Quality, U.S. Dept. of Health and Human Services;2010.3. Zhong Q, Shi G, Zhang Y, Lu L, Levy D, Zhong S. Alteration of BRCA1 expression affects alcohol-induced transcription of RNA Pol III-dependent genes. Gene. 2015; 556:74–79.
Article4. Xu M, Bower KA, Wang S, Frank JA, Chen G, Ding M, et al. Cyanidin-3-glucoside inhibits ethanol-induced invasion of breast cancer cells overexpressing ErbB2. Mol Cancer. 2010; 9:285.
Article5. Wang L, Son YO, Ding S, Wang X, Hitron JA, Budhraja A, et al. Ethanol enhances tumor angiogenesis in vitro induced by low-dose arsenic in colon cancer cells through hypoxia-inducible factor 1 alpha pathway. Toxicol Sci. 2012; 130:269–280.
Article6. Xu M, Chen G, Fu W, Liao M, Frank JA, Bower KA, et al. Ethanol disrupts vascular endothelial barrier: implication in cancer metastasis. Toxicol Sci. 2012; 127:42–53.
Article7. Goldberg JE, Schwertfeger KL. Proinflammatory cytokines in breast cancer: mechanisms of action and potential targets for therapeutics. Curr Drug Targets. 2010; 11:1133–1146.
Article8. Carballo M, Conde M, El Bekay R, Martín-Nieto J, Camacho MJ, Monteseirín J, et al. Oxidative stress triggers STAT3 tyrosine phosphorylation and nuclear translocation in human lymphocytes. J Biol Chem. 1999; 274:17580–17586.
Article9. Xiong A, Yang Z, Shen Y, Zhou J, Shen Q. Transcription factor STAT3 as a novel molecular target for cancer prevention. Cancers (Basel). 2014; 6:926–957.
Article10. Posa JK, Selvaraj S, Sangeetha KN, Baskaran SK, Lakshmi BS. p53 mediates impaired insulin signaling in 3T3-L1 adipocytes during hyperinsulinemia. Cell Biol Int. 2014; 38:818–824.
Article11. Sangeetha KN, Sujatha S, Muthusamy VS, Anand S, Nithya N, Velmurugan D, et al. 3Beta-taraxerol of Mangifera indica, a PI3K dependent dual activator of glucose transport and glycogen synthesis in 3T3-L1 adipocytes. Biochim Biophys Acta. 2010; 1800:359–366.
Article12. Shilpa K, Sangeetha KN, Muthusamy VS, Sujatha S, Lakshmi BS. Probing key targets in insulin signaling and adipogenesis using a methanolic extract of Costus pictus and its bioactive molecule, methyl tetracosanoate. Biotechnol Lett. 2009; 31:1837–1841.
Article13. Wong AW, Paulson QX, Hong J, Stubbins RE, Poh K, Schrader E, et al. Alcohol promotes breast cancer cell invasion by regulating the Nm23-ITGA5 pathway. J Exp Clin Cancer Res. 2011; 30:75.
Article14. Bishop JL, Thaper D, Zoubeidi A. The multifaceted roles of STAT3 signaling in the progression of prostate cancer. Cancers (Basel). 2014; 6:829–859.
Article15. Hong J, Holcomb VB, Tekle SA, Fan B, Núñez NP. Alcohol consumption promotes mammary tumor growth and insulin sensitivity. Cancer Lett. 2010; 294:229–235.
Article16. Seitz HK. Alcohol and breast cancer. Breast. 2012; 21:426–427.
Article17. Wagner F, Fink R, Hart R, Lersch C, Dancygier H, Classen M. Ethanol inhibits interferon-gamma secretion by human peripheral lymphocytes. J Stud Alcohol. 1992; 53:277–280.
Article18. Long XE, Gong ZH, Pan L, Zhong ZW, Le YP, Liu Q, et al. Suppression of CDK2 expression by siRNA induces cell cycle arrest and cell proliferation inhibition in human cancer cells. BMB Rep. 2010; 43:291–296.
Article19. Berthet C, Kaldis P. Cdk2 and Cdk4 cooperatively control the expression of Cdc2. Cell Div. 2006; 1:10.20. Wu J, Lv Q, He J, Zhang H, Mei X, Cui K, et al. MicroRNA-188 suppresses G1/S transition by targeting multiple cyclin/CDK complexes. Cell Commun Signal. 2014; 12:66.
Article21. Loayza-Puch F, Drost J, Rooijers K, Lopes R, Elkon R, Agami R. p53 induces transcriptional and translational programs to suppress cell proliferation and growth. Genome Biol. 2013; 14:R32.
Article22. Klampfer L. Cytokines, inflammation and colon cancer. Curr Cancer Drug Targets. 2011; 11:451–464.
Article23. Lin L, Deangelis S, Foust E, Fuchs J, Li C, Li PK, et al. A novel small molecule inhibits STAT3 phosphorylation and DNA binding activity and exhibits potent growth suppressive activity in human cancer cells. Mol Cancer. 2010; 9:217.
Article24. Lian JP, Word B, Taylor S, Hammons GJ, Lyn-Cook BD. Modulation of the constitutive activated STAT3 transcription factor in pancreatic cancer prevention: effects of indole-3-carbinol (I3C) and genistein. Anticancer Res. 2004; 24:133–137.25. Xie TX, Wei D, Liu M, Gao AC, Ali-Osman F, Sawaya R, et al. Stat3 activation regulates the expression of matrix metalloproteinase-2 and tumor invasion and metastasis. Oncogene. 2004; 23:3550–3560.
Article26. Wang L, Luo J, He S. Induction of MMP-9 release from human dermal fibroblasts by thrombin: involvement of JAK/STAT3 signaling pathway in MMP-9 release. BMC Cell Biol. 2007; 8:14.
Article
- Full Text Links
-
- Actions
-
Cited
- CITED
-
- Close
- Share
-
- Similar articles
-
- STAT3 as a Potential Target for Tumor Suppressive Effects of 15-Deoxy-Δ12,14-prostaglandin J2 in Triple Negative Breast Cancer
- Increased Melanoma-Associated Antigen C2 Expression Affords Resistance to Apoptotic Deathin Suspension-Cultured Tumor Cells
- Hydroxyzine Induces Cell Death in Triple-Negative Breast Cancer Cells via Mitochondrial Superoxide and Modulation of Jak2/STAT3 Signaling
- Withaferin-A Inhibits Colon Cancer Cell Growth by Blocking STAT3 Transcriptional Activity
- Isoliquiritigenin Induces Apoptosis via ROS-Mediated Inhibition of p38/mTOR/STAT3 Pathway in Human Melanoma Cells
