Korean J Lab Med.
2006 Jun;26(3):217-222. 10.3343/kjlm.2006.26.3.217.
Comparison between Real-Time PCR and Agarose Gel Electrophoresis for DNA Quantification
- Affiliations
-
- 1Department of Laboratory Medicine, College of Medicine, Chung-Ang University, Seoul, Korea. cpworld@cau.ac.kr
- KMID: 2238890
- DOI: http://doi.org/10.3343/kjlm.2006.26.3.217
Abstract
-
BACKGROUND: Real-time polymerase chain reaction (PCR) is generally regarded as a very accurate and time-saving method, but it is expensive to run. We evaluated the reliability of an inexpensive and a researcher-friendly gel electrophoresis-based PCR method for the quantification of mRNA, and the results were compared with those obtained by real-time PCR.
METHODS
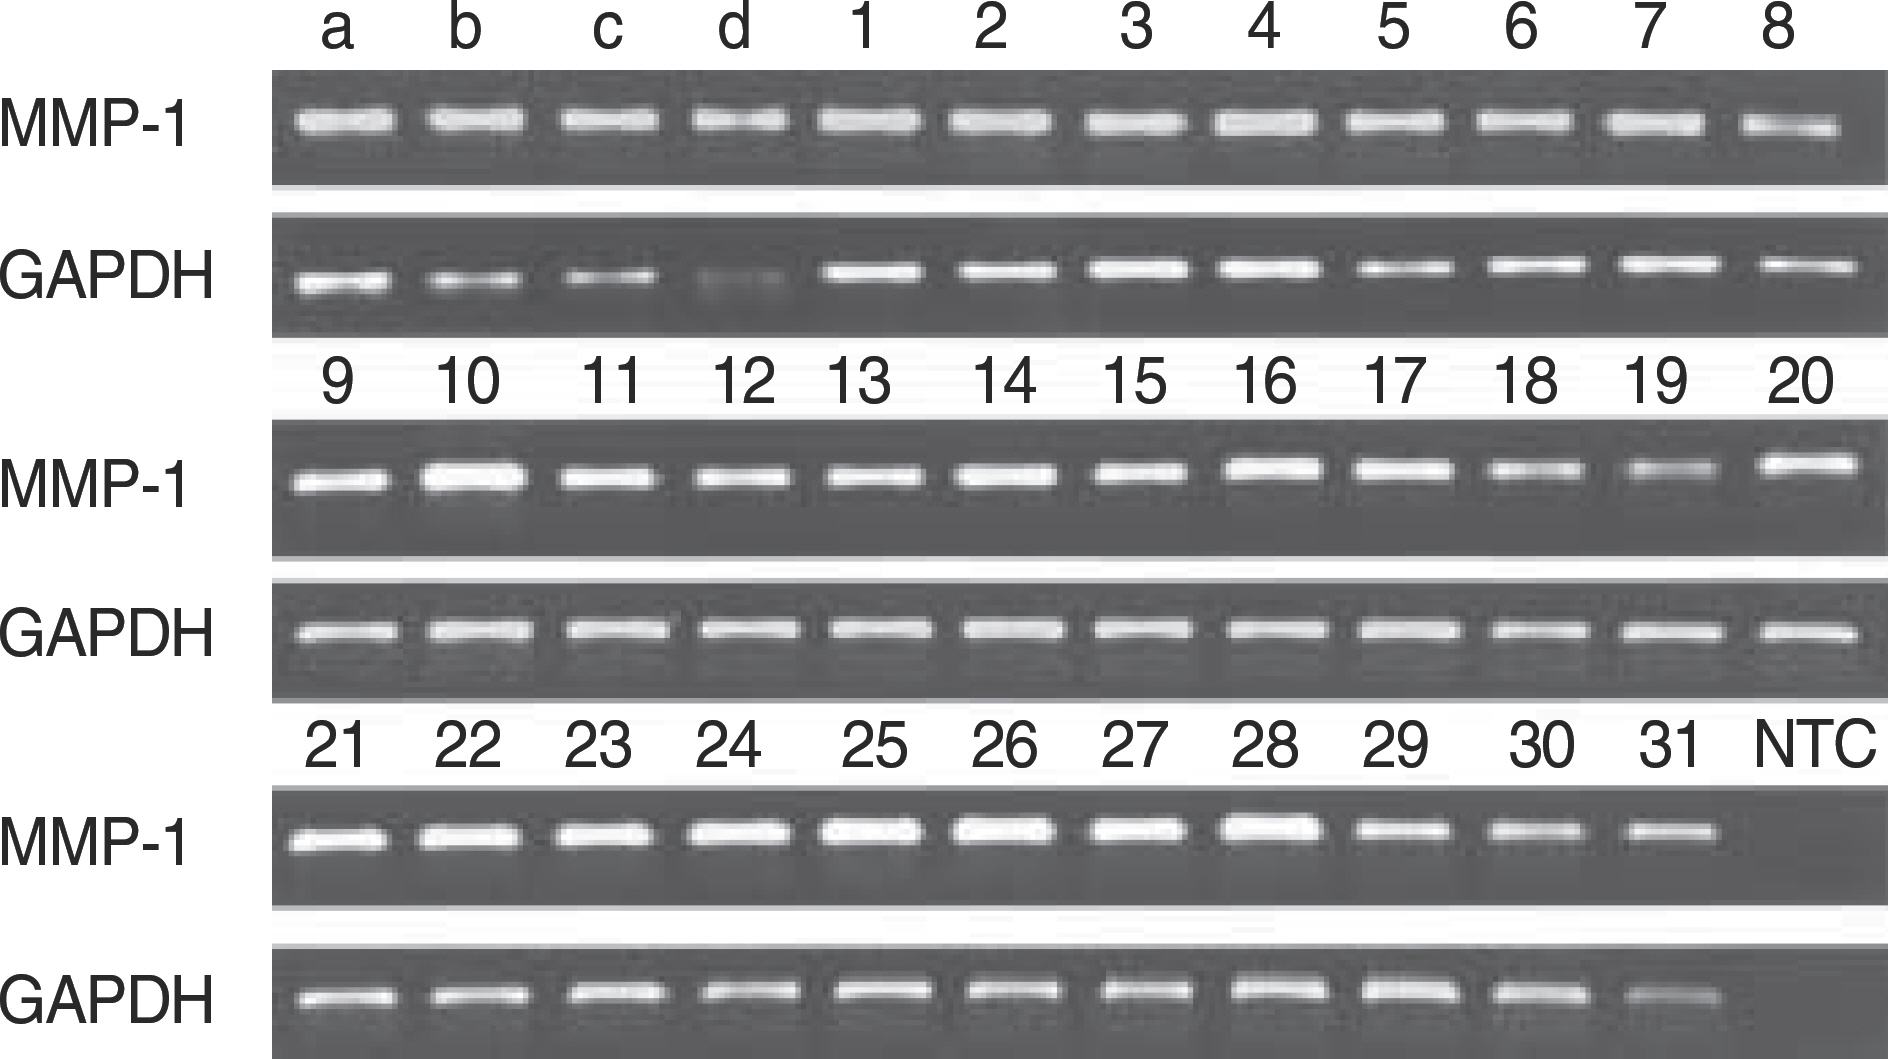
We compared the results of relative quantification for MMP-1 measured by real-time PCR and by ethidium bromide stained-agarose gel electrophoresis after end-point PCR.
RESULTS
There was significant but very weak correlation between real-time PCR and end-point PCR for relative quantification of MMP-1 (r=0.16, P<0.01).
CONCLUSIONS
Our results suggest that the use of the gel electrophoresis-based end-point PCR is inappropriate for quantifying mRNA. Therefore, in order to confirm the result of relative quantification by end-point PCR, the newly established real-time PCR method or northern hybridization should be applied.
MeSH Terms
Figure
Reference
-
References
1. Mullis KB, Faloona FA. Specific synthesis of DNA in vitro via a polymerase-catalyzed chain reaction. Methods Enzymol. 1987; 155:335–50.
Article2. Parker RM, Barnes NM. mRNA: detection by in situ and northern hybridization. Methods Mol Biol. 1999; 106:247–83.
Article3. Hod Y. A simplified ribonuclease protection assay. Biotechniques. 1992; 13:852–4.4. Clarke PA, te Poele R, Wooster R, Workman P. Gene expression microarray analysis in cancer biology, pharmacology, and drug development: progress and potential. Biochem Pharmacol. 2001; 62:1311–36.5. Bustin SA. Absolute quantification of mRNA using real-time reverse transcription polymerase chain reaction assays. J Mol Endocrinol. 2000; 25:169–93.
Article6. Wang T, Brown MJ. mRNA quantification by real time TaqMan polymerase chain reaction: validation and comparison with RNase protection. Anal Biochem. 1999; 269:198–201.
Article7. Holland PM, Abramson RD, Watson R, Gelfand DH. Detection of specific polymerase chain reaction product by utilizing the 5′→ 3′ exonuclease activity of Thermus aquaticus DNA polymerase. Proc Natl Acad Sci USA. 1991; 88:7276–80.8. Higuchi R, Fockler C, Dollinger G, Watson R. Kinetic PCR analysis: real-time monitoring of DNA amplification reactions. Biotechnology. 1993; 11:1026–30.
Article9. Ovstebo R, Haug KB, Lande K, Kierulf P. PCR-based calibration curves for studies of quantitative gene expression in human monocytes: development and evaluation. Clin Chem. 2003; 49:425–32.10. Heid CA, Stevens J, Livak KJ, Williams PM. Real time quantitative PCR. Genome Res. 1996; 6:986–94.
Article11. Wittwer CT, Herrmann MG, Moss AA, Rasmussen RP. Continuous fluorescence monitoring of rapid cycle DNA amplification. Biotechniques. 1997; 22(130–1):134–8.
Article12. Schmittgen TD, Zakrajsek BA, Mills AG, Gorn V, Singer MJ, Reed MW. Quantitative reverse transcription-polymerase chain reaction to study mRNA decay: comparison of endpoint and real-time methods. Anal Biochem. 2000; 285:194–204.
Article13. Heath PJ, Clendenning JB, Fujimoto BS, Schurr JM. Effect of bending strain on the torsion elastic constant of DNA. J Mol Biol. 1996; 260:718–30.
Article14. Schneeberger C, Speiser P, Kury F, Zeillinger R. Quantitative detection of reverse transcriptase-PCR products by means of a novel and sensitive DNA stain. PCR Method Appl. 1995; 4:234–8.
Article15. Hall LL, Bicknell GR, Primrose L, Pringle JH, Shaw JA, Furness PN. Reproducibility in the quantification of mRNA levels by RT-PCR-ELISA and RT competitive-PCR-ELISA. BioTechniques. 1998; 24:652–8.
Article16. Siddiqi AM, Jennings VM, Kidd MR, Actor JK, Hunter RL. Evaluation of electrochemiluminescence- and bioluminescence-based assays for quantitating specific DNA. J Clin Lab Anal. 1996; 10:423–31.
Article17. Hayward-Lester A, Oefner PJ, Sabatini S, Doris PA. Accurate and absolute quantitative measurement of gene expression by single-tube RT-PCR and HPLC. Genome Res. 1995; 5:494–9.
Article18. Borson ND, Strausbauch MA, Wettstein PJ, Oda RP, Johnston SL, Landers JP. Direct quantitation of RNA transcripts by competitive single-tube RT-PCR and capillary electrophoresis. Biotechniques. 1998; 25:130–7.
Article19. Huber R, Kunisch E, Gluck B, Egerer R, Sickinger S, Kinne RW. Comparison of conventional and real-time RT-PCR for the quantitation of jun protooncogene mRNA and analysis of junB mRNA expression in synovial membranes and isolated synovial fibroblasts from rheumatoid arthritis patients. Z Rheumatol. 2003; 62:378–89.20. Bradford WD, Cahoon L, Freel SR, Hoopes LL, Eckdahl TT. An inexpensive gel electrophoresis-based polymerase chain reaction method for quantifying mRNA levels. Cell Biol Educ. 2005; 4:157–68.
Article21. Frade JP, Warnock DW, Arthington-Skaggs BA. Rapid quantification of drug resistance gene expression in Candida albicans by reverse transcriptase LightCycler PCR and fluorescent probe hybridization. J Clin Microbiol. 2004; 42:2085–93.
- Full Text Links
- Actions
-
Cited
- CITED
-
- Close
- Share
- Similar articles
-
- Apolipoprotein E Genotyping Using Polymerase Chain Reaction-Restriction Fragment Length Polymorphism with General-Purpose Agarose and Lithium Borate Buffer
- Kidd (SLC14A1 rs1058396) Genotyping Performed by PCR-Restriction Fragment Length Polymorphism Using a General-Purpose Agarose Gel and Lithium Borate Buffer
- Influence of Standard Curves on Relative Quantification using Real-time PCR
- Comparison Study of Molecular Diagnostic Reagents for COVID-19 Pooling Test
- Studies on the Development of Viral Detection Markers for the Quality Control of Blood


