Korean Diabetes J.
2008 Aug;32(4):304-316. 10.4093/kdj.2008.32.4.304.
Effects of Food Restriction on Phenotypes of TALLYHO/JngJ Mouse
- Affiliations
-
- 1Korea Research Institute of Chemical Technology, Korea.
- 2College of Veterinary Medicine, Chungnam National University, Korea.
- KMID: 2029817
- DOI: http://doi.org/10.4093/kdj.2008.32.4.304
Abstract
-
BACKGROUND: Food restriction has been reported to ameliorate diabetes and obesity. In this study, we examined the effects of the food restriction on phenotypes of TALLYHO/JngJ (TH) mouse, a recently developed diabetic model animal.
METHODS
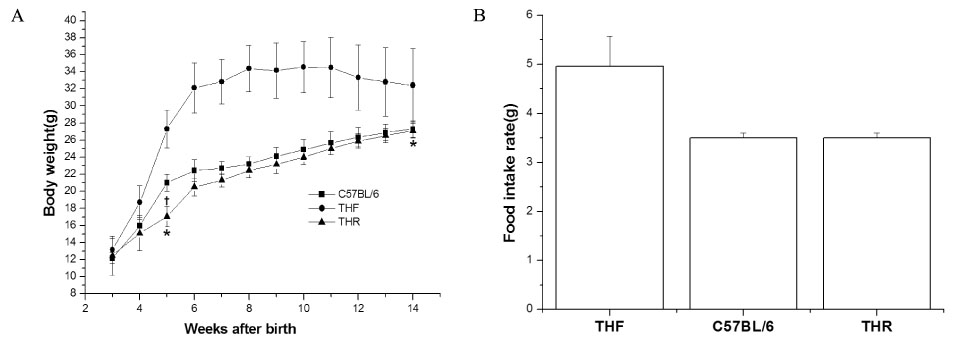
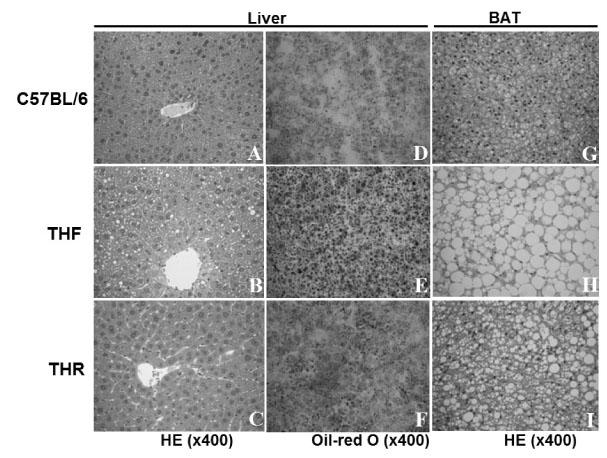
3 week-old TH mice were divided into 2 groups (n = 20 each for food-restricted (THR) and free-fed (THF)) and THR mice were fed the same amount of food as normal control mice (C57BL/6, n = 20). Body weight was weekly monitored till 14 weeks of age. The half of animals were sacrificed at 8 weeks of age, and liver, kidney, and fat weight were measured. The histopathology of liver and brown fat tissues and mRNA expression of leptin in adipose tissue were analyzed. The oral glucose tolerance test and insulin resistance test was done at 14 weeks of age. The plasma concentrations of glucose, free fatty acid, triglyceride, cholesterol and leptin were analyzed.
RESULTS
The THR mice had lower body weights than the THF mice, similar to C57BL/6 mice, with reduced fat deposition in liver and brown fat tissue. The plasma levels of glucose, triglyceride and free fatty acid were decreased in the THR group. The THR mice, however, carried more fat than normal mice, with increased plasma leptin concentration and leptin mRNA expression in fats and no alteration in plasma cholesterol levels. Furthermore, the THR mice revealed glucose intolerance with impaired after-meal insulin secretion and slight insulin resistance
CONCLUSION
The food restriction apparently ameliorated the obesity and diabetic phenotypes of TH mice. However, plasma concentration of cholesterol were not improved in THR mice with increased adiposity index and glucose intolerance, suggesting the genetically prone tendency of obesity and diabetes development in TH mice possibly with an impairment in cholesterol metabolism.
Keyword
MeSH Terms
Figure
Reference
-
1. Ravussin E, Bogardus C. Energy balance and weight regulation: genetics versus environment. Br J Nutr. 2000. 83:suppl 1. S17–S20.2. Stein CJ, Colditz GA. The epidemic of obesity. J Clin Endocrinol Metab. 2004. 89:2522–2525.3. Bray GA, York DA. Hypothalamic and genetic obesity in experimental animals: an autonomic and endocrine hypothesis. Physiol Rev. 1979. 59:719–809.4. Levin N, Nelson C, Gurney A, Vandlen R, de Sauvage F. Decreased food intake does not completely account for adiposity reduction after ob protein infusion. Proc Natl Acad Sci USA. 1996. 93:1726–1730.5. Lowell BB, Spiegelman BM. Towards a molecular understanding of adaptive thermogenesis. Nature. 2000. 404:652–660.6. Kopelman PG. Obesity as a medical proble. Nature. 2000. 404:635–643.7. Kissebah AH, Vydelingum N, Murray R, Evans DJ, Hartz AJ, Kalkhoff RK, Adams PW. Relation of body fat distribution to metabolic complications of obesity. J Clin Endocrinol Metab. 1982. 54:254–260.8. McCay CM. Nutrition in relation to aging. Gastroenterologia. 1953. 80:193–203.9. Simonen P, Gylling H, Miettinen TA. Acute effects of weight reduction on cholesterol metabolism in obese type 2 diabetes. Clin Chim Acta. 2002. 316:55–61.10. Williams KV, Mullen ML, Kelley DE, Wing RR. The effect of short periods of caloric restriction on weight loss and glycemic control in type 2 diabetes. Diabetes Care. 1998. 21:2–8.11. Mahoney LB, Denny CA, Seyfried TN. Caloric restriction in C57BL/6J mice mimics therapeutic fasting in humans. Lipids Health Dis. 2006. 5:13.12. Park SY, Choi GH, Choi HI, Ryu J, Jung CY, Lee W. Calorie restriction improves whole-body glucose disposal and insulin resistance in association with the increased adipocyte-specific GLUT4 expression in Otsuka Long-Evans Tokushima fatty rats. Arch Biochem Biophys. 2005. 436:276–284.13. Hansen BC, Bodkin NL. Primary prevention of diabetes mellitus by prevention of obesity in monkeys. Diabetes. 1993. 42:1809–1814.14. Kemnitz JW, Roecker EB, Weindruch R, Elson DF, Baum ST, Bergman RN. Dietary restriction increases insulin sensitivity and lowers blood glucose in rhesus monkeys. Am J Physiol. 1994. 266:E540–E547.15. Walford RL, Harris SB, Gunion MW. The calorically restricted low-fat nutrient-dense diet in Biosphere 2 significantly lowers blood glucose, total leukocyte count, cholesterol, and blood pressure in humans. Proc Natl Acad Sci USA. 1992. 89:11533–11537.16. Kriketos AD, Gan SK, Poynten AM, Furler SM, Chisholm DJ, Campbell LV. Exercise increases adiponectin levels and insulin sensitivity in humans. Diabetes Care. 2004. 27:629–630.17. Shoji T, Nishizawa Y, Koyama H, Hagiwara S, Aratani H, Sasao K, Kishimoto H, Tanishita H, Morii H. High-density-lipoprotein metabolism during a very-low-calorie diet. Am J Clin Nutr. 1992. 56:suppl 1. S297–S298.18. Shimokawa I, Higami Y, Tsuchiya T, Otani H, Komatsu T, Chiba T, Yamaza H. Life span extension by reduction of the growth hormone-insulin-like growth factor-1 axis: relation to caloric restriction. FASEB J. 2003. 17:1108–1109.19. Kim JH, Sen S, Avery CS, Simpson E, Chandler P, Nishina PM, Churchill GA, Naggert JK. Genetic analysis of a new mouse model for non-insulin-dependent diabetes. Genomics. 2001. 74:273–286.21. Kim JH, Stewart TP, Soltani-Bejnood M, Wang L, Fortuna JM, Mostafa OA, Moustaid-Moussa N, Shoieb AM, McEntee MF, Wang Y, Bechtel L, Naggert JK. Phenotypic characterization of polygenic type 2 diabetes in TALLYHO/JngJ mice. J Endocrinol. 2006. 191:437–446.22. Sung YY, Lee YS, Jung WH, Kim HY, Cheon HG, Yang SD, Rhee SD. Glucose intolerance in young TallyHo mice is induced by leptin-mediated inhibition of insulin secretion. Biochem Biophys Res Commun. 2005. 338:1779–1787.23. Didion SP, Lynch CM, Faraci FM. Cerebral vascular dysfunction in TallyHo mice: a new model of Type II diabetes. Am J Physiol Heart Circ Physio. 2007. 292:H1579–H1583.24. Martins IJ, Tran JM, Redgrave TG. Food restriction normalizes chylomicron remnant metabolism in murine models of obesity as assessed by a novel stable isotope breath test. J Nut. 2002. 132:176–181.25. Ahima RS, Flier JS. Leptin. Annu Rev Physiol. 2000. 62:413–437.26. Zhang Y, Guo KY, Diaz PA, Heo M, Leibel RL. Determinants of leptin gene expression in fat depots of lean mice. Am J Physiol Regul Integr Comp Physiol. 2002. 282:R226–R234.27. Villafuerte BC, Fine JB, Bai Y, Zhao W, Fleming S, DiGirolamo M. Expressions of leptin and insulin-like growth factor-I are highly correlated and region-specific in adipose tissue of growing rats. Obes Res. 2000. 8:646–655.28. Brochu M, Tchernof A, Turner AN, Ades PA, Poehlman ET. Is there a threshold of visceral fat loss that improves the metabolic profile in obese postmenopausal women? Metabolism. 2003. 52:599–604.29. Okauchi N, Mizuno A, Yoshimoto S, Zhu M, Sano T, Shima K. Is caloric restriction effective in preventing diabetes mellitus in the Otsuka Long Evans Tokushima fatty rat, a model of spontaneous non-insulin-dependent diabetes mellitus? Diabetes Res Clin Pract. 1995. 27:97–106.30. Kawashiri MA, Rader DJ. Gene therapy for lipid disorders. Curr Control Trials Cardiovasc Med. 2000. 1:120–127.31. Wang H, Chen J, Hollister K, Sowers LC, Forman BM. Endogenous bile acids are ligands for the nuclear receptor FXR/BAR. Mol Cell. 1999. 3:543–555.32. Chisholm JW, Hong J, Mills SA, Lawn RM. The LXR ligand T0901317 induces severe lipogenesis in the db/db diabetic mouse. J Lipid Res. 2006. 44:2039–2048.33. Zeinoaldini S, Swarts JJ, Van de Heijning BJ. Chronic leptin infusion advances, and immunoneutralization of leptin postpones puberty onsetin normally fed and feed restricted female rats. Peptides. 2006. 27:1652–1658.34. Pi-Sunyer FX. Weight and non-insulin-dependent diabetes mellitus. Am J Clin Nutr. 1996. 63:suppl 3. S426–S429.35. Ruderman N, Chisholm D, Pi-Sunyer X, Schneider S. The metabolically obese, normal-weight individual revisited. Diabetes. 1998. 47:699–713.36. Morton NM, Holmes MC, Fievet C, Staels B, Tailleux A, Mullins JJ, Seckl JR. Improved lipid and lipoprotein profile, hepatic insulin sensitivity, and glucose tolerance in 11beta-hydroxysteroid dehydrogenase type 1 null mice. J Biol Chem. 2001. 276:41293–41300.37. Peeke PM, Chrousos GP. Hypercortisolism and obesity. Ann N Y Acad Sci. 1995. 771:665–676.


