Korean J Radiol.
2013 Jun;14(3):477-486. 10.3348/kjr.2013.14.3.477.
Application of 31P MR Spectroscopy to the Brain Tumors
- Affiliations
-
- 1Department of Radiology, College of Medicine, Dong-A University, Busan 602-715, Korea. sschoi317@yahoo.co.kr
- 2Department of Neurosurgery, College of Medicine, Dong-A University, Busan 602-715, Korea.
- KMID: 1705463
- DOI: http://doi.org/10.3348/kjr.2013.14.3.477
Abstract
OBJECTIVE
To evaluate the clinical feasibility and obtain useful parameters of 31P magnetic resonance spectroscopy (MRS) study for making the differential diagnosis of brain tumors.
MATERIALS AND METHODS
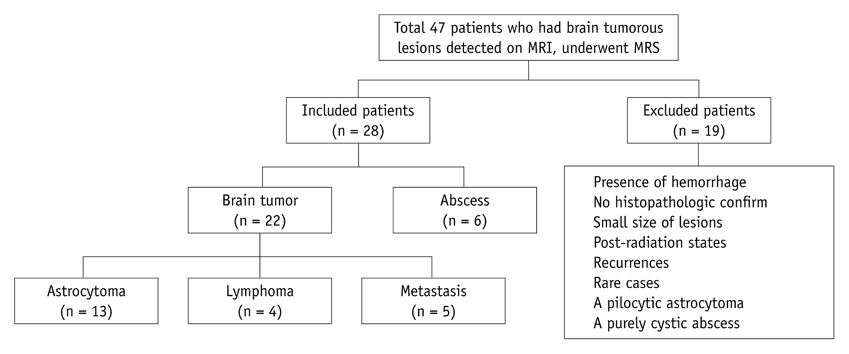
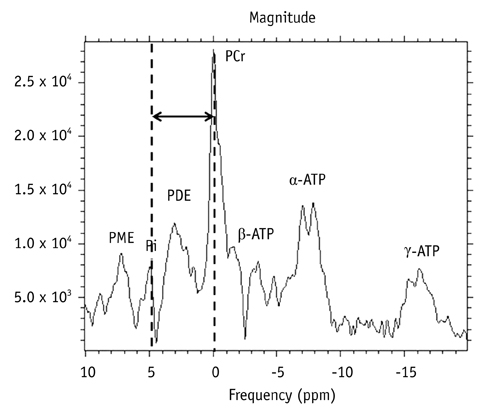
Twenty-eight patients with brain tumorous lesions (22 cases of brain tumor and 6 cases of abscess) and 11 normal volunteers were included. The patients were classified into the astrocytoma group, lymphoma group, metastasis group and the abscess group. We obtained the intracellular pH and the metabolite ratios of phosphomonoesters/phosophodiesters (PME/PDE), PME/inorganic phosphate (Pi), PDE/Pi, PME/adenosine triphosphate (ATP), PDE/ATP, PME/phosphocreatine (PCr), PDE/PCr, PCr/ATP, PCr/Pi, and ATP/Pi, and evaluated the statistical significances.
RESULTS
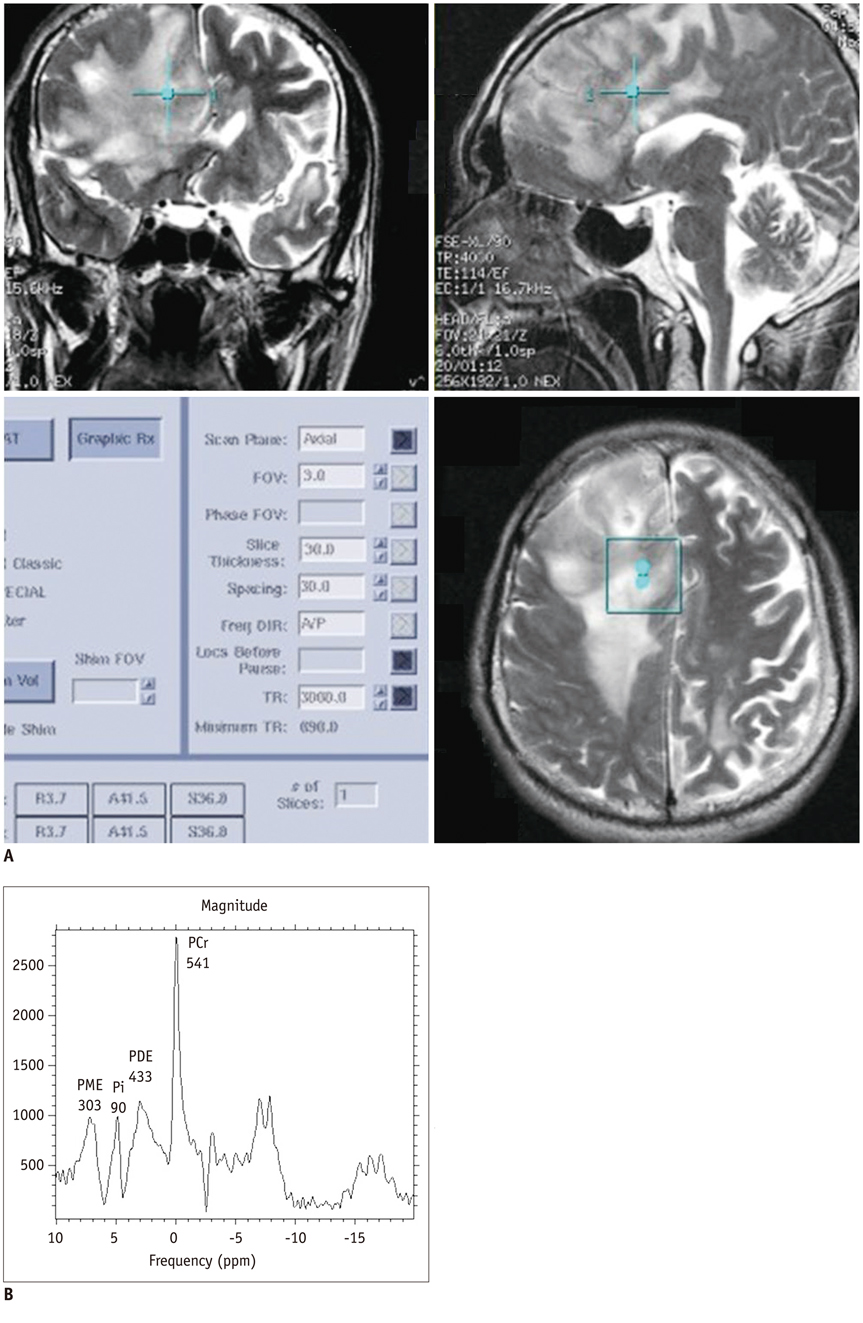
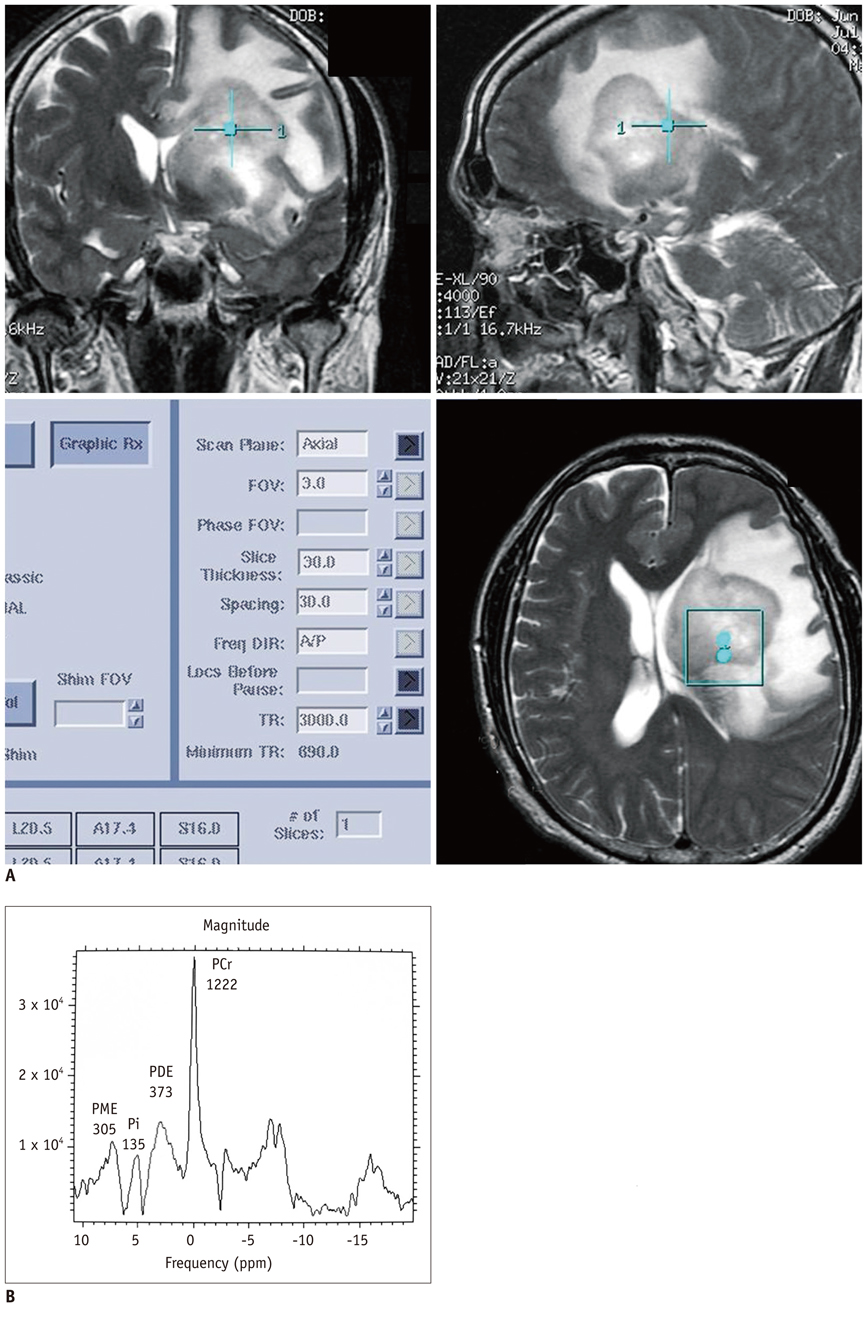
The brain tumors had a tendency of alkalization (pH = 7.28 +/- 0.27, p = 0.090), especially the pH of the lymphoma was significantly increased (pH = 7.45 +/- 0.32, p = 0.013). The brain tumor group showed increased PME/PDE ratio compared with that in the normal control group (p = 0.012). The ratios of PME/PDE, PDE/Pi, PME/PCr and PDE/PCr showed statistically significant differences between each brain lesion groups (p < 0.05). The astrocytoma showed an increased PME/PDE and PME/PCr ratio. The ratios of PDE/Pi, PME/PCr, and PDE/PCr in lymphoma group were lower than those in the control group and astrocytoma group. The metastasis group showed an increased PME/PDE ratio, compared with that in the normal control group.
CONCLUSION
We have obtained the clinically applicable 31P MRS, and the pH, PME/PDE, PDE/Pi, PME/PCr, and PDE/PCr ratios are helpful for differentiating among the different types of brain tumors.
Keyword
MeSH Terms
-
Adolescent
Adult
Aged
Aged, 80 and over
Astrocytoma/diagnosis/*metabolism
Brain Abscess/diagnosis/*metabolism
*Brain Chemistry
Brain Neoplasms/diagnosis/*metabolism/secondary
Case-Control Studies
Diagnosis, Differential
Feasibility Studies
Female
Humans
Hydrogen-Ion Concentration
Lymphoma/diagnosis/*metabolism
Magnetic Resonance Imaging
Magnetic Resonance Spectroscopy/*methods
Male
Middle Aged
Phosphorus/diagnostic use
Prospective Studies
Young Adult
Phosphorus
Figure
Reference
-
1. Stubbs M, Rodrigues LM, Gusterson BA, Griffiths JR. Monitoring tumor growth and regression by 31P magnetic resonance spectroscopy. Adv Enzyme Regul. 1990. 30:217–230.2. Podo F, Canevari S, Canese R, Pisanu ME, Ricci A, Iorio E. MR evaluation of response to targeted treatment in cancer cells. NMR Biomed. 2011. 24:648–672.3. Park JM, Park JH. Human in-vivo 31P MR spectroscopy of benign and malignant breast tumors. Korean J Radiol. 2001. 2:80–86.4. Cohen JS. Phospholipid and energy metabolism of cancer cells monitored by 31P magnetic resonance spectroscopy: possible clinical significance. Mayo Clin Proc. 1988. 63:1199–1207.5. Lehnhardt FG, Röhn G, Ernestus RI, Grüne M, Hoehn M. 1H- and (31)P-MR spectroscopy of primary and recurrent human brain tumors in vitro: malignancy-characteristic profiles of water soluble and lipophilic spectral components. NMR Biomed. 2001. 14:307–317.6. Heiss WD, Heindel W, Herholz K, Rudolf J, Bunke J, Jeske J, et al. Positron emission tomography of fluorine-18-deoxyglucose and image-guided phosphorus-31 magnetic resonance spectroscopy in brain tumors. J Nucl Med. 1990. 31:302–310.7. Hirakawa K, Naruse S, Higuchi T, Horikawa Y, Tanaka C, Ebisu T. The investigation of experimental brain tumours using 31P-MRS and 1H-MRI. Acta Neurochir Suppl (Wien). 1988. 43:140–144.8. Maintz D, Heindel W, Kugel H, Jaeger R, Lackner KJ. Phosphorus-31 MR spectroscopy of normal adult human brain and brain tumours. NMR Biomed. 2002. 15:18–27.9. Arias-Mendoza F, Payne GS, Zakian KL, Schwarz AJ, Stubbs M, Stoyanova R, et al. In vivo 31P MR spectral patterns and reproducibility in cancer patients studied in a multi-institutional trial. NMR Biomed. 2006. 19:504–512.10. Ng TC, Majors AW, Vijayakumar S, Baldwin NJ, Thomas FJ, Koumoundouros I, et al. Human neoplasm pH and response to radiation therapy: P-31 MR spectroscopy studies in situ. Radiology. 1989. 170(3 Pt 1):875–878.11. Estève F, Grand S, Rubin C, Hoffmann D, Pasquier B, Graveron-Demilly D, et al. MR spectroscopy of bilateral thalamic gliomas. AJNR Am J Neuroradiol. 1999. 20:876–881.12. Oberhaensli RD, Galloway GJ, Hilton-Jones D, Bore PJ, Styles P, Rajagopalan B, et al. The study of human organs by phosphorus-31 topical magnetic resonance spectroscopy. Br J Radiol. 1987. 60:367–373.13. Madden A, Leach MO, Sharp JC, Collins DJ, Easton D. A quantitative analysis of the accuracy of in vivo pH measurements with 31P NMR spectroscopy: assessment of pH measurement methodology. NMR Biomed. 1991. 4:1–11.14. Gillies RJ, Raghunand N, Karczmar GS, Bhujwalla ZM. MRI of the tumor microenvironment. J Magn Reson Imaging. 2002. 16:430–450.15. Griffiths JR. Are cancer cells acidic? Br J Cancer. 1991. 64:425–427.16. Negendank W. Studies of human tumors by MRS: a review. NMR Biomed. 1992. 5:303–324.17. Hubesch B, Sappey-Marinier D, Roth K, Meyerhoff DJ, Matson GB, Weiner MW. P-31 MR spectroscopy of normal human brain and brain tumors. Radiology. 1990. 174:401–409.18. Okada Y, Kloiber O, Hossmann KA. Regional metabolism in experimental brain tumors in cats: relationship with acid/base, water, and electrolyte homeostasis. J Neurosurg. 1992. 77:917–926.19. Albers MJ, Krieger MD, Gonzalez-Gomez I, Gilles FH, McComb JG, Nelson MD Jr, et al. Proton-decoupled 31P MRS in untreated pediatric brain tumors. Magn Reson Med. 2005. 53:22–29.20. Neeman M, Degani H. Metabolic studies of estrogen- and tamoxifen-treated human breast cancer cells by nuclear magnetic resonance spectroscopy. Cancer Res. 1989. 49:589–594.21. Aisen AM, Chenevert TL. MR spectroscopy: clinical perspective. Radiology. 1989. 173:593–599.22. Podo F. Tumour phospholipid metabolism. NMR Biomed. 1999. 12:413–439.23. Abraha A, Shim H, Wehrle JP, Glickson JD. Inhibition of tumor cell proliferation by dexamethasone: 31P NMR studies of RIF-1 fibrosarcoma cells perfused in vitro. NMR Biomed. 1996. 9:173–178.24. Arnold DL, Emrich JF, Shoubridge EA, Villemure JG, Feindel W. Characterization of astrocytomas, meningiomas, and pituitary adenomas by phosphorus magnetic resonance spectroscopy. J Neurosurg. 1991. 74:447–453.25. Kemp GJ, Meyerspeer M, Moser E. Absolute quantification of phosphorus metabolite concentrations in human muscle in vivo by 31P MRS: a quantitative review. NMR Biomed. 2007. 20:555–565.26. Burkhard T, Herzog C, Linzbach S, Spyridopoulos I, Huebner F, Vogl TJ. Cardiac (31)P-MRS compared to echocardiographic findings in patients with hypertensive heart disease without overt systolic dysfunction--preliminary results. Eur J Radiol. 2009. 71:69–74.27. Schulz UG, Blamire AM, Davies P, Styles P, Rothwell PM. Normal cortical energy metabolism in migrainous stroke: A 31P-MR spectroscopy study. Stroke. 2009. 40:3740–3744.28. Skoch A, Jiru F, Bunke J. Spectroscopic imaging: basic principles. Eur J Radiol. 2008. 67:230–239.29. Keevil SF, Newbold MC. The performance of volume selection sequences for in vivo NMR spectroscopy: implications for quantitative MRS. Magn Reson Imaging. 2001. 19:1217–1226.
- Full Text Links
- Actions
-
Cited
- CITED
-
- Close
- Share
- Similar articles
-
- Human in-vivo 31P MR Spectroscopy of Benign and Malignant Breast Tumors
- Localized, water-suppressed in vivo H MR spectroscopy of human brain tumors: Preliminary results
- In Vivo 31P Magnetic Resonance Spectroscopy in Liver Cirrhosis: Assessment of Phosphorus Metabolites accordingto Hepatic Dysfunction
- In vivo31P MR Spectroscopy of Breast Tumors: Preliminary Results
- Mannitol as a Potential Pitfall for Peak Assignment on Magnetic Resonance Spectra (MRS) for Brain Tumors: A Case Report

