Influence of Bâ‚-Inhomogeneity on Pharmacokinetic Modeling of Dynamic Contrast-Enhanced MRI: A Simulation Study
- Affiliations
-
- 1Department of Radiology, Research Institute of Radiology, Asan Medical Center, University of Ulsan College of Medicine, Seoul 05505, Korea. kim.jeongkon@gmail.com
- 2Center for Bioimaging of New Drug Development, Asan Institute for Life Sciences, Asan Medical Center, University of Ulsan College of Medicine, Seoul 05505, Korea.
- 3Department of Radiology, Seoul National University College of Medicine, Seoul National University Bundang Hospital, Seongnam 13620, Korea.
- 4Department of Surgery, National Health Insurance Service Ilsan Hospital, Goyang 10444, Korea.
- 5Biomedical Engineering, Ulsan National Institute of Science and Technology, Ulsan 44919, Korea.
- KMID: 2427227
- DOI: http://doi.org/10.3348/kjr.2017.18.4.585
Abstract
OBJECTIVE
To simulate the Bâ‚-inhomogeneity-induced variation of pharmacokinetic parameters on dynamic contrast-enhanced magnetic resonance imaging (DCE-MRI).
MATERIALS AND METHODS
Bâ‚-inhomogeneity-induced flip angle (FA) variation was estimated in a phantom study. Monte Carlo simulation was performed to assess the FA-deviation-induced measurement error of the pre-contrast Râ‚, contrast-enhancement ratio, Gd-concentration, and two-compartment pharmacokinetic parameters (K(trans), v(e), and v(p)).
RESULTS
Bâ‚-inhomogeneity resulted in −23-5% fluctuations (95% confidence interval [CI] of % error) of FA. The 95% CIs of FA-dependent % errors in the gray matter and blood were as follows: −16.7-61.8% and −16.7-61.8% for the pre-contrast Râ‚, −1.0-0.3% and −5.2-1.3% for the contrast-enhancement ratio, and −14.2-58.1% and −14.1-57.8% for the Gd-concentration, respectively. These resulted in −43.1-48.4% error for K(trans), −32.3-48.6% error for the v(e), and −43.2-48.6% error for v(p). The pre-contrast Râ‚ was more vulnerable to FA error than the contrast-enhancement ratio, and was therefore a significant cause of the Gd-concentration error. For example, a −10% FA error led to a 23.6% deviation in the pre-contrast Râ‚, −0.4% in the contrast-enhancement ratio, and 23.6% in the Gd-concentration. In a simulated condition with a 3% FA error in a target lesion and a −10% FA error in a feeding vessel, the % errors of the pharmacokinetic parameters were −23.7% for K(trans), −23.7% for v(e), and −23.7% for v(p).
CONCLUSION
Even a small degree of Bâ‚-inhomogeneity can cause a significant error in the measurement of pharmacokinetic parameters on DCE-MRI, while the vulnerability of the pre-contrast Râ‚ calculations to FA deviations is a significant cause of the miscalculation.
Keyword
MeSH Terms
Figure
-
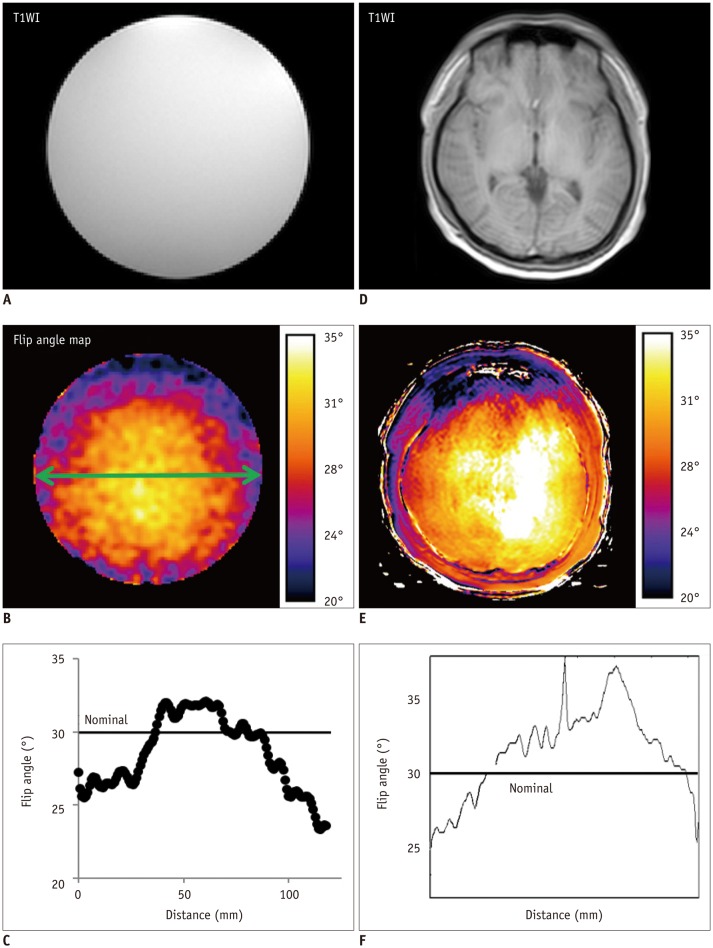
Fig. 1 Location-dependent distribution of B1-inhomogeneity-induced flip angle deviation measured in water phantom (A-C) and normal brain (D-F).Actual flip angle is greater than nominal flip angle at image center, whereas it was less at periphery. T1WI = T1-weighted image
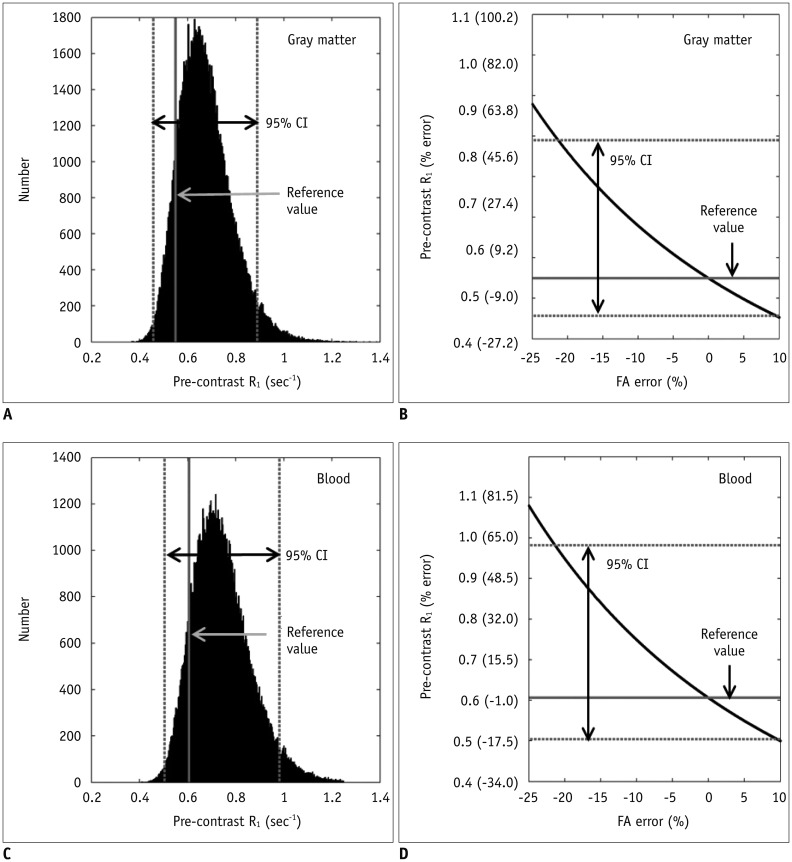
Fig. 2 B1-inhomogeneity-induced variation of pre-contrast R1 in gray matter (reference value, 0.549 sec−1) and blood (reference value, 0.606 sec−1).A. Distribution of actual values of pre-contrast R1 in gray matter. 95% CI of % error is −16.7–61.8%. B. Negative correlation between % error of FA and that of pre-contrast R1 in gray matter. Actual R1 is greater than reference value when actual FA was less than nominal FA, and vice versa. C. Distribution of actual values of pre-contrast R1 in blood. 95% CI of % error is −16.7–61.8%. D. Negative correlation between % error of FA and that of pre-contrast R1 in blood. Actual R1 is greater than reference value when actual FA was less than nominal FA, and vice versa. CI = confidence interval, FA = flip angle
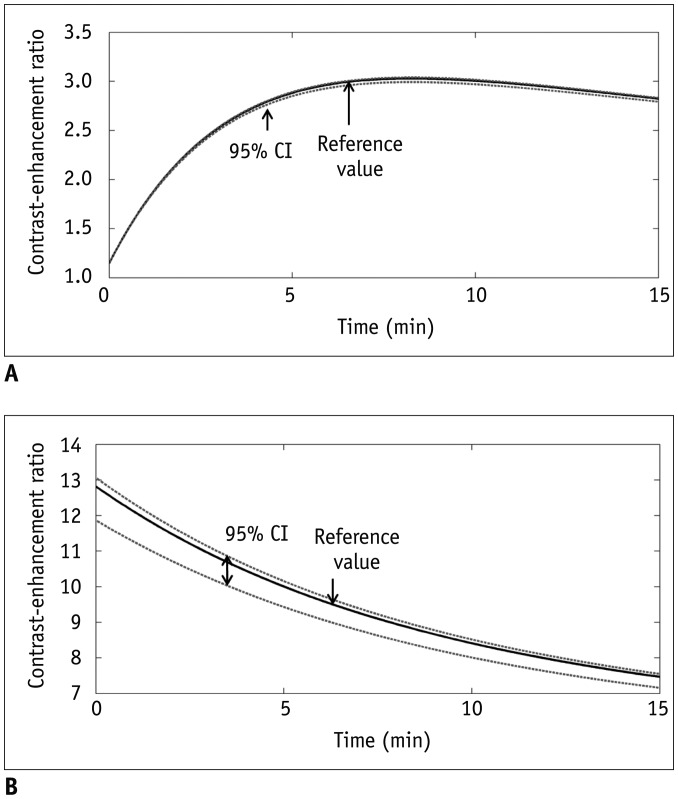
Fig. 3 B1-inhomogeneity-induced variation of contrastenhancement ratio in gray matter and blood.A. Reference and actual curves of time-dependent contrastenhancement ratio in gray matter. 95% CI of % error is −1.0–0.3%. B. Reference and actual curves of time-dependent contrast-enhancement ratio in blood. 95% CI of % error is −5.2–1.3%. CI = confidence interval
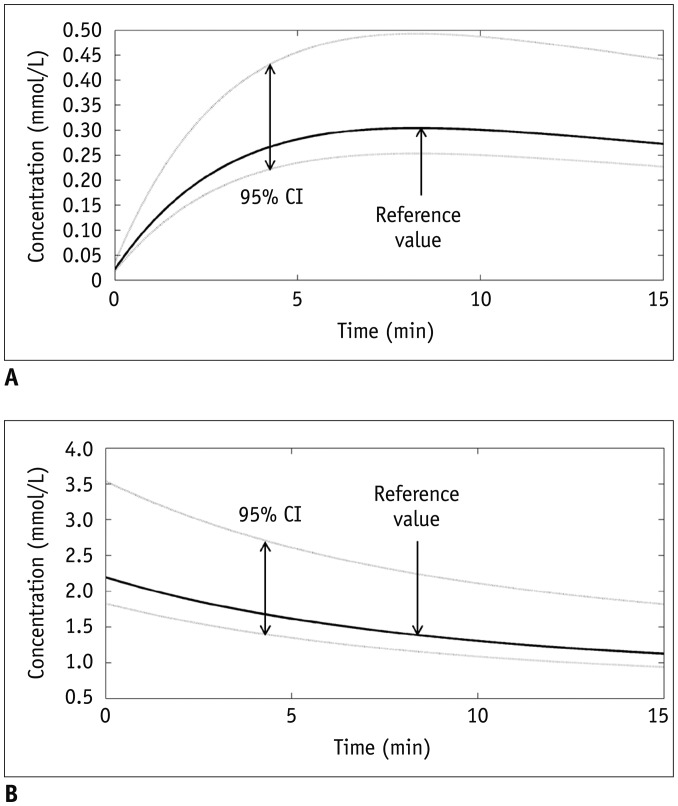
Fig. 4 B1-inhomogeneity-induced variation of Gd-concentration in gray matter and blood.A. Reference and actual curves of time-dependent Gd-concentration in gray matter. 95% CI of % error is −14.2–58.1%. B. Reference and actual curves of time-dependent Gd-concentration in blood. 95% CI of % error is −14.1–57.8%. CI = confidence interval
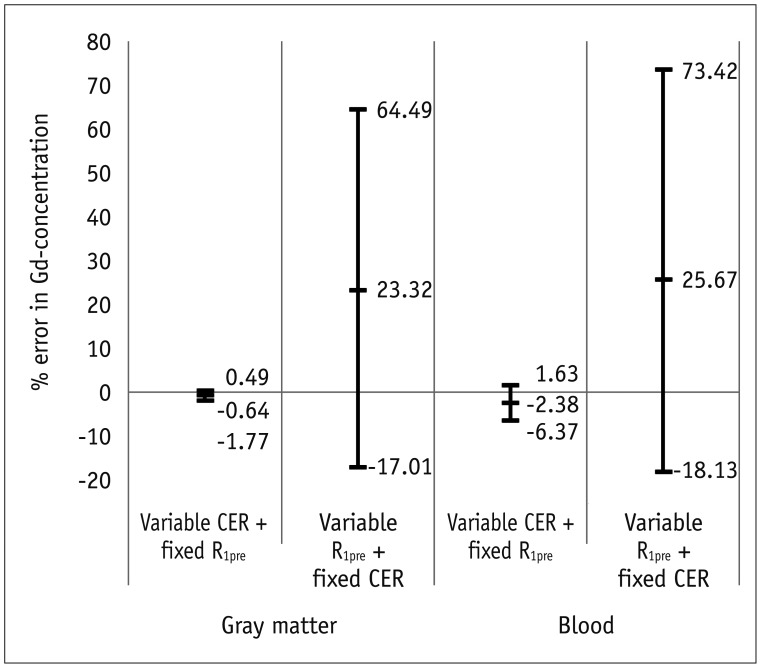
Fig. 5 Influence of erroneous pre-contrast R1 and CER on calculation of Gd-concentration.Simulation was performed while either of these two parameters was applied as reference value and other as actual value. % error range of Gd-concentration is significantly wider by R1 error than by CER error. CER = contrast-enhancement ratio, R1pre = pre-contrat R1
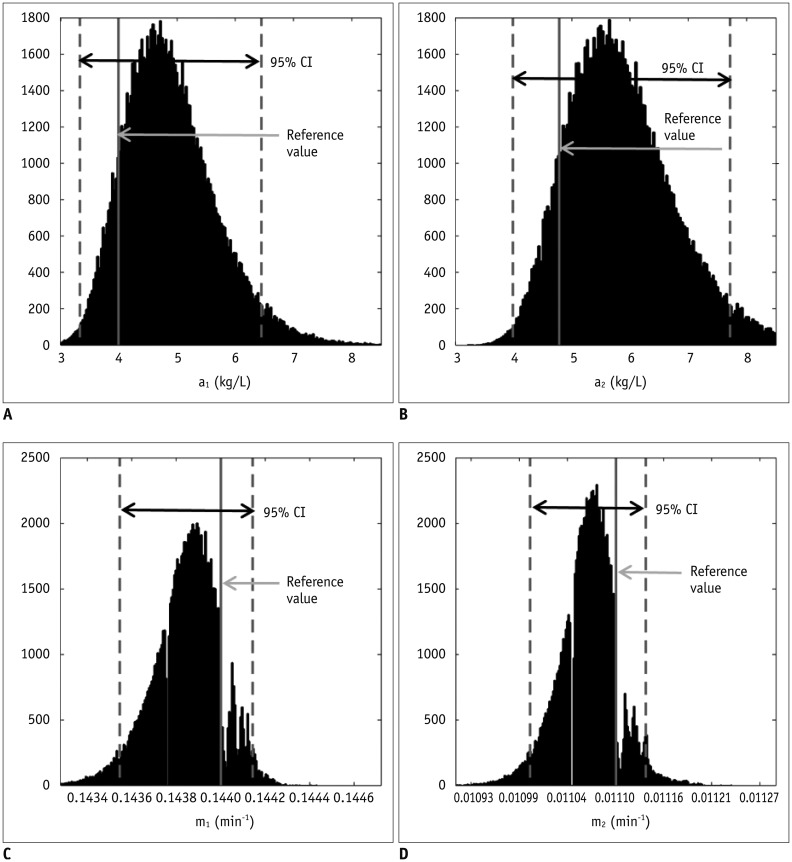
Fig. 6 B1-inhomogeneity-induced variation of four parameters that characterize arterial input function.95% CI of % error are −16.5–61.3% for a1 (A), −16.4–61.2% for a2 (B), −0.3–0.1% for m1 (C), and −0.8–0.3% for m2 (D). CI = confidence interval
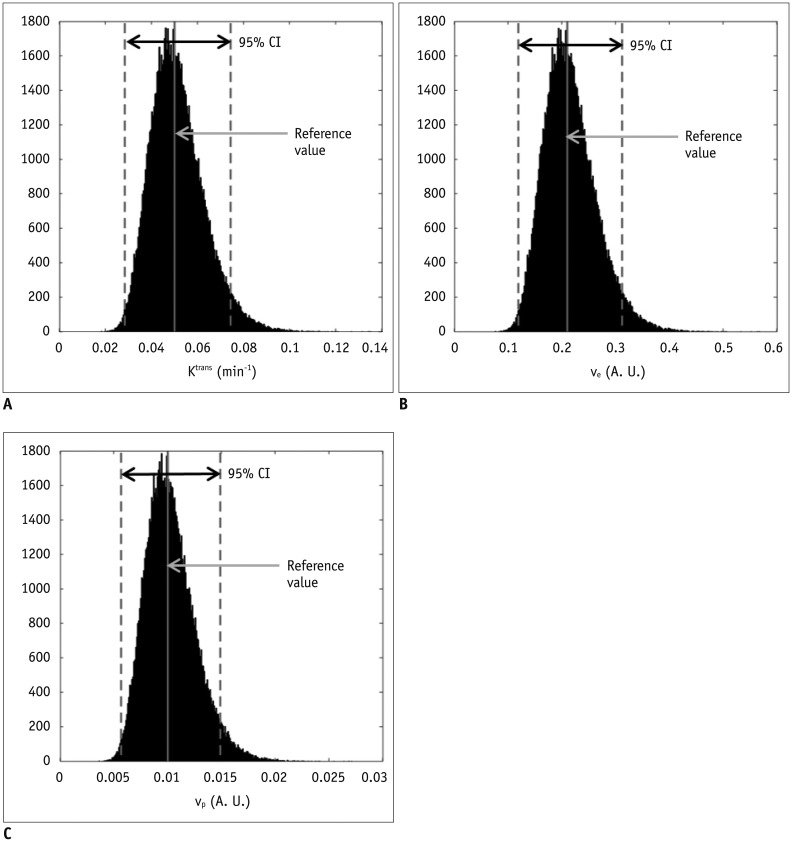
Fig. 7 Example case that simulates actual situation reflecting influence of B1-inhomogeneity on pharmacokinetic modeling of DCE-MRI.In this simulation, target lesion in image center has 3% FA deviation and feeding vessel in image periphery has −10% FA deviation, which leads to measurement error occurring in each calculation step of pharmacokinetic modeling. Finally, % errors for pharmacokinetic parameters were −23.7% for Ktrans (A), −23.7% for ve (B), and −23.7% for vp (C). A. U. = arbitrary unit, CI = confidence interval, DCE-MRI = dynamic contrast-enhanced magnetic resonance imaging
Reference
-
1. Li SP, Padhani AR. Tumor response assessments with diffusion and perfusion MRI. J Magn Reson Imaging. 2012; 35:745–763. PMID: 22434697.
Article2. Jahng GH, Li KL, Ostergaard L, Calamante F. Perfusion magnetic resonance imaging: a comprehensive update on principles and techniques. Korean J Radiol. 2014; 15:554–577. PMID: 25246817.
Article3. Paik W, Kim HS, Choi CG, Kim SJ. Pre-operative perfusion skewness and kurtosis are potential predictors of progression-free survival after partial resection of newly diagnosed glioblastoma. Korean J Radiol. 2016; 17:117–126. PMID: 26798224.
Article4. Wang CH, Yin FF, Horton J, Chang Z. Review of treatment assessment using DCE-MRI in breast cancer radiation therapy. World J Methodol. 2014; 4:46–58. PMID: 25332905.
Article5. van Schie JJ, Lavini C, van Vliet LJ, Vos FM. Feasibility of a fast method for B1-inhomogeneity correction for FSPGR sequences. Magn Reson Imaging. 2015; 33:312–318. PMID: 25460328.
Article6. Tofts PS, Brix G, Buckley DL, Evelhoch JL, Henderson E, Knopp MV, et al. Estimating kinetic parameters from dynamic contrast-enhanced T(1)-weighted MRI of a diffusable tracer: standardized quantities and symbols. J Magn Reson Imaging. 1999; 10:223–232. PMID: 10508281.
Article7. Azlan CA, Di Giovanni P, Ahearn TS, Semple SI, Gilbert FJ, Redpath TW. B1 transmission-field inhomogeneity and enhancement ratio errors in dynamic contrast-enhanced MRI (DCE-MRI) of the breast at 3T. J Magn Reson Imaging. 2010; 31:234–239. PMID: 20027594.8. Dietrich O, Reiser MF, Schoenberg SO. Artifacts in 3-T MRI: physical background and reduction strategies. Eur J Radiol. 2008; 65:29–35. PMID: 18162353.
Article9. Di Giovanni P, Azlan CA, Ahearn TS, Semple SI, Gilbert FJ, Redpath TW. The accuracy of pharmacokinetic parameter measurement in DCE-MRI of the breast at 3 T. Phys Med Biol. 2010; 55:121–132. PMID: 20009182.
Article10. Kuhl CK, Kooijman H, Gieseke J, Schild HH. Effect of B1 inhomogeneity on breast MR imaging at 3.0 T. Radiology. 2007; 244:929–930. PMID: 17709843.11. Sung K, Daniel BL, Hargreaves BA. Transmit B1+ field inhomogeneity and T1 estimation errors in breast DCE-MRI at 3 tesla. J Magn Reson Imaging. 2013; 38:454–459. PMID: 23292822.12. Yarnykh VL. Actual flip-angle imaging in the pulsed steady state: a method for rapid three-dimensional mapping of the transmitted radiofrequency field. Magn Reson Med. 2007; 57:192–200. PMID: 17191242.
Article13. Ahearn TS, Staff RT, Redpath TW, Semple SI. The use of the Levenberg-Marquardt curve-fitting algorithm in pharmacokinetic modelling of DCE-MRI data. Phys Med Biol. 2005; 50:N85–N92. PMID: 15843726.
Article14. Deoni SC. High-resolution T1 mapping of the brain at 3T with driven equilibrium single pulse observation of T1 with high-speed incorporation of RF field inhomogeneities (DESPOT1-HIFI). J Magn Reson Imaging. 2007; 26:1106–1111. PMID: 17896356.
Article15. Schabel MC, Morrell GR. Uncertainty in T(1) mapping using the variable flip angle method with two flip angles. Phys Med Biol. 2009; 54:N1–N8. PMID: 19060359.16. Quantitative Imaging Biomarkers Alliance. Profile: DCE MRI Quantification. 2015. Accessed December 23. Available at: http://qibawiki.rsna.org/images/7/7b/DCEMRIProfile_v1_6-20111213.pdf.17. Khalifa F, Soliman A, El-Baz A, Abou El-Ghar M, El-Diasty T, Gimel'farb G, et al. Models and methods for analyzing DCE-MRI: a review. Med Phys. 2014; 41:124301. PMID: 25471985.
Article18. Weissleder R, Cheng HC, Marecos E, Kwong K, Bogdanov A Jr. Non-invasive in vivo mapping of tumour vascular and interstitial volume fractions. Eur J Cancer. 1998; 34:1448–1454. PMID: 9849430.
Article19. Tofts PS. Modeling tracer kinetics in dynamic Gd-DTPA MR imaging. J Magn Reson Imaging. 1997; 7:91–101. PMID: 9039598.
Article20. Willinek WA, Gieseke J, Kukuk GM, Nelles M, König R, Morakkabati-Spitz N, et al. Dual-source parallel radiofrequency excitation body MR imaging compared with standard MR imaging at 3.0 T: initial clinical experience. Radiology. 2010; 256:966–975. PMID: 20720078.
Article21. Pineda FD, Medved M, Fan X, Karczmar GS. B1 and T1 mapping of the breast with a reference tissue method. Magn Reson Med. 2016; 75:1565–1573. PMID: 26014575.
Article22. Brix G, Semmler W, Port R, Schad LR, Layer G, Lorenz WJ. Pharmacokinetic parameters in CNS Gd-DTPA enhanced MR imaging. J Comput Assist Tomogr. 1991; 15:621–628. PMID: 2061479.
Article23. Hoffmann U, Brix G, Knopp MV, Hess T, Lorenz WJ. Pharmacokinetic mapping of the breast: a new method for dynamic MR mammography. Magn Reson Med. 1995; 33:506–514. PMID: 7776881.
Article24. Scharf J, Kemmling A, Hess T, Mehrabi A, Kauffmann G, Groden C, et al. Assessment of hepatic perfusion in transplanted livers by pharmacokinetic analysis of dynamic magnetic resonance measurements. Invest Radiol. 2007; 42:224–229. PMID: 17351428.
Article25. Ma HT, Griffith JF, Yeung DK, Leung PC. Modified brix model analysis of bone perfusion in subjects of varying bone mineral density. J Magn Reson Imaging. 2010; 31:1169–1175. PMID: 20432353.
Article26. Kiessling F, Lichy M, Grobholz R, Heilmann M, Farhan N, Michel MS, et al. Simple models improve the discrimination of prostate cancers from the peripheral gland by T1-weighted dynamic MRI. Eur Radiol. 2004; 14:1793–1801. PMID: 15232714.
Article
- Full Text Links
-
- Actions
-
Cited
- CITED
-
- Close
- Share
-
- Similar articles
-
- Evolving role of modeling and simulation in drug development
- Dynamic Contrast-Enhanced MRI and Its Applications in Various Central Nervous System Diseases
- A semi-compartmental model describing the pharmacokinetic-pharmacodynamic relationship
- Usefulness of a Pharmacokinetic Model Based on Dynamic Contrast-enhanced MRI for the Detection and Localization of Prostate Cancer
- PKconverter: R package to convert the pharmacokinetic parameters
