A semi-compartmental model describing the pharmacokinetic-pharmacodynamic relationship
- Ki S
 1
1
- Affiliations
-
- 1Department of Anesthesiology and Pain Medicine, Inje University Busan Paik Hospital, Inje University College of Medicine, Busan, Korea
- KMID: 2500448
- DOI: http://doi.org/10.17085/apm.2020.15.1.1
Abstract
- Frequently, we encounter the phenomenon of hysteresis in kinetic-dynamic modeling. The hysteresis loop in the concentration-effect curve suggests a time discrepancy caused by various pharmacokinetic and pharmacodynamic factors. To collapse the hysteresis loop and to simplify the concentration-effect relationship, several kinetic-dynamic modeling approaches including the effect compartment link model, turnover model (indirect response model), and tolerance/rebound model, have been used. The semicompartmental model is one method to describe the hysteresis of the pharmacokineticpharmacodynamic relationship. Furthermore, this semi-compartmental model differs from other models (full parametric approaches) as it does not require pharmacokinetic parameters to estimate pharmacodynamic parameters and ke0. Therefore, we could employ a semi-compartmental approach in case it is difficult to apply the compartment model to pharmacokinetic data, as required for the pharmacodynamic analysis of inhalational anesthetics.
Figure
-
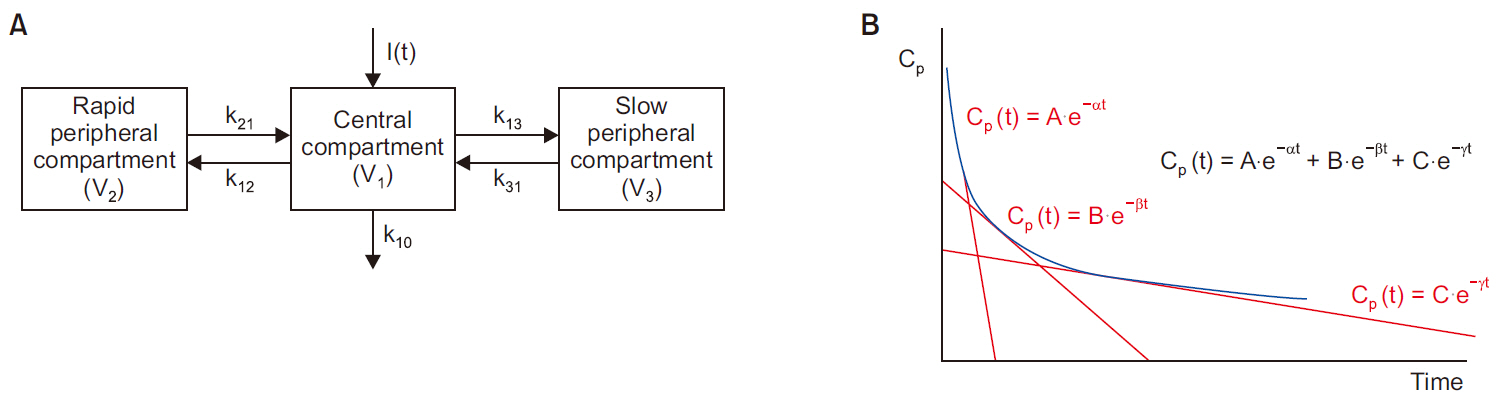
Fig. 1 Three-compartment model. (A) Scheme for three-compartment model. (B) Time-concentration curve plotted on semi-logarithmic scale in the three-compartment model following an intravenous bolus administration. I(t): drug dose (input), Vi: distribution volume of compartment i, kij: inter-compartmental fractional rate constant (micro-rate constant from compartment i to compartment j), Cp: drug concentration in plasma, A, B, C: coefficient (macro-constant), α, β, γ: exponent (macro-constant slope).
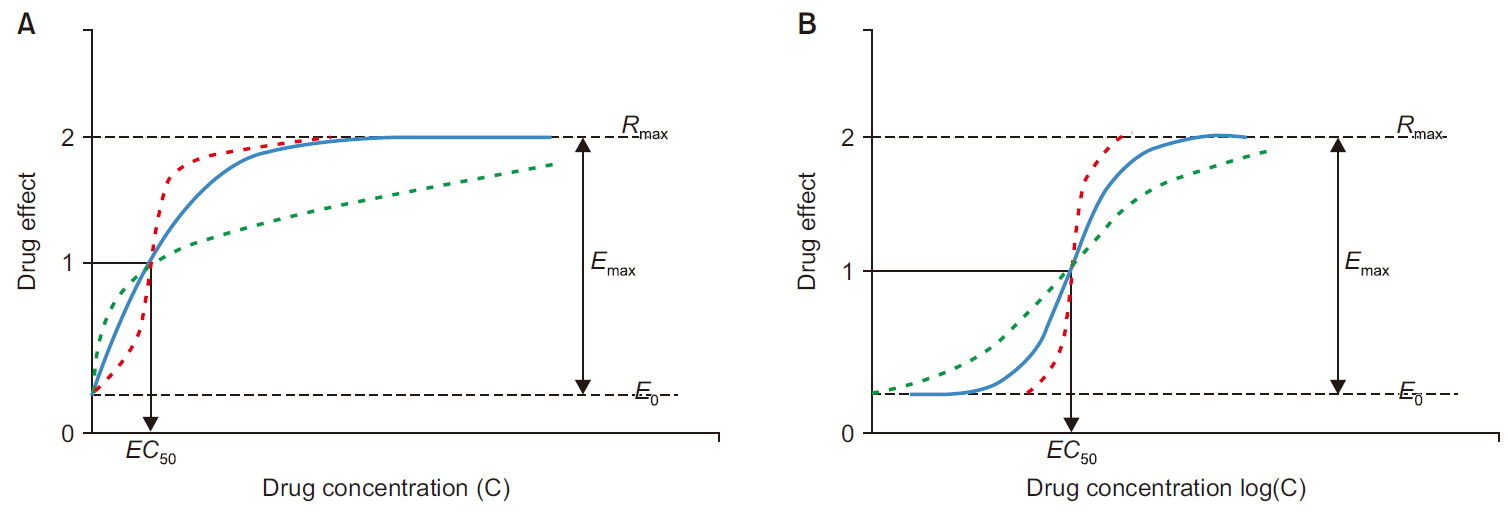
Fig. 2 The excitatory sigmoid Emax model with baseline (E0) on linear scale (A) and semi-logarithmic scale (B); when n (steepness factor) increases, the steepness of the tangent to the curve at EC50 increases (n of the red dotted line is larger than the blue solid line, and n of the green dotted line is smaller than the blue solid line). Emax: efficacy, the difference between baseline (E0) and maximum observed effect (Rmax), EC50: potency, the plasma concentration corresponding to the half of Emax. The figure is modified from the article of Gabrielsson et al. (Pharmacodynamic concepts 2016; 199-332) [7].
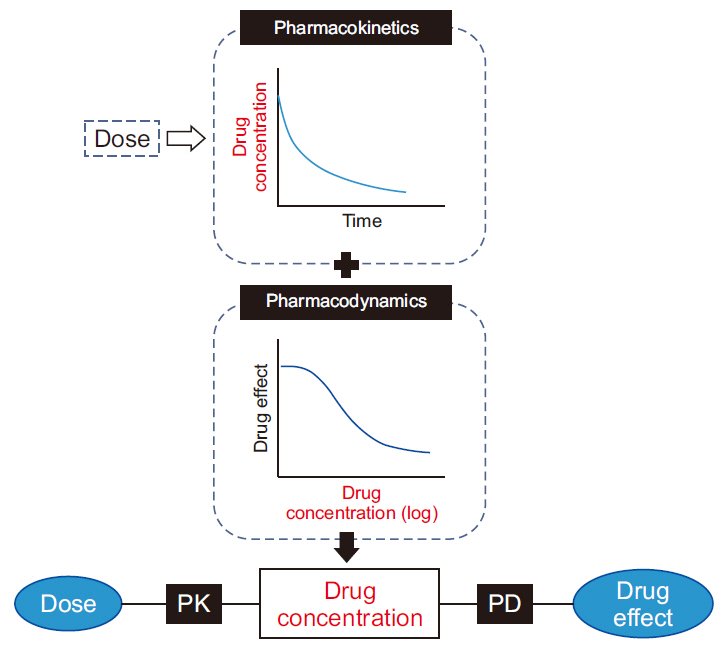
Fig. 3 Schema of presenting of the dose-effect relationship using pharmacokinetic (PK) and pharmacodynamic (PD) models.
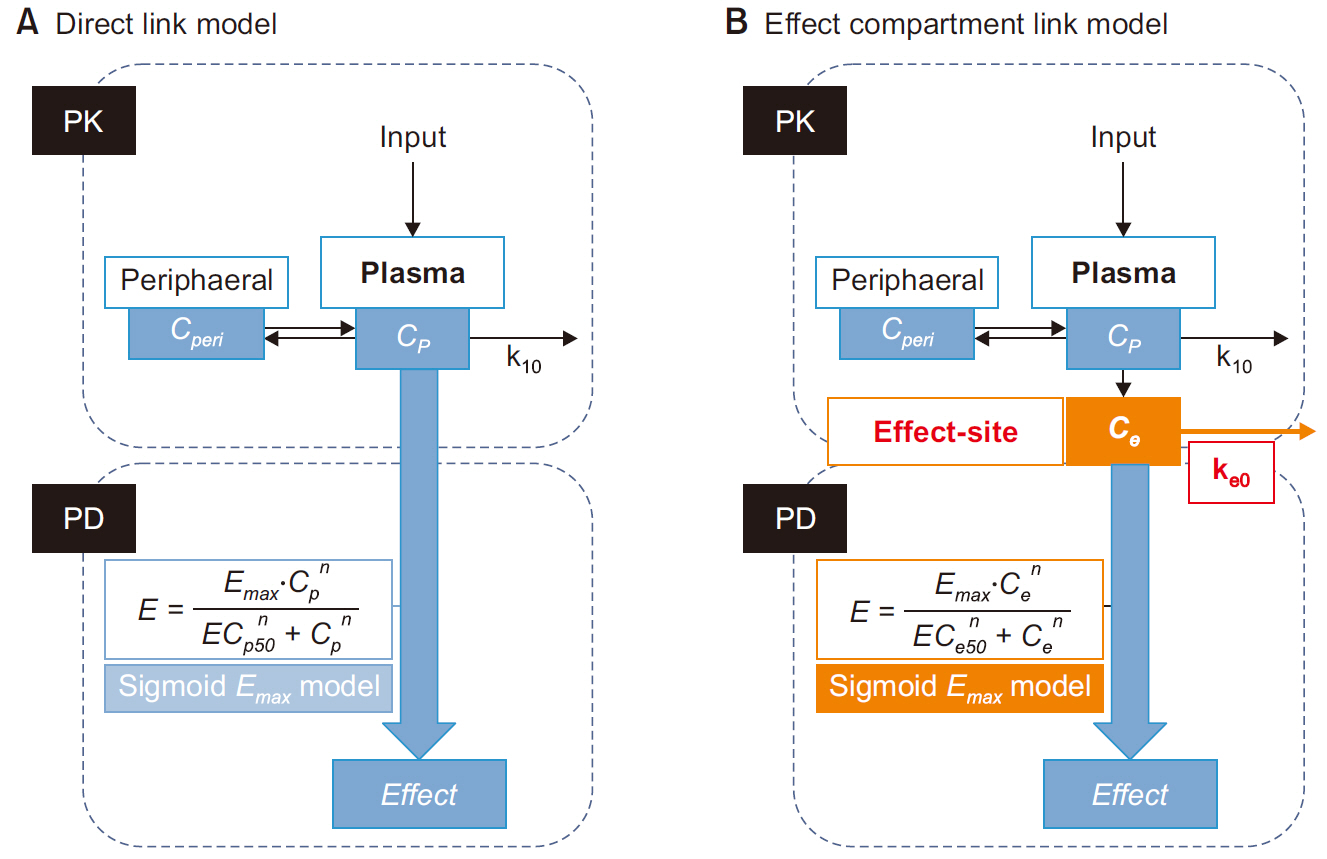
Fig. 4 Direct link model (A) vs. effect compartment link model (B). (A) In direct link model, measured plasma concentration (Cp) and observed effect (Effect) are linked directly. (B) In the effect compartment link model, an indirect link model, Cp and Effect are linked indirectly via a hypothetical effect site concentration (Ce). input: administrated drug dose, k10, ke0: first- order rate constants, Cp: measured plasma concentration, Ce: effect site concentration, Effect (E): observed effect, the effect is mediated by an arbitrarily chosen sigmoid Emax model.
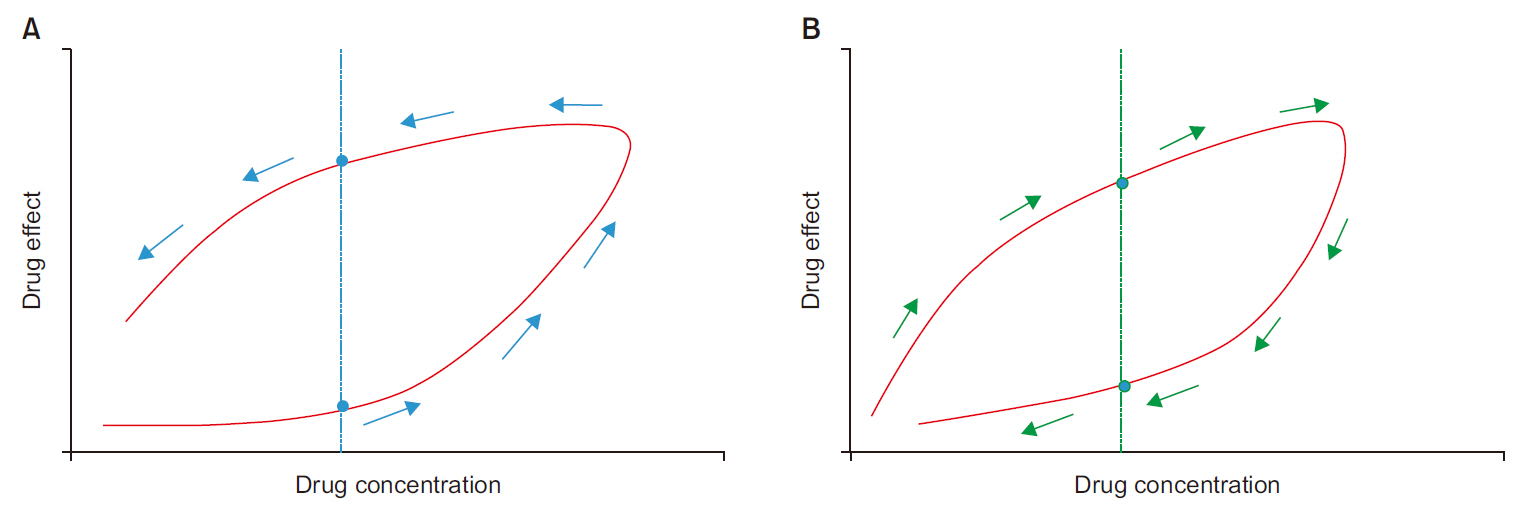
Fig. 5 Concentration-effect curve with hysteresis loop. (A) Counter-clockwise hysteresis between plasma drug concentration and observed drug effect. (B) Clockwise hysteresis between plasma drug concentration and observed drug effect.
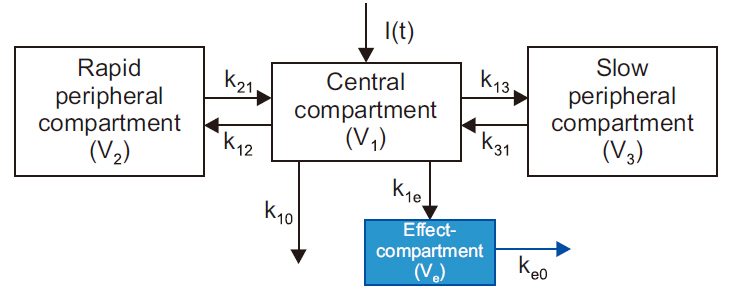
Fig. 6 Three-compartment model with an effect-compartment. The effect compartment links to the central compartment of a threecompartment model by the first-order process. I(t): drug dose (input), Vi: distribution volume of compartment i, kij: intercompartmental fractional rate constant (micro-rate constant from compartment i to compartment j).
Reference
-
Riviere JE., Gabrielsson J., Fink M., Mochel J. 2016. Mathematical modeling and simulation in animal health. Part I: moving beyond pharmacokinetics. J Vet Pharmacol Ther. 39:213–23. DOI: 10.1111/jvp.12278. PMID: 26592724.Gabrielsson J., Weiner D. 2016. Pharmacokinetic and pharmacodynamic data analysis: concepts and applications. . 5th ed. Apotekarsocieteten;Stockholm:Derendorf H., Meibohm B. 1999. Modeling of pharmacokinetic/pharmacodynamic (PK/PD) relationships: concepts and perspectives. Pharm Res. 16:176–85. DOI: 10.1023/A:1011907920641. PMID: 10100300.Holford NH., Sheiner LB. 1981. Understanding the dose-effect relationship: clinical application of pharmacokinetic-pharmacodynamic models. Clin Pharmacokinet. 6:429–53. DOI: 10.2165/00003088-198106060-00002. PMID: 7032803.Meibohm B., Derendorf H. 1997. Basic concepts of pharmacokinetic/pharmacodynamic (PK/PD) modelling. Int J Clin Pharmacol Ther. 35:401–13. PMID: 9352388.Louizos C., Yáñez JA., Forrest ML., Davies NM. 2014. Understanding the hysteresis loop conundrum in pharmacokinetic/pharmacodynamic relationships. J Pharm Pharm Sci. 17:34–91. DOI: 10.18433/J3GP53. PMID: 24735761. PMCID: PMC4332569.Gabrielsson J., Weiner D. Gabrielsson J, Weiner D, editors. 2016. Pharmacodynamic concepts. Pharmacokinetic and Pharmacodynamic Data Analysis: Concepts and Applications. 5th ed. Apotekarsocieteten;Stockholm: p. 199–332.Gabrielsson J., Weiner D. Gabrielsson J, Weiner D, editors. 2016. Pharmacokinetic concepts: multi-compartment model. Pharmacokinetic and Pharmacodynamic Data Analysis: Concepts and Applications. 5th ed. Apotekarsocieteten;Stockholm: p. 57–72.Han DW. 2014. Pharmacokinetic and pharmacodynamic modeling in anesthetic field. Anesth Pain Med. 9:77–86.Hill AV. 1910. The possible effects of the aggregation of the molecules of haemoglobin on its dissociation curves. J Physiol. 40:4–7.Crommelin DJA., Sindelar RD., Meibohm B. 2019. Pharmaceutical biotechnology: fundamentals and applications. . 5th ed. Springer;Cham: DOI: 10.1007/978-3-030-00710-2.Sheiner LB., Stanski DR., Vozeh S., Miller RD., Ham J. 1979. Simultaneous modeling of pharmacokinetics and pharmacodynamics: application to d-tubocurarine. Clin Pharmacol Ther. 25:358–71. DOI: 10.1002/cpt1979253358. PMID: 761446.Holford NH., Sheiner LB. 1981. Pharmacokinetic and pharmacodynamic modeling in vivo. Crit Rev Bioeng. 5:273–322. PMID: 7023829.Segre G. 1968. Kinetics of interaction between drugs and biological systems. Farmaco Sci. 23:907–18. PMID: 5712792.Kowalski KG., Karim A. 1995. A semicompartmental modeling approach for pharmacodynamic data assessment. J Pharmacokinet Biopharm. 23:307–22. DOI: 10.1007/BF02354287. PMID: 8834198.Choi BM., Koh EH., Kim MG., Kim SH., Ok SY., Noh GJ. 2013. Temporal linear mode complexity as a surrogate measure of the anesthetic drug effects during sevoflurane anesthesia. Korean J Anesthesiol. 65:385–96. DOI: 10.4097/kjae.2013.65.5.385. PMID: 24363840. PMCID: PMC3866333.Bruhn J., Röpcke H., Hoeft A. 2000. Approximate entropy as an electroencephalographic measure of anesthetic drug effect during desflurane anesthesia. Anesthesiology. 92:715–26. DOI: 10.1097/00000542-200003000-00016. PMID: 10719951.
- Full Text Links
-
- Actions
-
Cited
- CITED
-
- Close
- Share
-
- Similar articles
-
- Population Pharmacokinetic and Pharmacodynamic Models of Propofol in Healthy Volunteers using NONMEM and Machine Learning Methods
- Neuromuscular blockade and pharmacokinetic-pharmacodynamic modeling
- Physiological spaces and multicompartmental pharmacokinetic models
- Obesity and anesthetic pharmacology: simulation of target-controlled infusion models of propofol and remifentanil
- Clinical application of intravenous anesthetic infusion with use of a pharmacokinetic-pharmacodynamic model in children
