Understanding the pharmacokinetics of prodrug and metabolite
- Affiliations
-
- 1Molecular Diagnostics and Imaging Center, School of Medicine, Kyungpook National University; Clinical Trial Center, Kyungpook National University Hospital, Daegu 41944, Korea. chosi1@gmail.com yry@knu.ac.kr
- KMID: 2420300
- DOI: http://doi.org/0.12793/tcp.2018.26.1.1
Abstract
- This tutorial explains the pharmacokinetics of a prodrug and its active metabolite (or parent drug) using a two-step, consecutive, first-order irreversible reaction as a basic model for prodrug metabolism. In this model, the prodrug is metabolized and produces the parent drug, which is subsequently eliminated. The mathematical expressions for pharmacokinetic parameters were derived step by step. In addition, we visualized these expressions to help understand the relationship between pharmacokinetic parameters easily. For the elimination rate-limited and formation rate-limited metabolism, we analyzed the plasma drug concentration versus time curve of a prodrug administered intravenously.
Figure
-
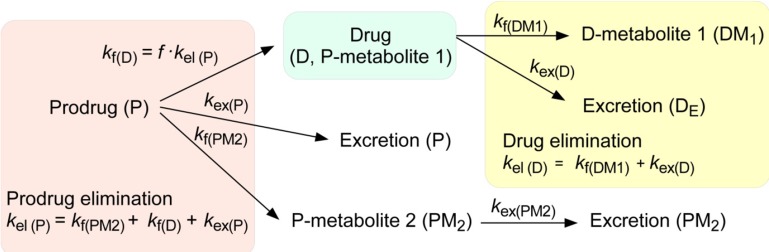
Figure 1 A model to describe the kinetics of a prodrug and its metabolites. The prodrug (P) is metabolized or excreted unchanged according to the elimination rate constant (kel(P)). The drug (D) is eliminated according to the elimination rate constant (kel(D)). See text for details.
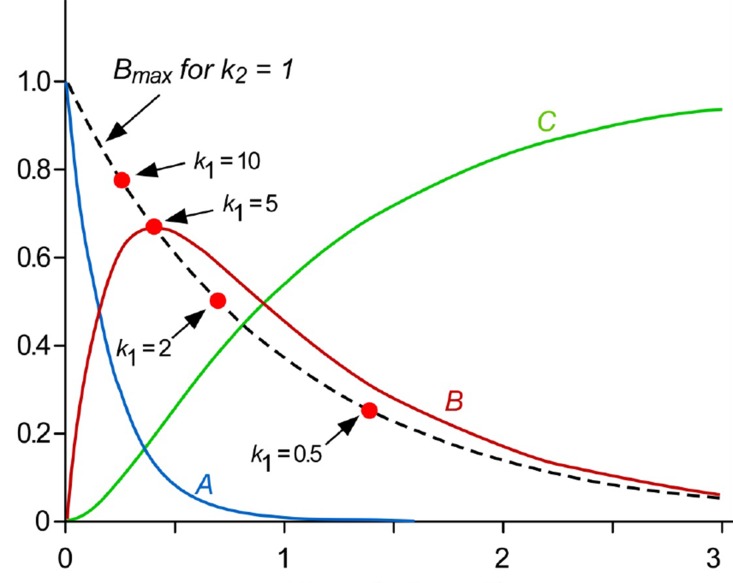
Figure 2 Amount-time profile for a two-step irreversible consecutive first-order reaction: A→k1B→k2C. The abscissa and ordinate represent time and amount of each species, respectively, in arbitrary units. The case illustrated was simulated using Microsoft Excel for k1 = 5, k2 = 1, and A0 = 1. The Bmax curve (dashed line) was obtained using Eqns. (11), (13), and (14) for k2 = 1. The dots represent Bmax for given values of k1. See text for details.
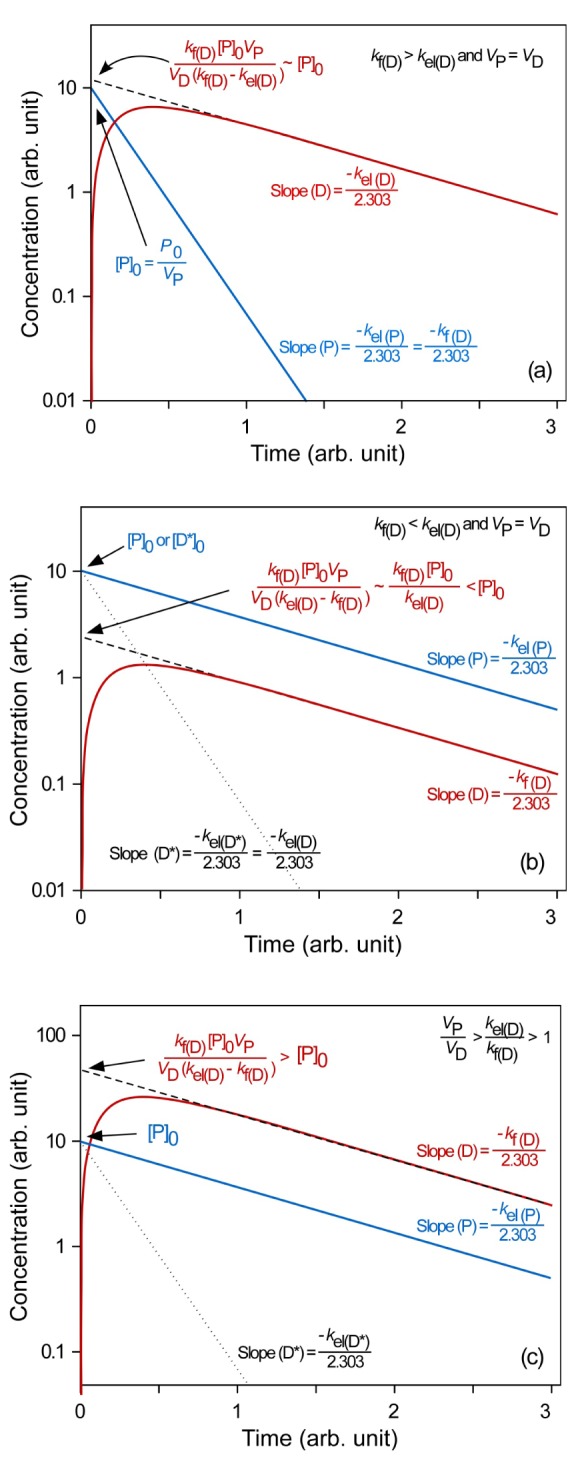
Figure 3 Semi-logarithmic concentration-time profile of a prodrug (P; blue line) and its formed metabolite (parent drug, D; red line). Simulations were performed using Microsoft Excel for three cases: (a) ERL metabolism where kf(D) > kel(D): kf(D) = 5, kel(D) = 1, and VD = VP = 1, (b) FRL metabolism where kf(D) < kel(D): kf(D) = 1, kel(D) = 5, and VD = VP = 1, and (c) FRL metabolism for VP/VD > kel(D)/kf(D) > 1: kf(D) = 1, kel(D) = 5, and VD = 0.05. VP = 1, and A0 = 10. Back extrapolation (dashed line; plotted using Eq. (19) or (21)) of the elimination phase slope (red line) provides an estimate of [D]0. The dotted line was plotted using Eq. (23) for the direct intravenous administration of a preformed (or synthesized) parent drug (D*) with the initial amount of D* (D*0) = 10 in (b) and 0.5 in (c). See text for details.
Reference
-
1. Rautio J, Kumpulainen H, Heimbach T, Oliyai R, Oh D, Järvinen T, et al. Prodrugs: design and clinical applications. Nat Rev Drug Discov. 2008; 7:255–270. PMID: 18219308.
Article2. Zawilska JB, Wojcieszak J, Olejniczak AB. Prodrugs: a challenge for the drug development. Pharmacol Rep. 2013; 65:1–14. PMID: 23563019.
Article3. Obach RS. Pharmacologically active drug metabolites: impact on drug discovery and pharmacotherapy. Pharmacol Rev. 2013; 65:578–640. DOI: 10.1124/pr.111.005439. PMID: 23406671.
Article4. Cummings AJ, Martin BK. Excretion and the accrual of drug metabolites. Nature. 1963; 200:1296–1297. PMID: 14098474.
Article5. Martin BK. Kinetic considerations relating to the use of drug precursors. Br J Pharmacol Chemother. 1967; 31:420–434. PMID: 6083115.
Article6. Houston JB. Drug metabolite kinetics. Pharmacol Ther. 1982; 15:521–552.
Article7. Houston JB, Taylor G. Drug metabolite concentration-time profiles: influence of route of drug administration. Br J Clin Pharmacol. 1984; 17:385–394. PMID: 6721984.
Article8. Pang KS. A review of metabolite kinetics. J Pharmacokinet Biopharm. 1985; 13:633–662. PMID: 3914545.
Article9. Smith PC. Pharmacokinetics of drug metabolites. In : Pearson PG, Wienkers LC, editors. Handbook of drug metabolism. 2nd ed. New York: Informa Healthcare;2009. p. 17–59.10. de Campos ML, Padilha EC, Peccinini RG. A review of pharmacokinetic parameters of metabolites and prodrugs. Drug Metab Lett. 2014; 7:105–116. PMID: 24628402.
Article11. Yang QJ, Pang KS. PBPK modeling to estimate metabolite formation from first-pass organs: intestine and liver. In : Chackalamannil S, Rotella D, Ward S, editors. Comprehensive medicinal chemistry III. Volume 4. Oxford: Elsevier;2017. p. 83–101.12. Sun H, Pang KS. Disparity in intestine disposition between formed and preformed metabolites and implications: a theoretical study. Drug Metab Dispos. 2009; 37:187–202. DOI: 10.1124/dmd.108.022483. PMID: 18948379.
Article13. Rowland M, Tozer TN. Clinical pharmacokinetics and pharmacodynamics: concepts and applications. 4th ed. Philadelphia: Wolters Kluwer Health/Lippincott William & Wilkins;2011. p. 603–632.14. Atkinson AJ, Huang SM, Lertora JJL, Markey SP, editors. Principles of Clinical Pharmacology. 3rd ed. Amsterdam: Academic Press;2012. p. 41–55.15. Gershkovich P, Wasan KM, Sivak O, Lysakowski S, Reid C, Premalatha K, et al. Simultaneous determination of a novel antitrypanosomal compound (OSU-36) and its ester derivative (OSU-40) in plasma by HPLC: application to first pharmacokinetic study in rats. J Pharm Pharm Sci. 2011; 14:36–45. PMID: 21501551.
Article16. Quevedo MA, Briñón MC. In vitro and in vivo pharmacokinetic characterization of two novel prodrugs of zidovudine. Antiviral Res. 2009; 83:103–111. DOI: 10.1016/j.antiviral.2009.03.010. PMID: 19549583.
Article
- Full Text Links
-
- Actions
-
Cited
- CITED
-
- Close
- Share
-
- Similar articles
-
- Bioavailability of the amino acid-attached prodrug as a new anti-HIV agent in rats
- Pharmacokinetics and pharmacodynamics of drugs for sedation
- Role of the ABCB1 Drug Transporter Polymorphisms in the Pharmacokinetics of Oseltamivir in Humans: a Preliminary Report
- Understanding the pharmacokinetics of reversible metabolism
- Current Updates in Pharmacokinetics and Pharmacodynamics of Fluoroquinolones
