Comparative Study of Ultrasonography, Computed Tomography, Magnetic Resonance Imaging, and Magnetic Resonance Spectroscopy for the Diagnosis of Fatty Liver in a Rat Model
- Affiliations
-
- 1Department of Radiology, Chonnam National University Hwasun Hospital, Hwasun, Korea. hkkang@jnu.ac.kr
- 2Department of Radiology, Chonnam National University Hospital, Gwangju, Korea.
- 3Department of Anatomy, Chonnam National University Medical School, Gwangju, Korea.
- KMID: 2365047
- DOI: http://doi.org/10.3348/jksr.2017.76.1.14
Abstract
- PURPOSE
To compare the accuracy of ultrasonography (US), single-energy CT (SECT), dual-energy CT (DECT), MR imaging (MRI), and MR spectroscopy (MRS) for detecting fatty liver in a rat model.
MATERIALS AND METHODS
Fatty liver was induced by 60% high-fat diet for 1, 2, 3, 4, or 5 weeks (3 rats per group, a total of 15 rats). The control group comprised of five rats fed 10% high-fat diet. US, SECT, DECT, MRI, and MRS of the liver were performed weekly. Histologic steatosis grade and intrahepatocelluar triglyceride level were determined histologically for the livers of sacrificed rats. Pearson correlation test was used to assess the correlation between examinations and standard reference levels. Receiver operating characteristic curves were constructed. Area under the curve (AUC), sensitivity, and specificity were calculated.
RESULTS
US, SECT, DECT, MRI, and MRS were significantly correlated with histologic steatosis grade. The diagnostic performance of AUC, sensitivity, and specificity were 0.893, 80%, and 80% for US, 0.960, 80%, and 80% for SECT, 0.947, 100%, and 60% for DECT, 0.933, 93.3%, and 100% for MRI, and 0.960, 93.3%, and 100% for MRS.
CONCLUSION
MRS showed the strongest correlation with histologic steatosis grade with the highest sensitivity and specificity for diagnosis of fatty liver compared to other modalities.
MeSH Terms
Figure
-

Fig. 1 Scatterplots and regression lines showing correlations between histopathologic results (percentage steatosis) or intra-hepatocellular TG with the degree of fatty liver at US (A), SECT (B), DECT (C), MRI (D), and MRS (E). DECT = dual-energy computed tomography, HUD = the difference between Hounsfield units of 140 kVp and 80 kVp, HUS = difference in Hounsfield units between the liver and spleen, MRI = magnetic resonance imaging, MRS = magnetic resonance spectroscopy, SECT = single-energy computed tomography, US = ultrasonography
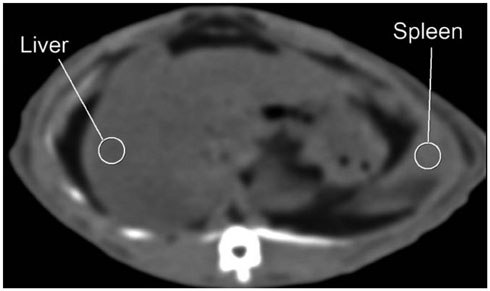
Fig. 2 Transverse single energy computed tomographic image at 120 kVp of a rat showing the gate of the liver and the mean position of the region of interest at liver and spleen.

Fig. 3 Typical histologic slides of liver section from 60% high-fat diet of the rats for three weeks with approximately 30% steatosis. The fat content of the drop-shaped observation showed no signs of inflammation or fibrosis findings (hematoxylin-eosin stain, × 400).
Reference
-
1. Krawczyk M, Bonfrate L, Portincasa P. Nonalcoholic fatty liver disease. Best Pract Res Clin Gastroenterol. 2010; 24:695–708.2. Chitturi S, Farrell GC, George J. Non-alcoholic steatohepatitis in the Asia-Pacific region: future shock? J Gastroenterol Hepatol. 2004; 19:368–374.3. Farrell GC. Non-alcoholic steatohepatitis: what is it, and why is it important in the Asia-Pacific region? J Gastroenterol Hepatol. 2003; 18:124–138.4. Starley BQ, Calcagno CJ, Harrison SA. Nonalcoholic fatty liver disease and hepatocellular carcinoma: a weighty connection. Hepatology. 2010; 51:1820–1832.5. Hsu CS, Kao JH. Non-alcoholic fatty liver disease: an emerging liver disease in Taiwan. J Formos Med Assoc. 2012; 111:527–535.6. Marcos A. Right lobe living donor liver transplantation: a review. Liver Transpl. 2000; 6:3–20.7. Piccinino F, Sagnelli E, Pasquale G, Giusti G. Complications following percutaneous liver biopsy. A multicentre retrospective study on 68,276 biopsies. J Hepatol. 1986; 2:165–173.8. Ratziu V, Charlotte F, Heurtier A, Gombert S, Giral P, Bruckert E, et al. Sampling variability of liver biopsy in nonalcoholic fatty liver disease. Gastroenterology. 2005; 128:1898–1906.9. Schwenzer NF, Springer F, Schraml C, Stefan N, Machann J, Schick F. Non-invasive assessment and quantification of liver steatosis by ultrasound, computed tomography and magnetic resonance. J Hepatol. 2009; 51:433–445.10. Bohte AE, van Werven JR, Bipat S, Stoker J. The diagnostic accuracy of US, CT, MRI and 1H-MRS for the evaluation of hepatic steatosis compared with liver biopsy: a meta-analysis. Eur Radiol. 2011; 21:87–97.11. Pickhardt PJ, Park SH, Hahn L, Lee SG, Bae KT, Yu ES. Specificity of unenhanced CT for non-invasive diagnosis of hepatic steatosis: implications for the investigation of the natural history of incidental steatosis. Eur Radiol. 2012; 22:1075–1082.12. Bohte AE, Koot BG, van der Baan-Slootweg OH, van Werven JR, Bipat S, Nederveen AJ, et al. US cannot be used to predict the presence or severity of hepatic steatosis in severely obese adolescents. Radiology. 2012; 262:327–334.13. Artz NS, Hines CD, Brunner ST, Agni RM, Kühn JP, Roldan-Alzate A, et al. Quantification of hepatic steatosis with dual-energy computed tomography: comparison with tissue reference standards and quantitative magnetic resonance imaging in the ob/ob mouse. Invest Radiol. 2012; 47:603–610.14. Wang B, Gao Z, Zou Q, Li L. Quantitative diagnosis of fatty liver with dual-energy CT. An experimental study in rabbits. Acta Radiol. 2003; 44:92–97.15. van Werven JR, Marsman HA, Nederveen AJ, ten Kate FJ, van Gulik TM, Stoker J. Hepatic lipid composition analysis using 3.0-T MR spectroscopy in a steatotic rat model. Magn Reson Imaging. 2012; 30:112–121.16. Wu CH, Ho MC, Jeng YM, Hsu CY, Liang PC, Hu RH, et al. Quantification of hepatic steatosis: a comparison of the accuracy among multiple magnetic resonance techniques. J Gastroenterol Hepatol. 2014; 29:807–813.17. Webb M, Yeshua H, Zelber-Sagi S, Santo E, Brazowski E, Halpern Z, et al. Diagnostic value of a computerized hepatorenal index for sonographic quantification of liver steatosis. AJR Am J Roentgenol. 2009; 192:909–914.18. van Werven JR, Marsman HA, Nederveen AJ, Smits NJ, ten Kate FJ, van Gulik TM, et al. Assessment of hepatic steatosis in patients undergoing liver resection: comparison of US, CT, T1-weighted dual-echo MR imaging, and point-resolved 1H MR spectroscopy. Radiology. 2010; 256:159–168.19. Szczepaniak LS, Nurenberg P, Leonard D, Browning JD, Reingold JS, Grundy S, et al. Magnetic resonance spectroscopy to measure hepatic triglyceride content: prevalence of hepatic steatosis in the general population. Am J Physiol Endocrinol Metab. 2005; 288:E462–E468.20. Pineda N, Sharma P, Xu Q, Hu X, Vos M, Martin DR. Measurement of hepatic lipid: high-speed T2-corrected multi-echo acquisition at 1H MR spectroscopy--a rapid and accurate technique. Radiology. 2009; 252:568–576.21. Patel BN, Kumbla RA, Berland LL, Fineberg NS, Morgan DE. Material density hepatic steatosis quantification on intravenous contrast-enhanced rapid kilovolt (peak)-switching single-source dual-energy computed tomography. J Comput Assist Tomogr. 2013; 37:904–910.22. Park SH, Kim PN, Kim KW, Lee SW, Yoon SE, Park SW, et al. Macrovesicular hepatic steatosis in living liver donors: use of CT for quantitative and qualitative assessment. Radiology. 2006; 239:105–112.23. Martín-Rodríguez JL, Arrebola JP, Jiménez-Moleón JJ, Olea N, González-Calvin JL. Sonographic quantification of a hepato-renal index for the assessment of hepatic steatosis in comparison with 3T proton magnetic resonance spectroscopy. Eur J Gastroenterol Hepatol. 2014; 26:88–94.24. Mancini M, Prinster A, Annuzzi G, Liuzzi R, Giacco R, Medagli C, et al. Sonographic hepatic-renal ratio as indicator of hepatic steatosis: comparison with (1)H magnetic resonance spectroscopy. Metabolism. 2009; 58:1724–1730.25. Lee SW, Park SH, Kim KW, Choi EK, Shin YM, Kim PN, et al. Unenhanced CT for assessment of macrovesicular hepatic steatosis in living liver donors: comparison of visual grading with liver attenuation index. Radiology. 2007; 244:479–485.26. Lee SS, Park SH, Kim HJ, Kim SY, Kim MY, Kim DY, et al. Non-invasive assessment of hepatic steatosis: prospective comparison of the accuracy of imaging examinations. J Hepatol. 2010; 52:579–585.27. Lee SS, Lee Y, Kim N, Kim SW, Byun JH, Park SH, et al. Hepatic fat quantification using chemical shift MR imaging and MR spectroscopy in the presence of hepatic iron deposition: validation in phantoms and in patients with chronic liver disease. J Magn Reson Imaging. 2011; 33:1390–1398.28. Hines CD, Yu H, Shimakawa A, McKenzie CA, Warner TF, Brittain JH, et al. Quantification of hepatic steatosis with 3-T MR imaging: validation in ob/ob mice. Radiology. 2010; 254:119–128.29. Cowin GJ, Jonsson JR, Bauer JD, Ash S, Ali A, Osland EJ, et al. Magnetic resonance imaging and spectroscopy for monitoring liver steatosis. J Magn Reson Imaging. 2008; 28:937–945.30. Qayyum A, Chen DM, Breiman RS, Westphalen AC, Yeh BM, Jones KD, et al. Evaluation of diffuse liver steatosis by ultrasound, computed tomography, and magnetic resonance imaging: which modality is best? Clin Imaging. 2009; 33:110–115.31. Yoshimitsu K, Kuroda Y, Nakamuta M, Taketomi A, Irie H, Tajima T, et al. Noninvasive estimation of hepatic steatosis using plain CT vs. chemical-shift MR imaging: significance for living donors. J Magn Reson Imaging. 2008; 28:678–684.32. Fishbein M, Castro F, Cheruku S, Jain S, Webb B, Gleason T, et al. Hepatic MRI for fat quantitation: its relationship to fat morphology, diagnosis, and ultrasound. J Clin Gastroenterol. 2005; 39:619–625.33. Korkusuz H, Keese D, Raschidi BA, Hübner F, Namgaladze D, Hintereder G, et al. Detection of a fatty liver after binge drinking: correlation of MR-spectroscopy, DECT, biochemistry and histology in a rat model. Acad Radiol. 2011; 18:1349–1357.34. Kodama Y, Ng CS, Wu TT, Ayers GD, Curley SA, Abdalla EK, et al. Comparison of CT methods for determining the fat content of the liver. AJR Am J Roentgenol. 2007; 188:1307–1312.35. Kleiner DE, Brunt EM, Van Natta M, Behling C, Contos MJ, Cummings OW, et al. Design and validation of a histological scoring system for nonalcoholic fatty liver disease. Hepatology. 2005; 41:1313–1321.36. Strauss S, Gavish E, Gottlieb P, Katsnelson L. Interobserver and intraobserver variability in the sonographic assessment of fatty liver. AJR Am J Roentgenol. 2007; 189:W320–W323.37. Dasarathy S, Dasarathy J, Khiyami A, Joseph R, Lopez R, McCullough AJ. Validity of real time ultrasound in the diagnosis of hepatic steatosis: a prospective study. J Hepatol. 2009; 51:1061–1067.38. Hamer OW, Aguirre DA, Casola G, Lavine JE, Woenckhaus M, Sirlin CB. Fatty liver: imaging patterns and pitfalls. Radiographics. 2006; 26:1637–1653.39. Mendler MH, Bouillet P, Le Sidaner A, Lavoine E, Labrousse F, Sautereau D, et al. Dual-energy CT in the diagnosis and quantification of fatty liver: limited clinical value in comparison to ultrasound scan and single-energy CT, with special reference to iron overload. J Hepatol. 1998; 28:785–794.40. Lee SS, Park SH. Radiologic evaluation of nonalcoholic fatty liver disease. World J Gastroenterol. 2014; 20:7392–7402.
- Full Text Links
-
- Actions
-
Cited
- CITED
-
- Close
- Share
-
- Similar articles
-
- Imaging evaluation of non-alcoholic fatty liver disease: focused on quantification
- Radiologic Evaluation of Non-Alcoholic Fatty Liver Disease in Diabetic Patient
- A study on the comparision of various imaging methods for the staging of renal cell carcinoma
- Magnetic Resonance Elastography and Other Magnetic Resonance Imaging Techniques in Chronic Liver Disease: Current Status and Future Directions
- Focal Fatty Sparing of the Liver
