Intratumoral Heterogeneity of Breast Cancer Xenograft Models: Texture Analysis of Diffusion-Weighted MR Imaging
- Affiliations
-
- 1Department of Radiology, Seoul National University Hospital, Seoul National University College of Medicine, Seoul 110-744, Korea. river7774@gmail.com
- 2Department of Radiology, Seoul National University Bundang Hospital, Seongnam 463-707, Korea.
- 3Department of Pathology, Seoul National University Bundang Hospital, Seongnam 463-707, Korea.
- 4Department of Computer Science and Engineering, Seoul National University, Seoul 151-744, Korea.
- KMID: 1734944
- DOI: http://doi.org/10.3348/kjr.2014.15.5.591
Abstract
OBJECTIVE
To investigate whether there is a relationship between texture analysis parameters of apparent diffusion coefficient (ADC) maps and histopathologic features of MCF-7 and MDA-MB-231 xenograft models.
MATERIALS AND METHODS
MCF-7 estradiol (+), MCF-7 estradiol (-), and MDA-MB-231 xenograft models were made with approval of the animal care committee. Twelve tumors of MCF-7 estradiol (+), 9 tumors of MCF-7 estradiol (-), and 6 tumors in MDA-MB-231 were included. Diffusion-weighted MR images were obtained on a 9.4-T system. An analysis of the first and second order texture analysis of ADC maps was performed. The texture analysis parameters and histopathologic features were compared among these groups by the analysis of variance test. Correlations between texture parameters and histopathologic features were analyzed. We also evaluated the intraobserver agreement in assessing the texture parameters.
RESULTS
MCF-7 estradiol (+) showed a higher standard deviation, maximum, skewness, and kurtosis of ADC values than MCF-7 estradiol (-) and MDA-MB-231 (p < 0.01 for all). The contrast of the MCF-7 groups was higher than that of the MDA-MB-231 (p = 0.004). The correlation (COR) of the texture analysis of MCF-7 groups was lower than that of MDA-MB-231 (p < 0.001). The histopathologic analysis showed that Ki-67mean and Ki-67diff of MCF-7 estradiol (+) were higher than that of MCF-7 estradiol (-) or MDA-MB-231 (p < 0.05). The microvessel density (MVD)mean and MVDdiff of MDA-MB-231 were higher than those of MCF-7 groups (p < 0.001). A diffuse-multifocal necrosis was more frequently found in MDA-MB-231 (p < 0.001). The proportion of necrosis moderately correlated with the contrast (r = -0.438, p = 0.022) and strongly with COR (r = 0.540, p = 0.004). Standard deviation (r = 0.622, r = 0.437), skewness (r = 0.404, r = 0.484), and kurtosis (r = 0.408, r = 0.452) correlated with Ki-67mean and Ki-67diff (p < 0.05 for all). COR moderately correlated with Ki-67diff (r = -0.388, p = 0.045). Skewness (r = -0.643, r = -0.464), kurtosis (r = -0.581, r = -0.389), contrast (r = -0.473, r = -0.549) and COR (r = 0.588, r = 0.580) correlated with MVDmean and MVDdiff (p < 0.05 for all).
CONCLUSION
The texture analysis of ADC maps may help to determine the intratumoral spatial heterogeneity of necrosis patterns, amount of cellular proliferation and the vascularity in MCF-7 and MDA-MB-231 xenograft breast cancer models.
Keyword
MeSH Terms
-
Animals
Breast Neoplasms/metabolism/pathology/*radiography
Cell Line, Tumor
*Diffusion Magnetic Resonance Imaging
Estradiol/metabolism
Female
Humans
Image Interpretation, Computer-Assisted
Immunohistochemistry
Ki-67 Antigen/metabolism
MCF-7 Cells
Mice
Mice, Nude
Transplantation, Heterologous
Estradiol
Ki-67 Antigen
Figure
-
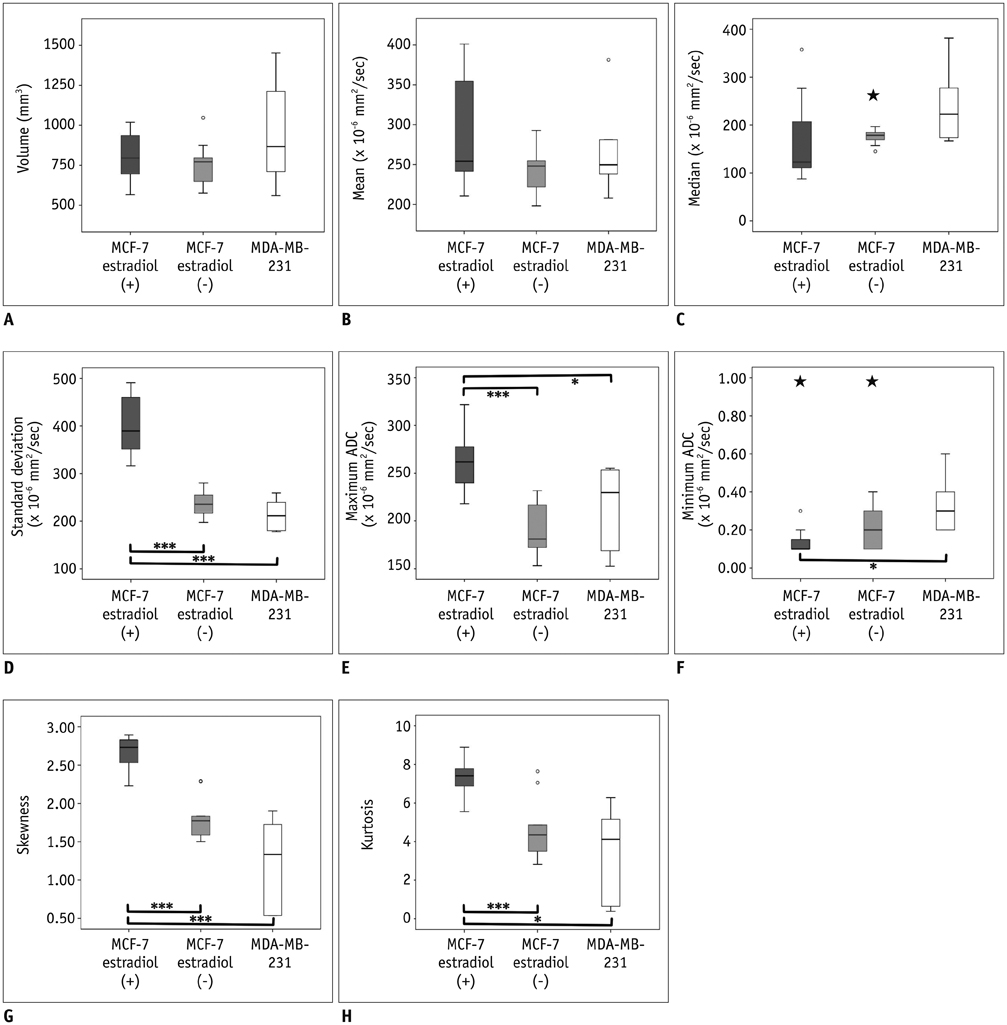
Fig. 1 Box-and-whisker plot of volumes and first order texture analysis parameters of tumor groups. (A) Volume, (B) mean, (C) median, (D) standard deviation, (E) maximum, (F) minimum, (G) skewness, and (H) kurtosis of ADC maps for MCF-7 estradiol (+) (dark grey boxes), MCF-7 estradiol (-) (light grey boxes) and MDA-MB-231 (white boxes) groups. *Statistical significance with p < 0.05, **Statistical significance with p < 0.01, ***Statistical significance with p < 0.001. ○: observations 1.5 interquartile ranges (IQRs) from end of box, ★: observations 3 IQRs from end of box. ADC = apparent diffusion coefficient
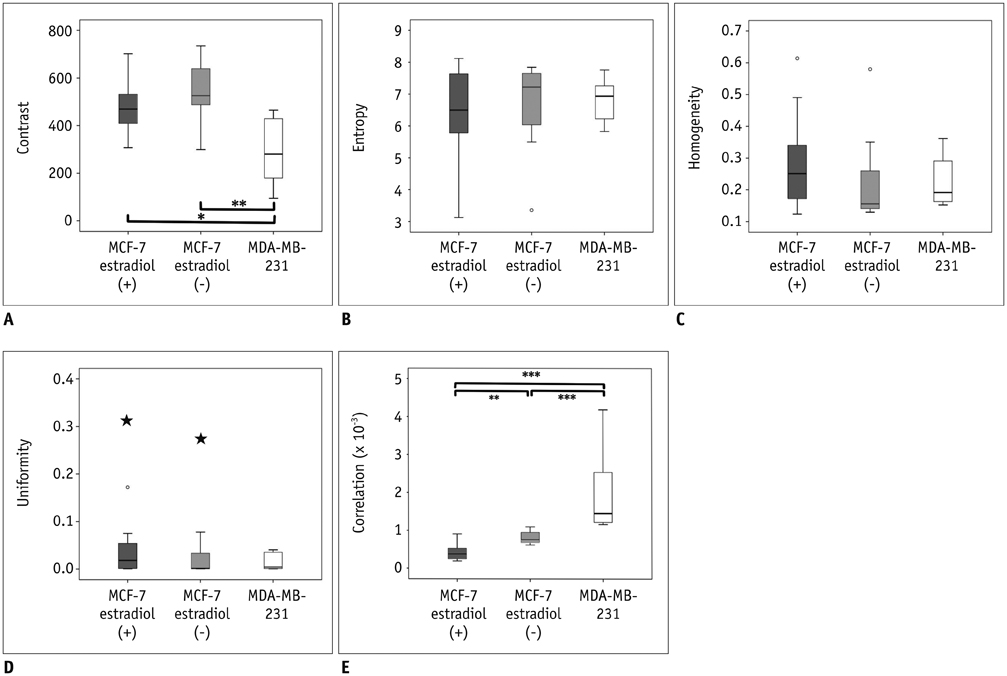
Fig. 2 Box-and-whisker plot of second order texture analysis parameters of tumor groups. (A) Contrast, (B) entropy, (C) homogeneity, (D) uniformity, and (E) correlation of ADC maps are shown for MCF-7 estradiol (+) (dark grey boxes), MCF-7 estradiol (-) (light grey boxes), and MDA-MB-231 (white boxes) groups. *Statistical significance with p < 0.05, **Statistical significance with p < 0.01, ***Statistical significance with p < 0.001. ○: observations 1.5 interquartile ranges (IQRs) from end of box, ★: observations 3 IQRs from end of box. ADC = apparent diffusion coefficient
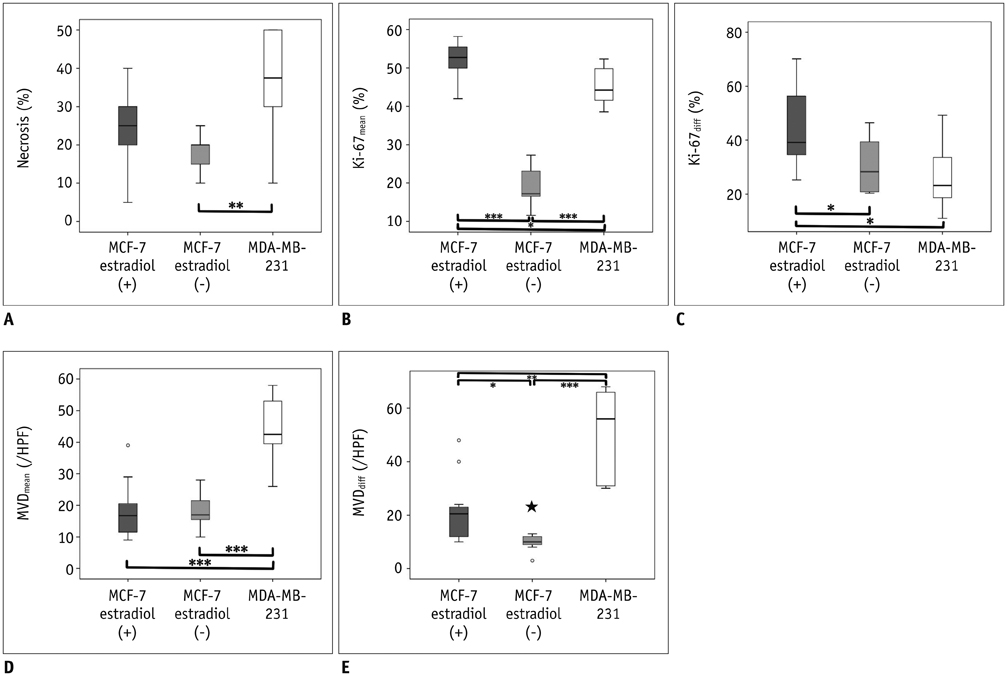
Fig. 3 Box-and-whisker plot of histopathologic features of tumor groups. (A) Proportion of necrosis, (B) Ki-67mean, (C) Ki-67diff (highest-lowest), (D) MVDmean, and (E) MVDdiff (highest-lowest) for MCF-7 estradiol (+) (dark grey boxes), MCF-7 estradiol (-) (light grey boxes), and MDA-MB-231 (white boxes) groups are shown. *Statistical significance with p < 0.05, **Statistical significance with p < 0.01, ***Statistical significance with p < 0.001. ○: observations 1.5 interquartile ranges (IQRs) from end of box, ★: observations 3 IQRs from end of box. HPF = high power field, MVD = microvessel density
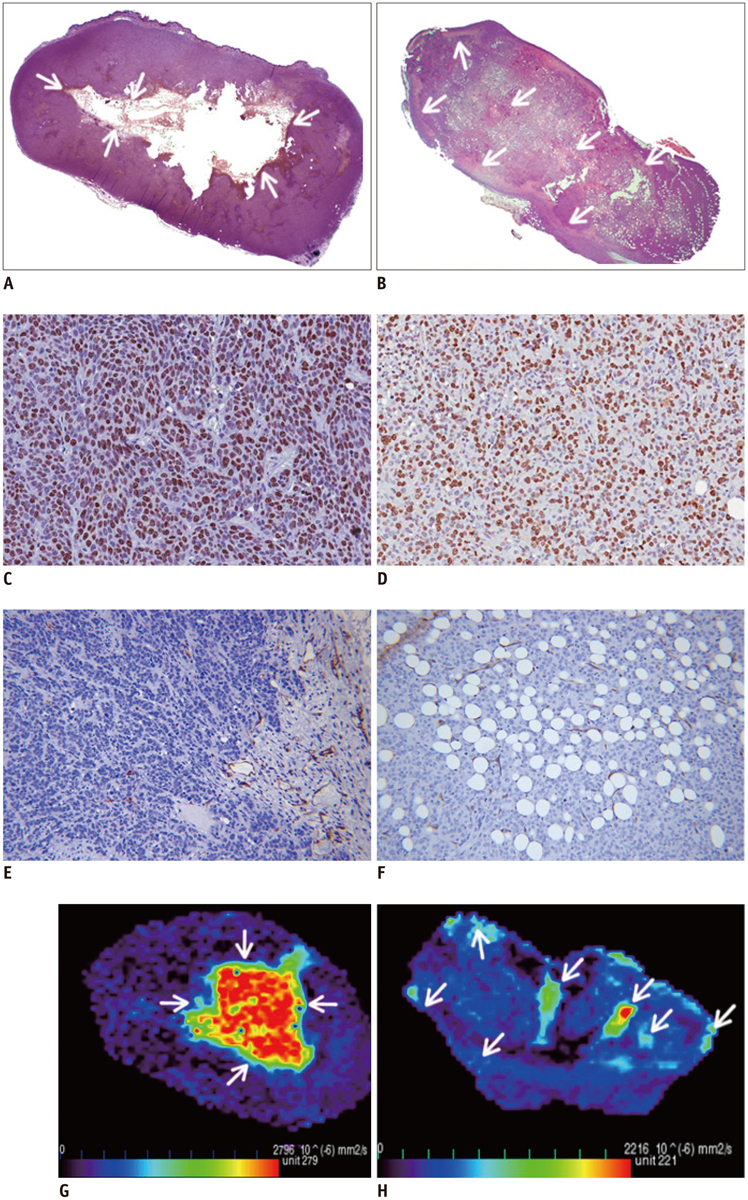
Fig. 4 Relationship between ADC maps and histopathological results. Photomicrographs of entire section show (A) central necrosis (arrows) in MCF-7 estradiol (+) tumor and (B) diffuse multifocal necrosis (arrows) in MDA-MB-231 tumor (H&E, × 1.25). Photomicrographs of immunohistochemical staining show high Ki-67 expression in MCF-7 estradiol (+) tumors (C) and MDA-MB-231 tumors (× 200) (D). Photomicrographs of immunohistochemical staining for CD34 show low microvessel density in MCF-7 estradiol (+) tumors (E) and high microvessel density in MDA-MB-231 tumors (× 200) (F). ADC map (G) shows high ADC values in central necrotic portion (arrows) and (H) spotty high ADC values (arrows) corresponding to necrosis. ADC = apparent diffusion coefficient, H&E = hematoxylin and eosin

Fig. 5 Relationship between texture parameters and Ki-67 index of tumor groups. (A) Ki-67mean and (B) Ki-67diff showed positive correlation with standard deviation, skewness and kurtosis of ADC texture parameters. However, COR of ADC map showed inverse correlation with Ki-67diff. ADC = apparent diffusion coefficient, COR = correlation
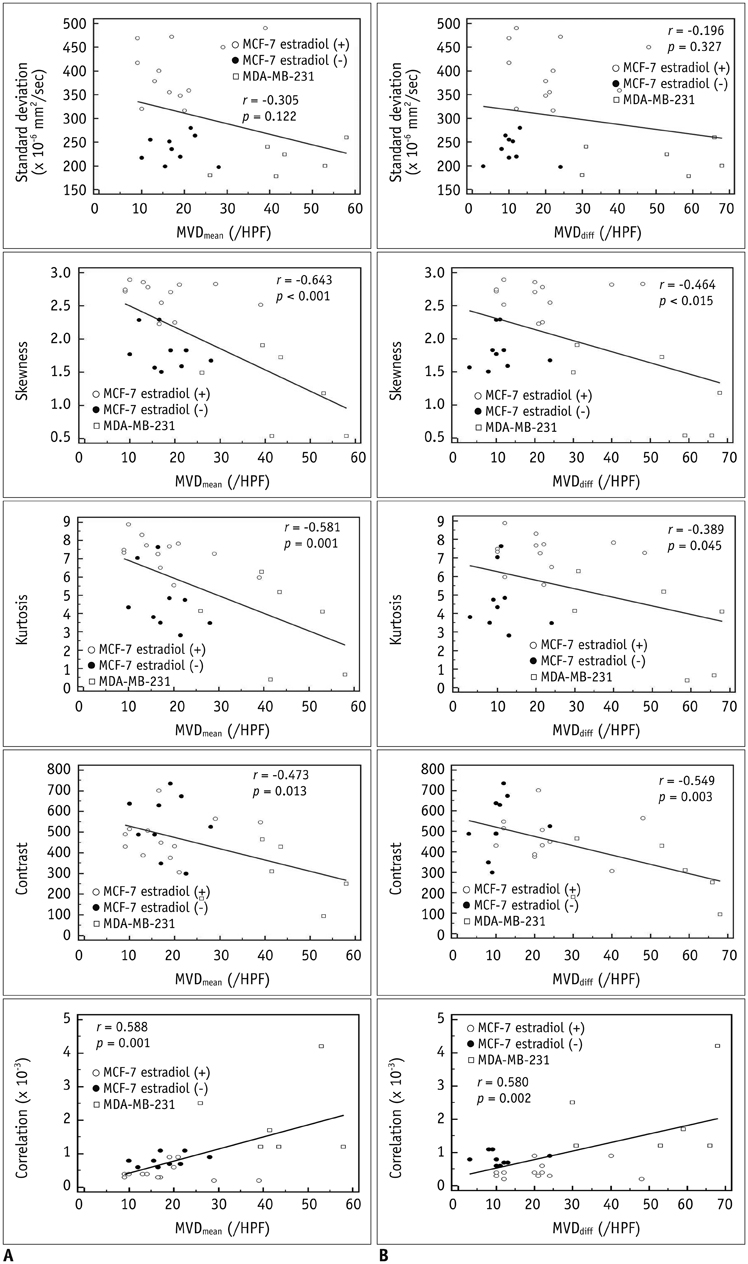
Fig. 6 Relationship between texture parameters and MVD of tumor groups. (A) MVDmean and (B) MVDdiff showed inverse correlation with skewness, kurtosis and contrast. COR of ADC map correlated with MVDmean and MVDdiff. ADC = apparent diffusion coefficient, COR = correlation, HPF = high power field, MVD = microvessel density
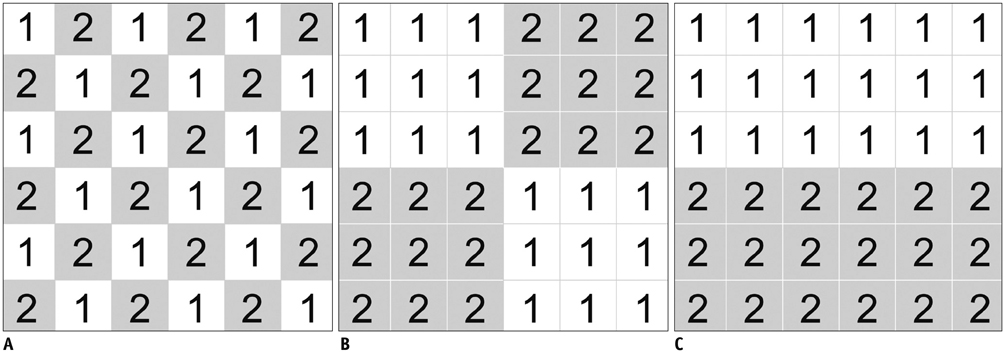
Fig. 7 Three simulations of different correlations. First-order texture parameters are identical for three cases with mean = 1.5 and standard deviation = 0.5 in all matrices. However, second-order texture parameters derived from grey level co-occurrence matrix varied. A. Most heterogeneous mosaic pattern matrix shows lowest correlation value -0.09. B. Intermediate pattern shows correlation 0.49. C. Pattern with largest area of same value shows highest correlation 0.75.
Cited by 2 articles
-
Texture Analysis of Torn Rotator Cuff on Preoperative Magnetic Resonance Arthrography as a Predictor of Postoperative Tendon Status
Yeonah Kang, Guen Young Lee, Joon Woo Lee, Eugene Lee, Bohyoung Kim, Su Jin Kim, Joong Mo Ahn, Heung Sik Kang
Korean J Radiol. 2017;18(4):691-698. doi: 10.3348/kjr.2017.18.4.691.Evaluation of the Impact of Iterative Reconstruction Algorithms on Computed Tomography Texture Features of the Liver Parenchyma Using the Filtration-Histogram Method
Pamela Sung, Jeong Min Lee, Ijin Joo, Sanghyup Lee, Tae-Hyung Kim, Balaji Ganeshan
Korean J Radiol. 2019;20(4):558-568. doi: 10.3348/kjr.2018.0368.
Reference
-
1. Perou CM, Sørlie T, Eisen MB, van de Rijn M, Jeffrey SS, Rees CA, et al. Molecular portraits of human breast tumours. Nature. 2000; 406:747–752.2. Bedard PL, Hansen AR, Ratain MJ, Siu LL. Tumour heterogeneity in the clinic. Nature. 2013; 501:355–364.3. Koh DM, Collins DJ. Diffusion-weighted MRI in the body: applications and challenges in oncology. AJR Am J Roentgenol. 2007; 188:1622–1635.4. Choi BB, Kim SH, Kang BJ, Lee JH, Song BJ, Jeong SH, et al. Diffusion-weighted imaging and FDG PET/CT: predicting the prognoses with apparent diffusion coefficient values and maximum standardized uptake values in patients with invasive ductal carcinoma. World J Surg Oncol. 2012; 10:126.5. Costantini M, Belli P, Distefano D, Bufi E, Matteo MD, Rinaldi P, et al. Magnetic resonance imaging features in triple-negative breast cancer: comparison with luminal and HER2-overexpressing tumors. Clin Breast Cancer. 2012; 12:331–339.6. Guo Y, Cai YQ, Cai ZL, Gao YG, An NY, Ma L, et al. Differentiation of clinically benign and malignant breast lesions using diffusion-weighted imaging. J Magn Reson Imaging. 2002; 16:172–178.7. Jeh SK, Kim SH, Kim HS, Kang BJ, Jeong SH, Yim HW, et al. Correlation of the apparent diffusion coefficient value and dynamic magnetic resonance imaging findings with prognostic factors in invasive ductal carcinoma. J Magn Reson Imaging. 2011; 33:102–109.8. Kamitani T, Matsuo Y, Yabuuchi H, Fujita N, Nagao M, Jinnouchi M, et al. Correlations between apparent diffusion coefficient values and prognostic factors of breast cancer. Magn Reson Med Sci. 2013; 12:193–199.9. Park SH, Moon WK, Cho N, Song IC, Chang JM, Park IA, et al. Diffusion-weighted MR imaging: pretreatment prediction of response to neoadjuvant chemotherapy in patients with breast cancer. Radiology. 2010; 257:56–63.10. Jung DC, Lee HJ, Seo JW, Park SY, Lee SJ, Lee JH, et al. Diffusion-weighted imaging of a prostate cancer xenograft model seen on a 7 Tesla animal MR scanner: comparison of ADC values and pathologic findings. Korean J Radiol. 2012; 13:82–89.11. Stephen RM, Pagel MD, Brown K, Baker AF, Meuillet EJ, Gillies RJ. Monitoring the development of xenograft triple-negative breast cancer models using diffusion-weighted magnetic resonance imaging. Exp Biol Med (Maywood). 2012; 237:1273–1280.12. Davnall F, Yip CS, Ljungqvist G, Selmi M, Ng F, Sanghera B, et al. Assessment of tumor heterogeneity: an emerging imaging tool for clinical practice? Insights Imaging. 2012; 3:573–589.13. Karahaliou A, Vassiou K, Arikidis NS, Skiadopoulos S, Kanavou T, Costaridou L. Assessing heterogeneity of lesion enhancement kinetics in dynamic contrast-enhanced MRI for breast cancer diagnosis. Br J Radiol. 2010; 83:296–309.14. Haralick RM, Shanmugam K, Dinstein IH. Textural features for image classification. IEEE Trans Syst Man Cybern. 1973; SMC-3:610–662.15. Chen W, Giger ML, Li H, Bick U, Newstead GM. Volumetric texture analysis of breast lesions on contrast-enhanced magnetic resonance images. Magn Reson Med. 2007; 58:562–571.16. Eary JF, O'Sullivan F, O'Sullivan J, Conrad EU. Spatial heterogeneity in sarcoma 18F-FDG uptake as a predictor of patient outcome. J Nucl Med. 2008; 49:1973–1979.17. Gibbs P, Turnbull LW. Textural analysis of contrast-enhanced MR images of the breast. Magn Reson Med. 2003; 50:92–98.18. Henriksson E, Kjellen E, Wahlberg P, Ohlsson T, Wennerberg J, Brun E. 2-Deoxy-2-[18F] fluoro-D-glucose uptake and correlation to intratumoral heterogeneity. Anticancer Res. 2007; 27:2155–2159.19. Sinha S, Lucas-Quesada FA, DeBruhl ND, Sayre J, Farria D, Gorczyca DP, et al. Multifeature analysis of Gd-enhanced MR images of breast lesions. J Magn Reson Imaging. 1997; 7:1016–1026.20. Tixier F, Le Rest CC, Hatt M, Albarghach N, Pradier O, Metges JP, et al. Intratumor heterogeneity characterized by textural features on baseline 18F-FDG PET images predicts response to concomitant radiochemotherapy in esophageal cancer. J Nucl Med. 2011; 52:369–378.21. van Velden FH, Cheebsumon P, Yaqub M, Smit EF, Hoekstra OS, Lammertsma AA, et al. Evaluation of a cumulative SUV-volume histogram method for parameterizing heterogeneous intratumoural FDG uptake in non-small cell lung cancer PET studies. Eur J Nucl Med Mol Imaging. 2011; 38:1636–1647.22. Yu H, Caldwell C, Mah K, Poon I, Balogh J, MacKenzie R, et al. Automated radiation targeting in head-and-neck cancer using region-based texture analysis of PET and CT images. Int J Radiat Oncol Biol Phys. 2009; 75:618–625.23. Stejskal EO, Tanner JE. Spin diffusion measurements: spin echoes in the presence of a time-dependent field gradient. J Chem Phys. 1965; 42:288–292.24. Albregtsen F. Statistical texture measures computed from gray level coocurrence matrices. Norway: Image Processing Laboratory Department of Informatics University of Oslo;2008.25. Huuse EM, Moestue SA, Lindholm EM, Bathen TF, Nalwoga H, Krüger K, et al. In vivo MRI and histopathological assessment of tumor microenvironment in luminal-like and basal-like breast cancer xenografts. J Magn Reson Imaging. 2012; 35:1098–1107.26. Zhu Z, Edwards RJ, Boobis AR. Increased expression of histone proteins during estrogen-mediated cell proliferation. Environ Health Perspect. 2009; 117:928–934.27. Katzenellenbogen BS, Kendra KL, Norman MJ, Berthois Y. Proliferation, hormonal responsiveness, and estrogen receptor content of MCF-7 human breast cancer cells grown in the short-term and long-term absence of estrogens. Cancer Res. 1987; 47:4355–4360.28. Downey K, Riches SF, Morgan VA, Giles SL, Attygalle AD, Ind TE, et al. Relationship between imaging biomarkers of stage I cervical cancer and poor-prognosis histologic features: quantitative histogram analysis of diffusion-weighted MR images. AJR Am J Roentgenol. 2013; 200:314–320.29. Kyriazi S, Collins DJ, Messiou C, Pennert K, Davidson RL, Giles SL, et al. Metastatic ovarian and primary peritoneal cancer: assessing chemotherapy response with diffusion-weighted MR imaging--value of histogram analysis of apparent diffusion coefficients. Radiology. 2011; 261:182–192.30. Nelson DA, Tan TT, Rabson AB, Anderson D, Degenhardt K, White E. Hypoxia and defective apoptosis drive genomic instability and tumorigenesis. Genes Dev. 2004; 18:2095–2107.31. Bokacheva L, Ackerstaff E, LeKaye HC, Zakian K, Koutcher JA. High-field small animal magnetic resonance oncology studies. Phys Med Biol. 2014; 59:R65–R127.32. Padhani AR, Liu G, Koh DM, Chenevert TL, Thoeny HC, Takahara T, et al. Diffusion-weighted magnetic resonance imaging as a cancer biomarker: consensus and recommendations. Neoplasia. 2009; 11:102–125.33. Barrett T, Gill AB, Kataoka MY, Priest AN, Joubert I, McLean MA, et al. DCE and DW MRI in monitoring response to androgen deprivation therapy in patients with prostate cancer: a feasibility study. Magn Reson Med. 2012; 67:778–785.34. Vossen JA, Buijs M, Geschwind JF, Liapi E, Prieto Ventura V, Lee KH, et al. Diffusion-weighted and Gd-EOB-DTPA-contrast-enhanced magnetic resonance imaging for characterization of tumor necrosis in an animal model. J Comput Assist Tomogr. 2009; 33:626–630.35. Wagner M, Maggiori L, Ronot M, Paradis V, Vilgrain V, Panis Y, et al. Diffusion-weighted and T2-weighted MR imaging for colorectal liver metastases detection in a rat model at 7 T: a comparative study using histological examination as reference. Eur Radiol. 2013; 23:2156–2164.36. Chen YW, Pan HB, Tseng HH, Chu HC, Hung YT, Yen YC, et al. Differentiated epithelial- and mesenchymal-like phenotypes in subcutaneous mouse xenografts using diffusion weighted-magnetic resonance imaging. Int J Mol Sci. 2013; 14:21943–21959.37. Kim SH, Cha ES, Kim HS, Kang BJ, Choi JJ, Jung JH, et al. Diffusion-weighted imaging of breast cancer: correlation of the apparent diffusion coefficient value with prognostic factors. J Magn Reson Imaging. 2009; 30:615–620.38. Razek AA, Gaballa G, Denewer A, Nada N. Invasive ductal carcinoma: correlation of apparent diffusion coefficient value with pathological prognostic factors. NMR Biomed. 2010; 23:619–623.39. Nowell PC. The clonal evolution of tumor cell populations. Science. 1976; 194:23–28.40. Le Bihan D, Breton E, Lallemand D, Grenier P, Cabanis E, Laval-Jeantet M. MR imaging of intravoxel incoherent motions: application to diffusion and perfusion in neurologic disorders. Radiology. 1986; 161:401–407.41. Liu C, Liang C, Liu Z, Zhang S, Huang B. Intravoxel incoherent motion (IVIM) in evaluation of breast lesions: comparison with conventional DWI. Eur J Radiol. 2013; 82:e782–e789.42. Doblas S, Wagner M, Leitao HS, Daire JL, Sinkus R, Vilgrain V, et al. Determination of malignancy and characterization of hepatic tumor type with diffusion-weighted magnetic resonance imaging: comparison of apparent diffusion coefficient and intravoxel incoherent motion-derived measurements. Invest Radiol. 2013; 48:722–728.43. Sigmund EE, Cho GY, Kim S, Finn M, Moccaldi M, Jensen JH, et al. Intravoxel incoherent motion imaging of tumor microenvironment in locally advanced breast cancer. Magn Reson Med. 2011; 65:1437–1447.44. Tamura T, Usui S, Murakami S, Arihiro K, Akiyama Y, Naito K, et al. Biexponential Signal Attenuation Analysis of Diffusion-weighted Imaging of Breast. Magn Reson Med Sci. 2010; 9:195–207.
- Full Text Links
-
- Actions
-
Cited
- CITED
-
- Close
- Share
-
- Similar articles
-
- MR Spectroscopy and Diffusion Weighted Imaging Findings of Primary Non-Hodgkin Lymphoma of the Breast: Two Case Reports
- Angiomatous Meningioma: CT and MR Imaging Features
- MR Imaging Findings and Texture Analysis of Pure and Mixed Mucinous Breast Carcinoma
- A Study Using Diffusion-Weighted MR Image in the Experimental Models with Diffusion Difference
- Diffusion-Weighted Imaging of a Prostate Cancer Xenograft Model Seen on a 7 Tesla Animal MR Scanner: Comparison of ADC Values and Pathologic Findings
