Comparison of One- and Two-Region of Interest Strain Elastography Measurements in the Differential Diagnosis of Breast Masses
- Affiliations
-
- 1Department of Radiology, Seoul National University Bundang Hospital, Seoul National University College of Medicine, Seongnam, Korea. kimsmlms@daum.net
- 2Division of Biomedical Engineering, Hankuk University of Foreign Studies, Yongin, Korea.
- 3Department of Radiology, Chungbuk National University Hospital, Cheongju, Korea.
- 4Department of Radiology, Chung-Ang University Hospital, Chung-Ang University College of Medicine, Seoul, Korea.
- KMID: 2471809
- DOI: http://doi.org/10.3348/kjr.2019.0479
Abstract
OBJECTIVE
To compare the diagnostic performance and interobserver variability of strain ratio obtained from one or two regions of interest (ROI) on breast elastography.
MATERIALS AND METHODS
From April to May 2016, 140 breast masses in 140 patients who underwent conventional ultrasonography (US) with strain elastography followed by US-guided biopsy were evaluated. Three experienced breast radiologists reviewed recorded US and elastography images, measured strain ratios, and categorized them according to the American College of Radiology breast imaging reporting and data system lexicon. Strain ratio was obtained using the 1-ROI method (one ROI drawn on the target mass), and the 2-ROI method (one ROI in the target mass and another in reference fat tissue). The diagnostic performance of the three radiologists among datasets and optimal cut-off values for strain ratios were evaluated. Interobserver variability of strain ratio for each ROI method was assessed using intraclass correlation coefficient values, Bland-Altman plots, and coefficients of variation.
RESULTS
Compared to US alone, US combined with the strain ratio measured using either ROI method significantly improved specificity, positive predictive value, accuracy, and area under the receiver operating characteristic curve (AUC) (all p values < 0.05). Strain ratio obtained using the 1-ROI method showed higher interobserver agreement between the three radiologists without a significant difference in AUC for differentiating breast cancer when the optimal strain ratio cut-off value was used, compared with the 2-ROI method (AUC: 0.788 vs. 0.783, 0.693 vs. 0.715, and 0.691 vs. 0.686, respectively, all p values > 0.05).
CONCLUSION
Strain ratios obtained using the 1-ROI method showed higher interobserver agreement without a significant difference in AUC, compared to those obtained using the 2-ROI method. Considering that the 1-ROI method can reduce performers' efforts, it could have an important role in improving the diagnostic performance of breast US by enabling consistent management of breast lesions.
Keyword
MeSH Terms
Figure
-
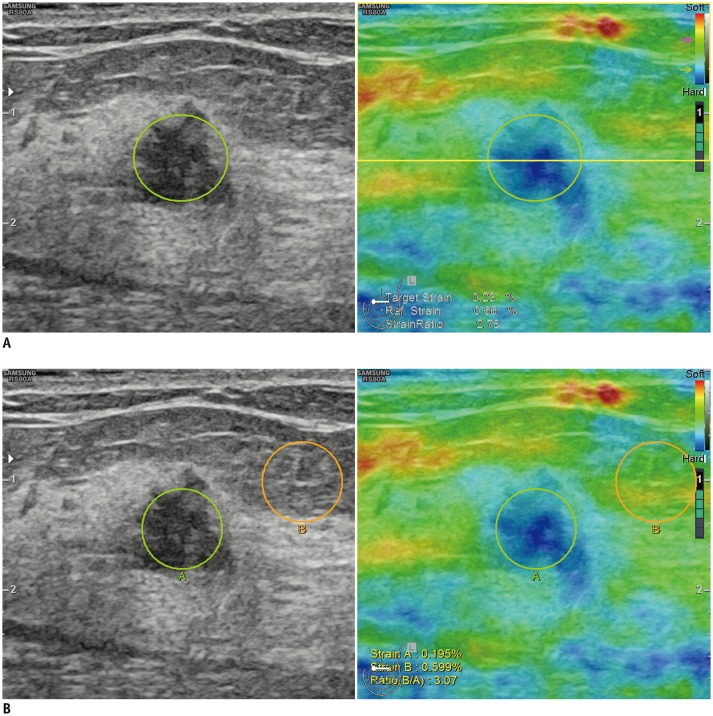
Fig. 1 Representative images showing ROI used to obtain strain ratio using 1-ROI (A) and 2-ROI methods (B).A. For 1-ROI method, oval ROI was set to include mass (green circle) in which US unit automatically calculated and visualized strain ratio as mean strain within ROI drawn along border of mass divided by mean strain of fat located at and above level of ROI set for mass strain measurement, excluding strain measured within ROI set for mass measurement (yellow box). B. For 2-ROI method, one ROI was drawn along border of targeted breast mass (green circle) and another was drawn in lateral subcutaneous fat tissue located near target lesion (orange circle). Reference strain for 2-ROI method (B) was measured as average strain within orange circle. ROI = region of interest, US = ultrasonography
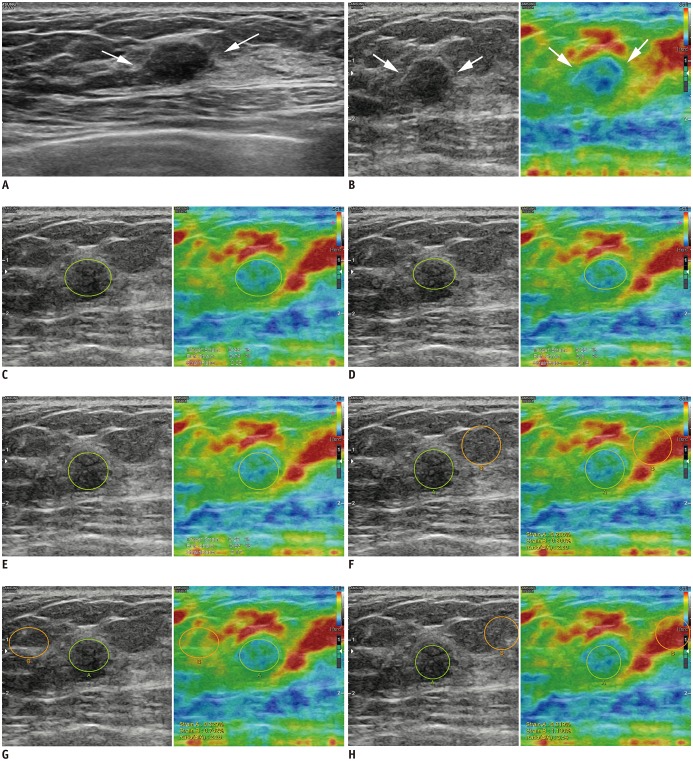
Fig. 2 27-year-old woman diagnosed with fibroadenoma on US-guided biopsy was stable during > 2 years of follow-up.A. Transverse B-mode US image shows 9-mm indistinct oval hypoechoic mass (arrows) in left breast that was categorized as Category 4a by each radiologist. B. Strain elastography showed that mass had some hard areas (arrows). Strain ratios using 1-ROI method were 2.25 (C), 2.16 (D), and 2.17 (E) according to three radiologists (green circle indicated ROI for target lesion). Strain ratios using 2-ROI method were 2.80 (F), 2.26 (G), and 3.54 (H) according to three radiologists (green circle indicated ROI for target lesion, orange circle indicated ROI for reference fat).
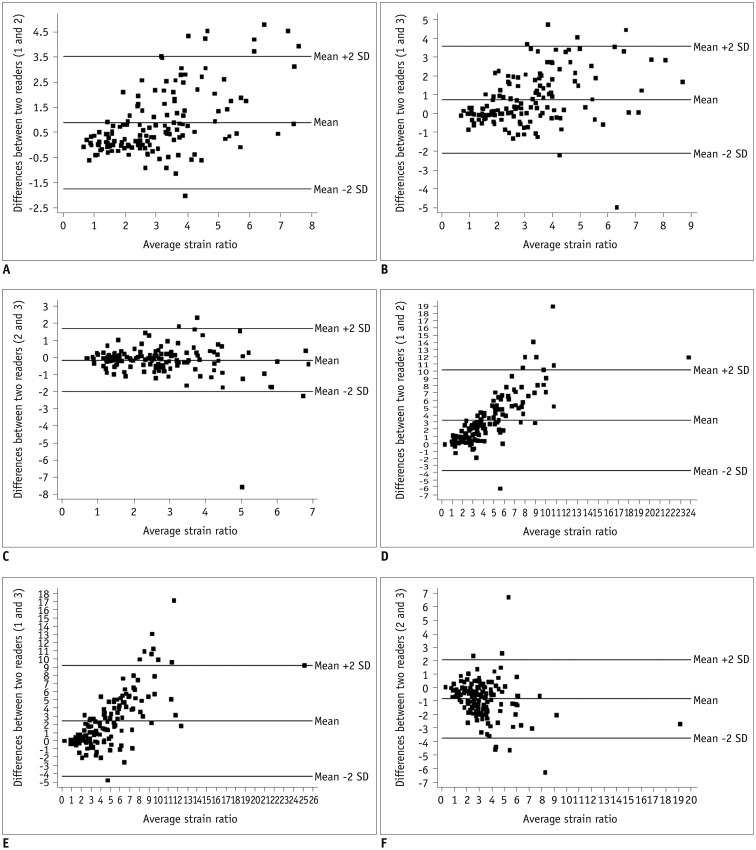
Fig. 3 Series of Bland-Altman plots show interobserver agreement of strain ratios for both 1-ROI (A–C) and 2-ROI methods (D–F).Each dot represents difference in strain ratios between two radiologists measured using same ROI method for each of 140 breast masses. Middle horizontal line represents mean difference in strain ratio, and each line above and below horizontal line represents mean difference between upper and lower limits of 95% agreement limit. For 1-ROI method, mean differences in strain ratios were as follows: (A) 0.891, with upper and lower limits of 3.533 and −1.751 between radiologists 1 and 2; (B) 0.746 with upper and lower limits of 3.599 and −2.108 between radiologists 1 and 3; and (C) −0.145 with upper and lower limits of 1.712 and −2.003 between radiologists 2 and 3. For 2-ROI method, mean differences in strain ratios were as follows: (D) 3.251, with upper and lower limits of 10.228 and −3.726 between radiologists 1 and 2; (E) 2.431 with upper and lower limits of 9.213 and −4.350, between radiologists 1 and 3; and (F) −0.820, with upper and lower limits of 2.106 and −3.746 between radiologists 2 and 3. SD = standard deviation
Reference
-
1. Itoh A, Ueno E, Tohno E, Kamma H, Takahashi H, Shiina T, et al. Breast disease: clinical application of US elastography for diagnosis. Radiology. 2006; 239:341–350. PMID: 16484352.
Article2. Shiina T. JSUM ultrasound elastography practice guidelines: basics and terminology. J Med Ultrason. 2013; 40:309–323.
Article3. Barr RG. Elastography in clinical practice. Radiol Clin North Am. 2014; 52:1145–1162. PMID: 25444097.
Article4. Kim DW, Suh CH, Kim KW, Pyo J, Park C, Jung SC. Technical performance of two-dimensional shear wave elastography for measuring liver stiffness: a systematic review and meta-analysis. Korean J Radiol. 2019; 20:880–893. PMID: 31132814.
Article5. Yoon H, Shin HJ, Kim MJ, Lee MJ. Quantitative imaging in pediatric hepatobiliary disease. Korean J Radiol. 2019; 20:1342–1357. PMID: 31464113.
Article6. Yun SJ, Jin W, Cho NS, Ryu KN, Yoon YC, Cha JG, et al. Shear-wave and strain ultrasound elastography of the supraspinatus and infraspinatus tendons in patients with idiopathic adhesive capsulitis of the shoulder: a prospective case-control study. Korean J Radiol. 2019; 20:1176–1185. PMID: 31270981.
Article7. Ricci P, Maggini E, Mancuso E, Lodise P, Cantisani V, Catalano C. Clinical application of breast elastography: state of the art. Eur J Radiol. 2014; 83:429–437. PMID: 23787274.
Article8. Gong X, Xu Q, Xu Z, Xiong P, Yan W, Chen Y. Real-time elastography for the differentiation of benign and malignant breast lesions: a meta-analysis. Breast Cancer Res Treat. 2011; 130:11–18. PMID: 21870128.
Article9. D'Orsi CJ, Sickles EA, Mendelson EB, Morris EA. ACR BI-RADS® atlas: breast imaging reporting and data system. Reston VA: American College of Radiology;2013.10. Garra BS. Imaging and estimation of tissue elasticity by ultrasound. Ultrasound Q. 2007; 23:255–268. PMID: 18090836.
Article11. Thomas A, Degenhardt F, Farrokh A, Wojcinski S, Slowinski T, Fischer T. Significant differentiation of focal breast lesions: calculation of strain ratio in breast sonoelastography. Acad Radiol. 2010; 17:558–563. PMID: 20171905.12. Barr RG, Destounis S, Lackey LB 2nd, Svensson WE, Balleyguier C, Smith C. Evaluation of breast lesions using sonographic elasticity imaging: a multicenter trial. J Ultrasound Med. 2012; 31:281–287. PMID: 22298872.13. Sadigh G, Carlos RC, Neal CH, Dwamena BA. Accuracy of quantitative ultrasound elastography for differentiation of malignant and benign breast abnormalities: a meta-analysis. Breast Cancer Res Treat. 2012; 134:923–931. PMID: 22418703.
Article14. Zhi H, Xiao XY, Ou B, Zhong WJ, Zhao ZZ, Zhao XB, et al. Could ultrasonic elastography help the diagnosis of small (≤2 cm) breast cancer with the usage of sonographic BI-RADS classification? Eur J Radiol. 2012; 81:3216–3221. PMID: 22608397.15. Thomas A, Fischer T, Frey H, Ohlinger R, Grunwald S, Blohmer JU, et al. Real-time elastography--an advanced method of ultrasound: first results in 108 patients with breast lesions. Ultrasound Obstet Gynecol. 2006; 28:335–340. PMID: 16909438.16. Burnside ES, Hall TJ, Sommer AM, Hesley GK, Sisney GA, Svensson WE, et al. Differentiating benign from malignant solid breast masses with US strain imaging. Radiology. 2007; 245:401–410. PMID: 17940302.
Article17. Regner DM, Hesley GK, Hangiandreou NJ, Morton MJ, Nordland MR, Meixner DD, et al. Breast lesions: evaluation with US strain imaging--clinical experience of multiple observers. Radiology. 2006; 238:425–437. PMID: 16436810.
Article18. Yoon JH, Kim MH, Kim EK, Moon HJ, Kwak JY, Kim MJ. Interobserver variability of ultrasound elastography: how it affects the diagnosis of breast lesions. AJR Am J Roentgenol. 2011; 196:730–736. PMID: 21343520.
Article19. Havre RF, Waage JR, Gilja OH, Ødegaard S, Nesje LB. Real-time elastography: strain ratio measurements are influenced by the position of the reference area. Ultraschall Med. 2012; 33:559–568. PMID: 21667433.
Article20. Yoon JH, Song MK, Kim EK. Semi-quantitative strain ratio in the differential diagnosis of breast masses: measurements using one region-of-interest. Ultrasound Med Biol. 2016; 42:1800–1806. PMID: 27166015.
Article21. Duda VF, Köhler C. An improved quantification tool for breast ElastoScan™: E-Breast™. Seoul: Samsung Medison;2014. White Paper.22. Yoon JH, Song MK, Kim EK. Semi-quantitative strain ratio determined using different measurement methods: comparison of strain ratio values and diagnostic performance using one- versus two-region-of-interest measurement. Ultrasound Med Biol. 2017; 43:911–917. PMID: 28242085.
Article23. Chang JM, Won JK, Lee KB, Park IA, Yi A, Moon WK. Comparison of shear-wave and strain ultrasound elastography in the differentiation of benign and malignant breast lesions. AJR Am J Roentgenol. 2013; 201:W347–W356. PMID: 23883252.
Article24. Chang JM, Moon WK, Cho N, Kim SJ. Breast mass evaluation: factors influencing the quality of US elastography. Radiology. 2011; 259:59–64. PMID: 21330569.
Article25. Enderlein G, Fleiss J. L: The design and analysis of clinical experiments. Wiley, New York–Chichester–Brislane–Toronto–Singapore 1986, 432 S., £38.35. Biom J. 1988; 30:304.26. Bland JM, Altman DG. Statistical methods for assessing agreement between two methods of clinical measurement. Lancet. 1986; 1:307–310. PMID: 2868172.
Article27. Fischer T, Peisker U, Fiedor S, Slowinski T, Wedemeyer P, Diekmann F, et al. Significant differentiation of focal breast lesions: raw data-based calculation of strain ratio. Ultraschall Med. 2012; 33:372–379. PMID: 21614749.
- Full Text Links
-
- Actions
-
Cited
- CITED
-
- Close
- Share
-
- Similar articles
-
- Future of breast elastography
- Application of Point Shearwave Elastography to Breast Ultrasonography: Initial Experience Using “S-Shearwave†in Differential Diagnosis
- Which supplementary imaging modality should be used for breast ultrasonography? Comparison of the diagnostic performance of elastography and computer-aided diagnosis
- Strain elastography of tongue carcinoma using intraoral ultrasonography: A preliminary study to characterize normal tissues and lesions
- Shear-wave elastography for breast masses: local shear wave speed (m/sec) versus Young modulus (kPa)
