Quantification of Fat Concentration and Vascular Response in Brown and White Adipose Tissue of Rats by Spectral CT Imaging
- Affiliations
-
- 1Department of Radiology, Zhongda Hospital, Jiangsu Key Laboratory of Molecular and Functional Imaging, Medical School of Southeast University, Nanjing, China. jsh0836@hotmail.com
- KMID: 2471642
- DOI: http://doi.org/10.3348/kjr.2019.0111
Abstract
OBJECTIVE
The purpose of the study was to non-invasively characterize and discriminate brown adipose tissue (BAT) from white adipose tissue (WAT) in rats using spectral computed tomography (CT) with histological validation.
MATERIALS AND METHODS
A lipid-containing phantom (lipid fractions from 0% to 100%) was imaged with spectral CT. An in vivo, non-enhanced spectral CT scan was performed on 24 rats, and fat concentrations of BAT and WAT were measured. The rats were randomized to receive intraperitoneal treatment with norepinephrine (NE) (n = 12) or saline (n = 12). Non-enhanced and enhanced spectral CT scans were performed after treatment to measure the elevation of iodine in BAT and WAT. The BAT/aorta and WAT/aorta ratios were calculated and compared, after which isolated BAT and WAT samples were subjected to histological and uncoupling protein 1 (UCP1) analyses.
RESULTS
The ex-vivo phantom study showed excellent linear fit between measured fat concentration and the known gravimetric reference standard (r² = 0.996). In vivo, BAT had significantly lower fat concentration than WAT (p < 0.001). Compared to the saline group, the iodine concentration of BAT increased significantly (p < 0.001) after injection of NE, while the iodine concentration of WAT only changed slightly. The BAT/aorta ratio also increased significantly after exposure to NE compared to the saline group (p < 0.001). Histological and UCP1 expression analyses supported the spectral CT imaging results.
CONCLUSION
The study consolidates spectral CT as a new approach for non-invasive imaging of BAT and WAT. Quantitative analyses of BAT and WAT by spectral CT revealed different characteristics and pharmacologic activations in the two types of adipose tissue.
Keyword
MeSH Terms
Figure
-
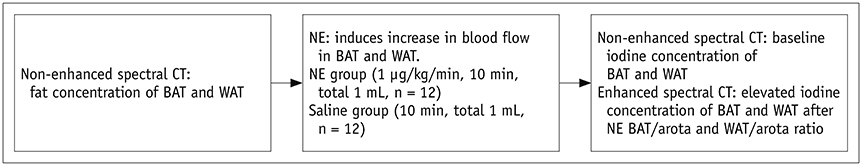
Fig. 1 Schematic procedure of study. First, non-enhanced spectral CT scan was performed on all animals, and fat concentration and baseline iodine concentration of BAT and WAT were measured. Rats were then randomly divided into NE group (n = 12) and saline group (n = 12) injected with NE and saline, respectively. NE infusion was performed, followed by contrast-enhanced spectral CT, which measured changes in iodine concentrations of BAT and WAT. BAT = brown adipose tissue, NE = norepinephrine, WAT = white adipose tissue

Fig. 2 Time-enhancement curve in BAT with injection of contrast medium. A. ROI (red circle) was placed on BAT of interscapular region. B. Zero point on x-axis is starting point of contrast medium injection. Vertical gray bar indicates time of contrast-enhanced spectral CT scan. ROI = region of interest
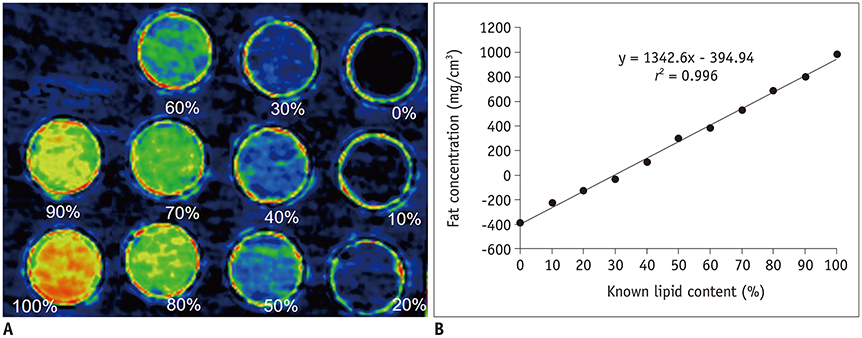
Fig. 3 Lipid-containing phantom imaging by spectral CT (lipid fraction ranging from 0% to 100%). A. Fat-base imaging of phantom. B. Graph showing strong correlation between known lipid content (%) and fat concentration measured by spectral CT (r2 = 0.996, p < 0.001).
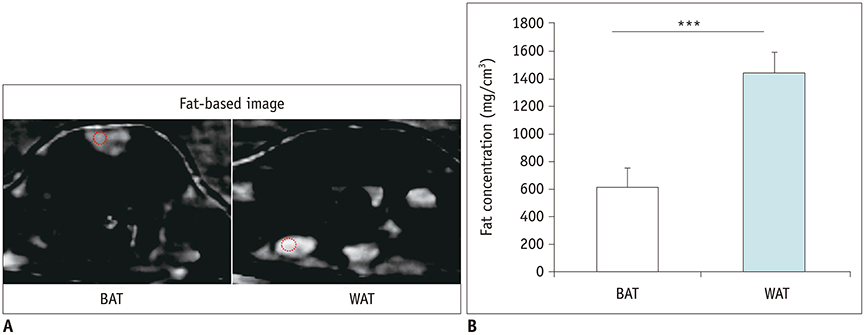
Fig. 4 Examples of fat-based material decomposition image of BAT and WAT. A. Red circles indicate positions of ROIs used to calculate material concentrations. B. Fat concentrations of selected ROIs on BAT and WAT. Fat concentration was significantly lower in BAT than in WAT. ***p < 0.001.
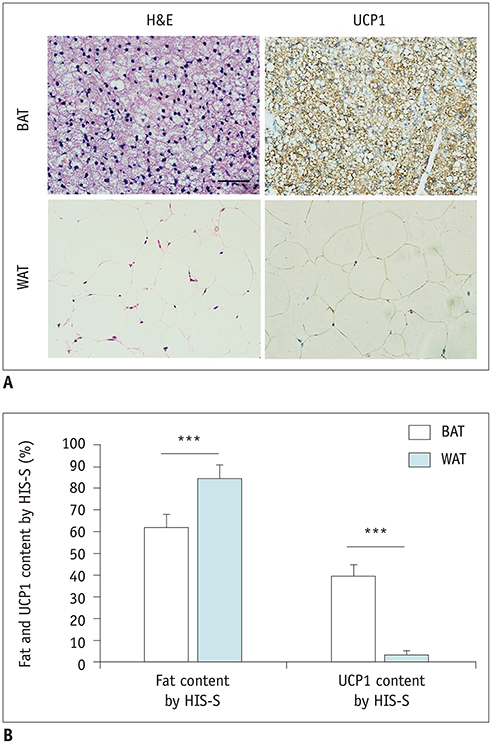
Fig. 5 Histological characteristics of BAT and WAT. A. Histological analysis of BAT and WAT sections, including H&E staining and immunohistochemistry of UCP1 (× 400; scale bar, 50 µm). B. Adipocyte size of WAT was significantly larger than that of BAT. UCP1 content of BAT was significantly higher than that of WAT. ***p < 0.001. H&E = hematoxylin and eosin, HIS-S = histological semi-automatic vacuole segmentation procedure, UCP1 = uncoupling protein 1

Fig. 6 Quantification of iodine concentration in BAT and WAT after NE injection by contrast-enhanced spectral CT. A, B. Changes in iodine concentration in BAT (yellow circle) after saline or NE injection. B. Although iodine concentration was not different between two groups at baseline, it increased considerably greater in NE group than in saline group in contrast-enhanced spectral CT imaging. C, D. Changes in iodine concentration in WAT (yellow circle) after saline or NE. D. No significant changes in iodine concentration was observed in WAT in both groups. Limited increase in iodine concentration from baseline to contrast-enhanced spectral CT was observed. ***p < 0.001.
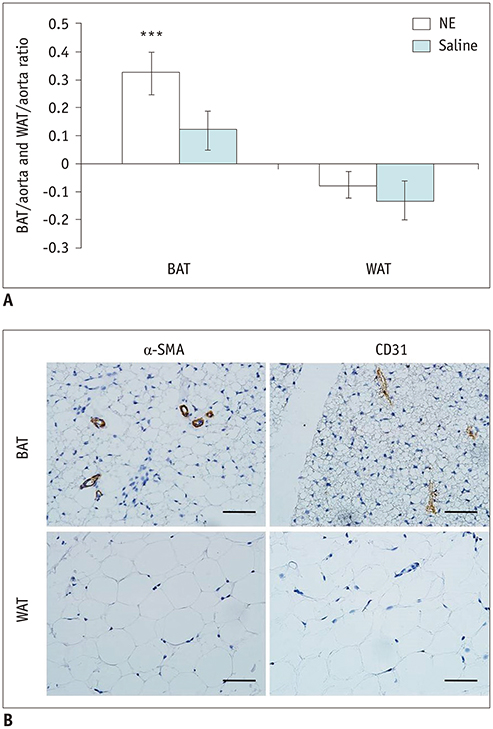
Fig. 7 Comparisons of vasculization of BAT and WAT. A. BAT/aorta ratio of iodine concentration in NE group (0.32 ± 0.07) was significantly higher compared to saline group (0.12 ± 0.07; p < 0.001). In contrast, there was no significant difference in WAT/aorta ratio between NE (−0.08 ± 0.03) and saline (−0.13 ± 0.07) groups (p > 0.05). B. Immunohistochemical analysis of BAT and WAT for α-SMA and CD31 (× 400; scale bar, 50 µm) demonstrated larger number of micro-vessels in BAT. ***p < 0.001. α-SMA = alpha-smooth muscle actin
Reference
-
1. Dawkins MJ, Scopes JW. Non-shivering thermogenesis and brown adipose tissue in the human new-born infant. Nature. 1965; 206:201–202.
Article2. Cannon B, Nedergaard J. Brown adipose tissue: function and physiological significance. Physiol Rev. 2004; 84:277–359.
Article3. Oelkrug R, Polymeropoulos ET, Jastroch M. Brown adipose tissue: physiological function and evolutionary significance. J Comp Physiol B. 2015; 185:587–606.
Article4. Giralt M, Villarroya F. White, brown, beige/brite: different adipose cells for different functions? Endocrinology. 2013; 154:2992–3000.
Article5. Kalinovich AV, de Jong JM, Cannon B, Nedergaard J. UCP1 in adipose tissues: two steps to full browning. Biochimie. 2017; 134:127–137.
Article6. Park A, Kim WK, Bae KH. Distinction of white, beige and brown adipocytes derived from mesenchymal stem cells. World J Stem Cells. 2014; 6:33–42.
Article7. Enerbäck S. Human brown adipose tissue. Cell Metab. 2010; 11:248–252.
Article8. Lean ME. Brown adipose tissue in humans. Proc Nutr Soc. 1989; 48:243–256.
Article9. Lidell ME, Betz MJ, Dahlqvist Leinhard O, Heglind M, Elander L, Slawik M, et al. Evidence for two types of brown adipose tissue in humans. Nat Med. 2013; 19:631–634.
Article10. van Marken Lichtenbelt WD, Vanhommerig JW, Smulders NM, Drossaerts JM, Kemerink GJ, Bouvy ND, et al. Cold-activated brown adipose tissue in healthy men. N Engl J Med. 2009; 360:1500–1508.
Article11. Virtanen KA, Lidell ME, Orava J, Heglind M, Westergren R, Niemi T, et al. Functional brown adipose tissue in healthy adults. N Engl J Med. 2009; 360:1518–1525.
Article12. Cypess AM, Lehman S, Williams G, Tal I, Rodman D, Goldfine AB, et al. Identification and importance of brown adipose tissue in adult humans. N Engl J Med. 2009; 360:1509–1517.
Article13. Bahler L, Holleman F, Booij J, Hoekstra JB, Verberne HJ. Interobserver and intraobserver variability for the assessment of brown adipose tissue activity on 18F-FDG PET-CT. Nucl Med Commun. 2016; 37:363–371.
Article14. Zainon R, Ronaldson JP, Janmale T, Scott NJ, Buckenham TM, Butler AP, et al. Spectral CT of carotid atherosclerotic plaque: comparison with histology. Eur Radiol. 2012; 22:2581–2588.
Article15. Qian LJ, Zhu J, Zhuang ZG, Xia Q, Cheng YF, Li JY, et al. Differentiation of neoplastic from bland macroscopic portal vein thrombi using dual-energy spectral CT imaging: a pilot study. Eur Radiol. 2012; 22:2178–2185.
Article16. Peng XG, Ju S, Qin Y, Fang F, Cui X, Liu G, et al. Quantification of liver fat in mice: comparing dual-echo Dixon imaging, chemical shift imaging, and 1H-MR spectroscopy. J Lipid Res. 2011; 52:1847–1855.17. Peng XG, Ju S, Fang F, Wang Y, Fang K, Cui X, et al. Comparison of brown and white adipose tissue fat fractions in ob, seipin, and Fsp27 gene knockout mice by chemical shiftselective imaging and (1)H-MR spectroscopy. Am J Physiol Endocrinol Metab. 2013; 304:E160–E167.
Article18. d'Assignies G, Ruel M, Khiat A, Lepanto L, Chagnon M, Kauffmann C, et al. Noninvasive quantitation of human liver steatosis using magnetic resonance and bioassay methods. Eur Radiol. 2009; 19:2033–2040.19. Ramseyer VD, Granneman JG. Adrenergic regulation of cellular plasticity in brown, beige/brite and white adipose tissues. Adipocyte. 2016; 5:119–129.
Article20. Mendonça PR, Lamb P, Kriston A, Sasaki K, Kudo M, Sahani DV. Contrast-independent liver-fat quantification from spectral CT exams. Med Image Comput Comput Assist Interv. 2013; 16(Pt 1):324–331.
Article21. Cao Q, Shang S, Han X, Cao D, Zhao L. Evaluation on heterogeneity of fatty liver in rats: a multiparameter quantitative analysis by dual energy CT. Acad Radiol. 2019; 26:e47–e55.22. Yang CB, Zhang S, Jia YJ, Duan HF, Ma GM, Zhang XR, et al. Clinical application of dual-energy spectral computed tomography in detecting cholesterol gallstones from surrounding bile. Acad Radiol. 2017; 24:478–482.
Article23. Feng Q, Xu XT, Zhou Y, Yan YQ, Ran ZH, Zhu J. Creeping fat in patients with ileo-colonic Crohn's disease correlates with disease activity and severity of inflammation: a preliminary study using energy spectral computed tomography. J Dig Dis. 2018; 19:475–484.
Article24. Géloën A, Collet AJ, Guay G, Bukowiecki LJ. Beta-adrenergic stimulation of brown adipocyte proliferation. Am J Physiol. 1988; 254(1 Pt 1):C175–C182.25. Rutkowski JM, Davis KE, Scherer PE. Mechanisms of obesity and related pathologies: the macro- and microcirculation of adipose tissue. FEBS J. 2009; 276:5738–5746.
Article26. Rosen ED, Spiegelman BM. What we talk about when we talk about fat. Cell. 2014; 156:20–44.
Article27. Cypess AM, Doyle AN, Sass CA, Huang TL, Mowschenson PM, Rosen HN, et al. Quantification of human and rodent brown adipose tissue function using 99mTc-methoxyisobutylisonitrile SPECT/CT and 18F-FDG PET/CT. J Nucl Med. 2013; 54:1896–1901.
Article28. Lau AZ, Chen AP, Gu Y, Ladouceur-Wodzak M, Nayak KS, Cunningham CH. Noninvasive identification and assessment of functional brown adipose tissue in rodents using hyperpolarized 13C imaging. Int J Obes (Lond). 2014; 38:126–131.29. Baron DM, Clerte M, Brouckaert P, Raher MJ, Flynn AW, Zhang H, et al. In vivo noninvasive characterization of brown adipose tissue blood flow by contrast ultrasound in mice. Circ Cardiovasc Imaging. 2012; 5:652–659.
Article30. Park JW, Jung KH, Lee JH, Quach CH, Moon SH, Cho YS, et al. 18F-FDG PET/CT monitoring of β3 agonist-stimulated brown adipocyte recruitment in white adipose tissue. J Nucl Med. 2015; 56:153–158.
Article
- Full Text Links
-
- Actions
-
Cited
- CITED
-
- Close
- Share
-
- Similar articles
-
- Changes of Lipogenic and Lipolytic Activities Following Repeated Fasting and Refeeding in Rat
- Brown Fat and Browning for the Treatment of Obesity and Related Metabolic Disorders
- The Mechanism of White and Brown Adipocyte Differentiation
- HOXC10 suppresses browning of white adipose tissues
- (99m)Tc-MIBI Uptake in a Thyroid Adenoma with Diffuse Adipose Metaplasia
