Role of a 19S Proteasome Subunit- PSMD10(Gankyrin) in Neurogenesis of Human Neural Progenitor Cells
- Affiliations
-
- 1Advance Centre for Treatment, Research and Education in Cancer, Tata Memorial Centre, Kharghar, Navi Mumbai, India. vprasanna@actrec.gov.in
- 2Faculty of Biology, Technion – Israel Institute of Technology, Haifa, Israel.
- 3Homi Bhabha National Institute, BARC Training School Complex, Mumbai, Maharashtra, India.
- 4Department of Pathology, University of Massachusetts Medical School, Worcester, MA, USA.
- 5Department of Physics, Bose Institute, Kolkata, India. soumen@jcbose.ac.in
- KMID: 2465887
- DOI: http://doi.org/10.15283/ijsc19007
Abstract
- PSMD10(Gankyrin), a proteasome assembly chaperone, is a widely known oncoprotein which aspects many hall mark properties of cancer. However, except proteasome assembly chaperon function its role in normal cell function remains unknown. To address this issue, we induced PSMD10(Gankyrin) overexpression in HEK293 cells and the resultant large-scale changes in gene expression profile were analyzed. We constituted networks from microarray data of these differentially expressed genes and carried out extensive topological analyses. The overrecurring yet consistent theme that appeared throughout analysis using varied network metrics is that all genes and interactions identified as important would be involved in neurogenesis and neuronal development. Intrigued we tested the possibility that PSMD10(Gankyrin) may be strongly associated with cell fate decisions that commit neural stem cells to differentiate into neurons. Overexpression of PSMD10(Gankyrin) in human neural progenitor cells facilitated neuronal differentiation via β-catenin Ngn1 pathway. Here for the first time we provide preliminary and yet compelling experimental evidence for the involvement of a potential oncoprotein - PSMD10(Gankyrin), in neuronal differentiation.
MeSH Terms
Figure
-
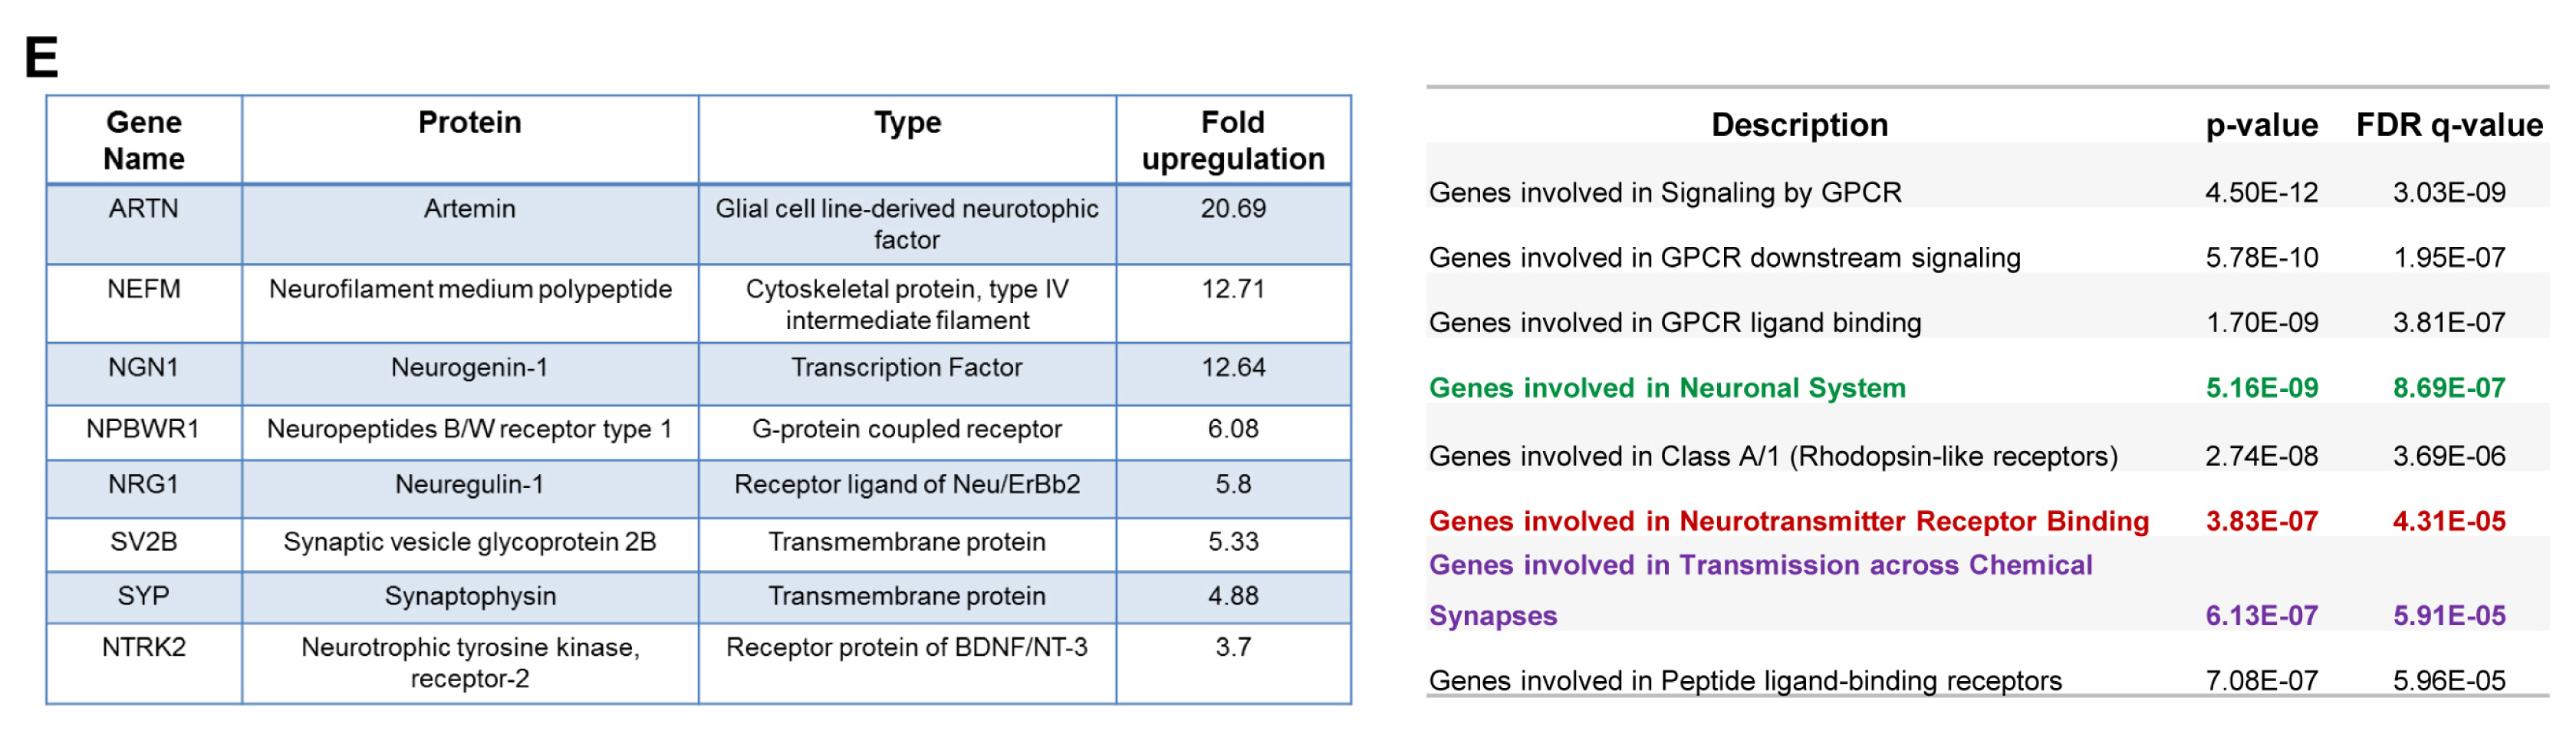
Fig. 1 Microarray and Network analysis of HEK293 cells upon PSMD10Gankyrin overexpression. (A) Workflow for Microarray and bioinformatics analysis upon PSMD10Gankyrin overexpression in HEK293 cells. The anti-PSMD10Gankyrin WB image shows the expression of Flag-PSMD10Gankyrin and endogenous PSMD10Gankyrin from the lysates of control and overexpressed PSMD10Gankyrin HEK293 cells. (B) Network depicts the role of the top five genes possessing the highest node betweenness centrality (yellow diamond), for overexpressed PSMD10Gankyrin in HEK293 cells. Only interactions of the "other" genes (purple diamond) with these five most "between" genes is shown. Mutual interactions among these "other" genes is excluded. Interestingly, this network shows few "other" genes interacting simultaneously with two "between" genes. Further, none of the "other" genes interacts simultaneously with three of the most "between" genes. The insert table shows the value of degree and Node betweenness centrality for the top five genes. (C) The GSEA set of genes were analyzed in KEGG pathway analysis. The bubble chart depicting the topmost pathways (with highest p-values and FDR q-values) altered upon overexpressed PSMD10Gankyrin. Each bubble represents a pathway with gene number involved and had appeared in the GSEA gene set. In the table the above pathways are represented in the same color as the bubble colors along with the p-value and FDR q-value. (D) The overrepresented genes were queried against the Reactome pathway within GSEA and are depicted in the bubble chart. Five bubbles (starting from “Genes involved in Neuronal System” in the table) depict the pathways with highest p-values and FDR q-values altered upon overexpressed PSMD10Gankyrin. Each bubble represents a pathway with number genes as appeared in the GSEA gene set. The table represents the top 8 pathways with corresponding p-value and FDR q-value highlighting the neuronal pathways in the same color as the bubble color. (E) Table shows the list of top neuron specific genes which are significantly upregulated upon PSMD10Gankyrin overexpression in HEK293 cells as determined by microarray. Overexpression of PSMD10Gankyrin in stable clone as compared to the vector control cells is included as a reference. (F) Bar graphs shows validation of microarray data by real time PCR for Ngn1 and Nrg1 genes. PSMD10Gankyrin levels in stable clone as measured by real time PCR is also shown. Data represents the average fold increase of mRNA levels (normalized with GAPDH) from three independent experiments. The bubble chats were prepared by online tool https://www.onlinecharttool.com.

Fig. 2 Differentiated human neural progenitor cells (hNPCs) shows higher expression of PSMD10Gankyrin. (A) Progenitor cells were cultured on laminin coated glass coverslips to ~80% confluence. Immunofluorescence was performed following the protocol described in materials and methods. Cells stained positive for Nestin (in red) Sox2 (in green), Musashi (in green) and DAPI (nuclear stain; in blue). Images were acquired in a Laser confocal microscope (Zeiss LSM meta-510). (B) Progenitor cells were grown as described and differentiated using differentiation media. Media was changed every alternative day. Cultures were processed for further experiments on the 12th day of differentiation. Immunofluorescence was performed following the protocol described in materials and methods. Cells stained for β-III tubulin (in red), and GFAP (in green) indicating the formation of neurons and astrocytes respectively. (C) Cell lysates of hNPCs and differentiated cells were subjected to WB. Image shows the expression of stem cell and differentiation markers in the progenitor cells (UD) and differentiated cells (DF) respectively. (D) The bar graph represents the percentage of neurons and astrocytes differentiated from above experiments (Fig. 2B). Data represents average of the percentage of cells from three independent experiments, each counted from 12 different fields (12×3=36 microscopic fields). (E) WB images of cell lysates of hNPCs and differentiated cells show expression of PSMD10Gankyrin and other proteasomal subunits in the progenitor cells (UD) and differentiated cells (DF). (F) The bar graph represents the quantification of proteasomal subunits protein level expression counted from above experiments (Fig. 2B) in fold change (from three independent experiments with ± SEM) in DF cells compared to UD cells after normalizing with β-actin. (G) Semi-Q PCR gel image shows the mRNA levels of PSMD10Gankyrin in the progenitor cells (UD) and differentiated cells (DF). (H) Graph represents mRNA levels of PSMD10Gankyrin in the progenitor cells (UD) and differentiated cells (DF) measured by the Real-time PCR. Data represents the average fold increase of mRNA levels (normalized with GAPDH) of three independent experiments with ± SEM. (I) Semi-Q PCR gel image shows the mRNA levels of proteasomal subunits in the progenitor cells (UD) and differentiated cells (DF).
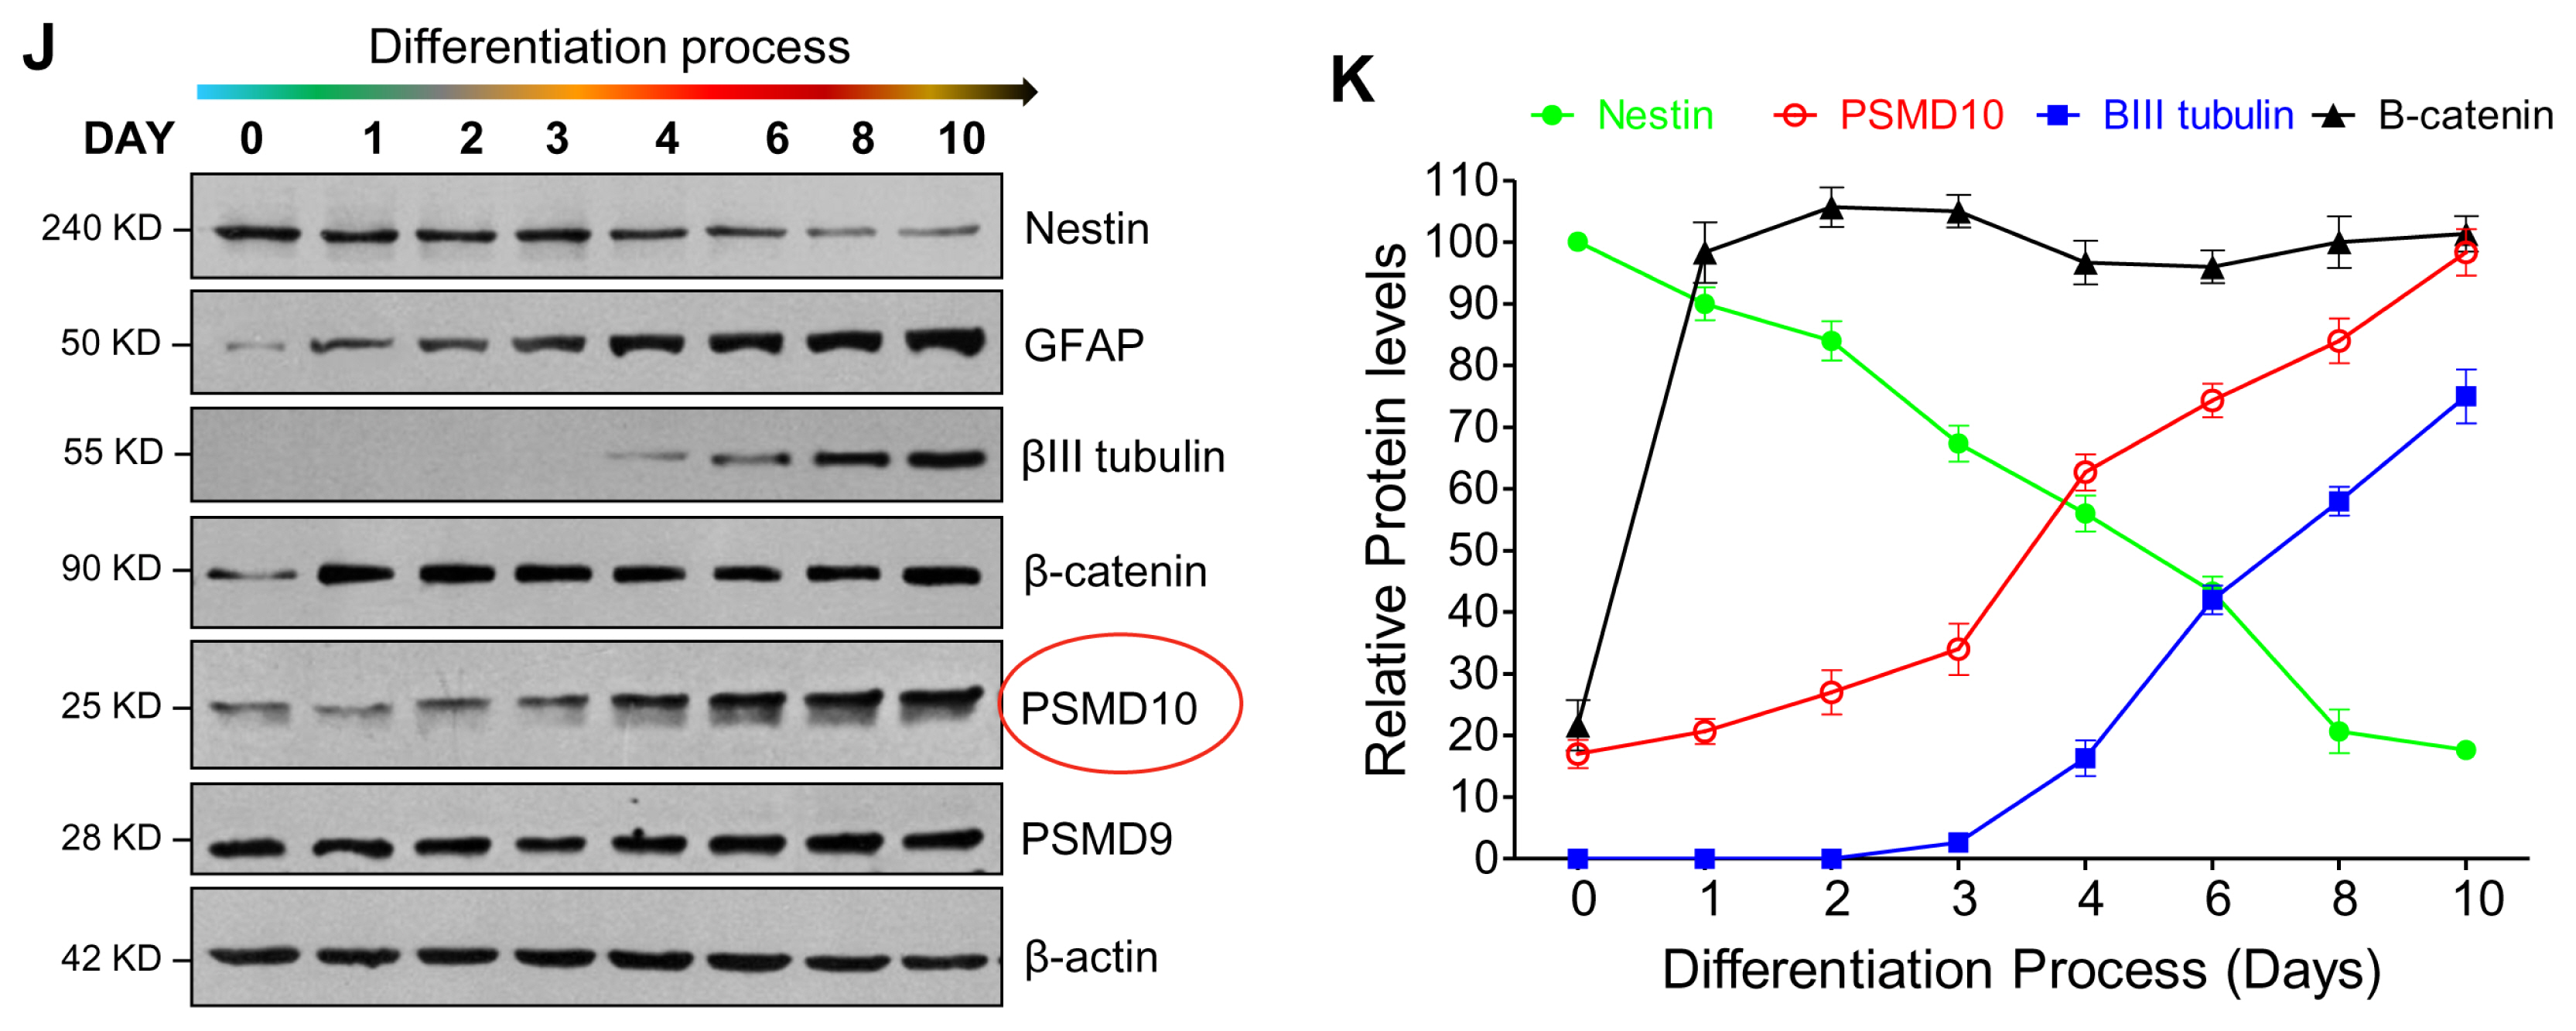
Fig. 3 PSMD10Gankyrin expression increases during the hNPCs differentiation process. (A) PSMD10Gankyrin Stable clone (P10 Over-Ex) in HEK293 cells were analyzed for PSMD10Gankyrin and β-catenin protein levels by western blot. (B) The graph shows the real-time PCR analyzed, significant increase in mRNA levels of β-catenin in the PSMD10Gankyrin overexpression clone with the error bar corresponding to the ±SEM of two independent experiments done in duplicates. GAPDH is used as loading control and for normalization. (C) PSMD10Gankyrin Stable clone and control HEK293 cells were transfected with TopFlash and renilla constructs at a ratio of 10 : 1 respectively and were lysed 48 hr post-transfection. Graph shows the average fold increase with ±SEM in β-catenin transcriptional activity normalized with renilla luciferase activity from two independent experiments done in duplicates. (D) HEK293 cells were transfected with PSMD10Gankyrin siRNA/control siRNA and were grown for 48 hr then RNA was isolated. The three graphs show the real-time PCR analyzed significant decrease in mRNA levels of PSMD10Gankyrin, β-catenin and Nrg1 with the error bar corresponding to the ±SEM of duplicate experiments. GAPDH is used as loading control and for normalization. (E) HEK293 cells were transfected with PSMD10Gankyrin siRNA/control siRNA, incubated for 48 hr and then transfected with TopFlash and renilla construct at a ratio of 10 : 1 respectively and were lysed 24 hr post-transfection. Graph shows the average fold change with ±SEM in β-catenin transcriptional activity normalized with renilla luciferase activity from duplicate experiments. (F) Neural Progenitor cells grown on laminin coated plates to ~80% confluence were differentiated as described in Fig. 2 with a minor change; differentiation was stopped at day 10. WB images of cell lysates of hNPCs and differentiated cells show expression of PSMD10Gankyrin and β-catenin in the progenitor cells (UD) and differentiated cells (DF). (G) Semi-Q PCR gel image shows the mRNA levels of PSMD10Gankyrin and Ngn1 in the above mentioned progenitor cells (UD) and differentiated cells (DF). (H) Graphs represents mRNA levels of Ngn1 and Nrg1 in the progenitor cells (UD) and differentiated cells (DF) measured by the Real-time PCR. Data represents the average fold increase of mRNA levels (normalized with GAPDH) of three independent experiments with ±SEM. (I) Phase-contrast images show day wise differentiation status of the hNPCs. (J) Cells at each day of differentiation were collected, lysed and analyzed by western blot using antibodies mentioned in the figure. (K) Line graphs show the expression levels of various proteins from Fig. 3J at each day during the differentiation process. Data represents the average protein levels of two independent (biological repeat) experiments.
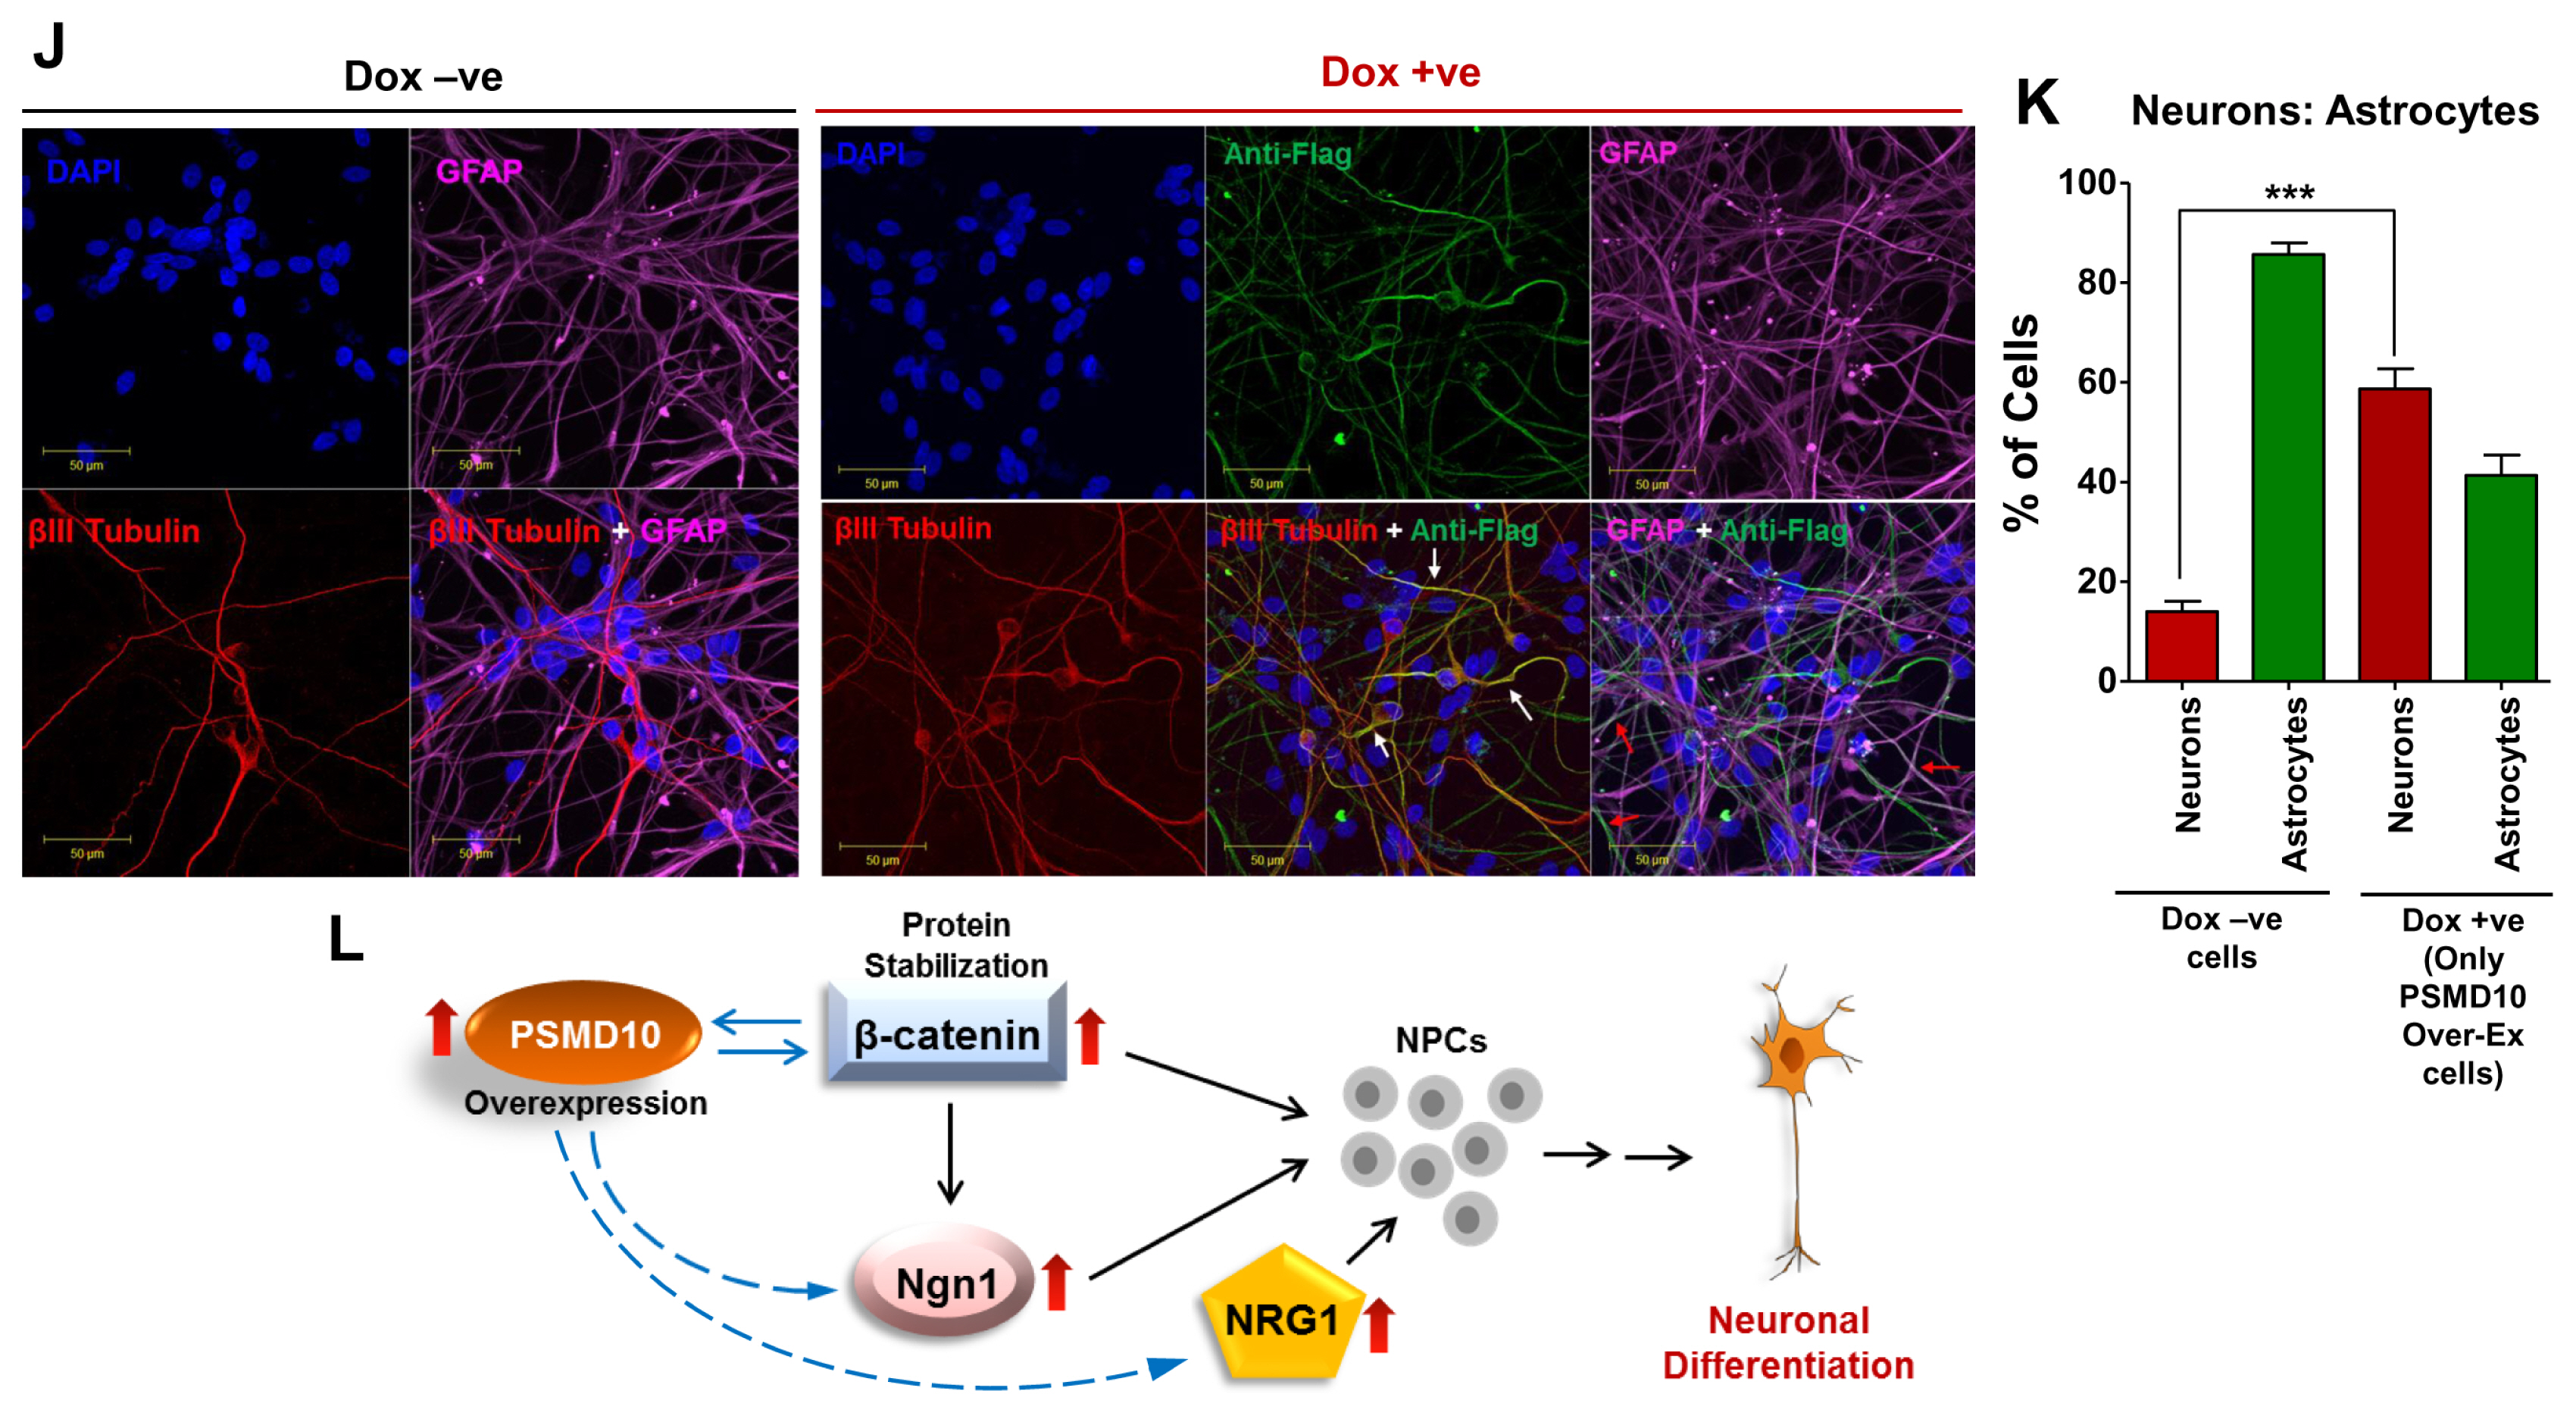
Fig. 4 PSMD10Gankyrin overexpression in hNPCs facilitate neuronal differentiation process. hNPCs were grown on laminin coated glass coverslips till they reached ~30% confluency. Then cells were transduced with virus particles carrying pTRIPZ-3XFlag- PSMD10Gankyrin and cells were either treated with doxycycline (1 μg/mL) for 48 hr or left untreated. Once ~80% confluency was reached, media was replaced with fresh differentiation media. Subsequently, differentiation media was replaced every alternate day and contained doxycycline (1 μg/mL) or no doxycycline until the 12th day of differentiation. (A) Cells were immunostained using β-III tubulin antibody (in red) following the protocol described in materials and methods. DAPI (in blue) was used for nuclear staining. (B) The bar graph represents the fold increase in the number of neurons differentiated from hNPCs with/without overexpression of Flag-P10 in the total pool of hNPCs. Data represents average number of cells from two independent experiments (in fold increase) each from 10 different fields (10×2=20 microscopic fields). (C) WB image of the above cells shows levels of β-III tubulin and β-catenin. (D) The bar graph shows the average fold increase with ±SEM in β-catenin protein levels in differentiated hNPCs (DF) treated with/without Doxycycline. β-actin was used as loading control and for normalization. (E) Semi-Q PCR gel image shows the mRNA levels of PSMD10Gankyrin and Ngn1 in the progenitor cells (Dox-ve UD) and differentiated cells (Dox-ve DF & Dox + ve DF). (F) The realtime-PCR bar graph represents the mRNA levels of Ngn1 in the differentiated cells (cont-DF & Flag-P10 DF). Data represents the average fold increase of mRNA levels (normalized with GAPDH) of three independent experiments. (G) hNPCs cells were either treated with Doxycycline and/or 10 ng/mL NT3 or left untreated during the differentiation process (for 10 days) and cell lysates were prepared for WB. Image shows levels of β-III tubulin, β-catenin and FLAG- PSMD10. (H) The bar graph shows the protein level quantification of GFAP and β-III tubulin with average value ±SEM from three different experiments with experimental set-up explained in Panel-I. β-actin was used as loading control and for normalization. (I) Model figure represents the workflow for tracing hNPCs fate after PSMD10Gankyrin overexpression. (J) Immunofluorescence was performed in above cells treated with/without Doxycycline; following the protocol described in materials and methods. In Dox + ve staining, cells (white arrow marked) expressing Flag-PSMD10Gankyrin (green) also stain for β-III tubulin (red). They are GFAP negative (purple). Cells (red arrow marked) expressing Flag-PSMD10Gankyrin (green) also stain for GFAP (purple). (K) Bar graph represents the percentage of neurons and astrocytes differentiated from hNPCs without and with (Dox treatment) overexpression of Flag-PSMD10Gankyrin. For Dox + ve set those cells which expressed Flag-PSMD10Gankyrin were only considered for neuron and astrocyte count. Data represents the average number of cells (in percentage) from three independent experiments, with data collected from 10 fields in each case (10×3=30 microscopic fields). (L) Model figure based on previously reported role of Ngn1 and results from the current study shows the probable role of PSMD10Gankyrin in hNPCs differentiation via β-catenin Ngn1 pathway.
Reference
-
References
1. Hori T, Kato S, Saeki M, DeMartino GN, Slaughter CA, Takeuchi J, Toh-e A, Tanaka K. cDNA cloning and functional analysis of p28 (Nas6p) and p40.5 (Nas7p), two novel regulatory subunits of the 26S proteasome. Gene. 1998; 216:113–122. DOI: 10.1016/S0378-1119(98)00309-6. PMID: 9714768.
Article2. Wang X, Jiang B, Zhang Y. Gankyrin regulates cell signaling network. Tumour Biol. 2016; 37:5675–5682. DOI: 10.1007/s13277-016-4854-z. PMID: 26819208.
Article3. Li H, Zhang J, Zhen C, Yang B, Feng L. Gankyrin as a potential target for tumor therapy: evidence and perspectives. Am J Transl Res. 2018; 10:1949–1960. PMID: 30093934. PMCID: PMC6079124.4. Li J, Mahajan A, Tsai MD. Ankyrin repeat: a unique motif mediating protein-protein interactions. Biochemistry. 2006; 45:15168–15178. DOI: 10.1021/bi062188q. PMID: 17176038.
Article5. Mosavi LK, Cammett TJ, Desrosiers DC, Peng ZY. The ankyrin repeat as molecular architecture for protein recognition. Protein Sci. 2004; 13:1435–1448. DOI: 10.1110/ps.03554604. PMID: 15152081. PMCID: PMC2279977.
Article6. Dawson S, Higashitsuji H, Wilkinson AJ, Fujita J, Mayer RJ. Gankyrin: a new oncoprotein and regulator of pRb and p53. Trends Cell Biol. 2006; 16:229–233. DOI: 10.1016/j.tcb.2006.03.001. PMID: 16581249.
Article7. Higashitsuji H, Liu Y, Mayer RJ, Fujita J. The oncoprotein gankyrin negatively regulates both p53 and RB by enhancing proteasomal degradation. Cell Cycle. 2005; 4:1335–1337. DOI: 10.4161/cc.4.10.2107. PMID: 16177571.
Article8. Bedford L, Paine S, Sheppard PW, Mayer RJ, Roelofs J. Assembly, structure, and function of the 26S proteasome. Trends Cell Biol. 2010; 20:391–401. DOI: 10.1016/j.tcb.2010.03.007. PMID: 20427185. PMCID: PMC2902798.
Article9. Chen Y, Li HH, Fu J, Wang XF, Ren YB, Dong LW, Tang SH, Liu SQ, Wu MC, Wang HY. Oncoprotein p28 GANK binds to RelA and retains NF-kappaB in the cytoplasm through nuclear export. Cell Res. 2007; 17:1020–1029. DOI: 10.1038/cr.2007.99. PMID: 18040287.
Article10. Dong LW, Yang GZ, Pan YF, Chen Y, Tan YX, Dai RY, Ren YB, Fu J, Wang HY. The oncoprotein p28GANK establishes a positive feedback loop in β-catenin signaling. Cell Res. 2011; 21:1248–1261. DOI: 10.1038/cr.2011.103. PMID: 21691299. PMCID: PMC3193485.
Article11. Nanaware PP, Ramteke MP, Somavarapu AK, Venkatraman P. Discovery of multiple interacting partners of gankyrin, a proteasomal chaperone and an oncoprotein--evidence for a common hot spot site at the interface and its functional relevance. Proteins. 2014; 82:1283–1300. DOI: 10.1002/prot.24494. PMID: 24338975.
Article12. Banerjee SJ, Sinha S, Roy S. Slow poisoning and destruction of networks: edge proximity and its implications for biological and infrastructure networks. Phys Rev E Stat Nonlin Soft Matter Phys. 2015; 91:022807. DOI: 10.1103/PhysRevE.91.022807. PMID: 25768552.
Article13. Subramanian A, Tamayo P, Mootha VK, Mukherjee S, Ebert BL, Gillette MA, Paulovich A, Pomeroy SL, Golub TR, Lander ES, Mesirov JP. Gene set enrichment analysis: a knowledge-based approach for interpreting genome-wide expression profiles. Proc Natl Acad Sci U S A. 2005; 102:15545–15550. DOI: 10.1073/pnas.0506580102. PMID: 16199517. PMCID: PMC1239896.
Article14. Huang da W, Sherman BT, Lempicki RA. Systematic and integrative analysis of large gene lists using DAVID bioinformatics resources. Nat Protoc. 2009; 4:44–57. DOI: 10.1038/nprot.2008.211. PMID: 19131956.
Article15. Huang da W, Sherman BT, Lempicki RA. Bioinformatics enrichment tools: paths toward the comprehensive functional analysis of large gene lists. Nucleic Acids Res. 2009; 37:1–13. DOI: 10.1093/nar/gkn923. PMID: 19033363. PMCID: PMC2615629.
Article16. Sun Y, Nadal-Vicens M, Misono S, Lin MZ, Zubiaga A, Hua X, Fan G, Greenberg ME. Neurogenin promotes neurogenesis and inhibits glial differentiation by independent mechanisms. Cell. 2001; 104:365–376. DOI: 10.1016/S0092-8674(01)00224-0. PMID: 11239394.
Article17. Hirabayashi Y, Itoh Y, Tabata H, Nakajima K, Akiyama T, Masuyama N, Gotoh Y. The Wnt/beta-catenin pathway directs neuronal differentiation of cortical neural precursor cells. Development. 2004; 131:2791–2801. DOI: 10.1242/dev.01165. PMID: 15142975.
Article18. Sato T, Sato F, Kamezaki A, Sakaguchi K, Tanigome R, Kawakami K, Sehara-Fujisawa A. Neuregulin 1 type II-ErbB signaling promotes cell divisions generating neurons from neural progenitor cells in the developing zebrafish brain. PLoS One. 2015; 10:e0127360. DOI: 10.1371/journal.pone.0127360. PMID: 26001123. PMCID: PMC4441363.
Article19. Gambarotta G, Fregnan F, Gnavi S, Perroteau I. Neuregulin 1 role in Schwann cell regulation and potential applications to promote peripheral nerve regeneration. Int Rev Neurobiol. 2013; 108:223–256. DOI: 10.1016/B978-0-12-410499-0.00009-5. PMID: 24083437.
Article20. Mellodew K, Suhr R, Uwanogho DA, Reuter I, Lendahl U, Hodges H, Price J. Nestin expression is lost in a neural stem cell line through a mechanism involving the proteasome and Notch signalling. Brain Res Dev Brain Res. 2004; 151:13–23. DOI: 10.1016/j.devbrainres.2004.03.018. PMID: 15246688.
Article21. Sahu I, Sangith N, Ramteke M, Gadre R, Venkatraman P. A novel role for the proteasomal chaperone PSMD9 and hnRNPA1 in enhancing IκBα degradation and NF-κB activation - functional relevance of predicted PDZ domain-motif interaction. FEBS J. 2014; 281:2688–2709. DOI: 10.1111/febs.12814. PMID: 24720748.
Article
- Full Text Links
-
- Actions
-
Cited
- CITED
-
- Close
- Share
-
- Similar articles
-
- Functional characterization of human oncoprotein gankyrin in Zebrafish
- Neural Stem Cells and Ischemic Brain
- Neurogenesis and Regulation of Olfactory Epithelium
- Adult Neurogenesis in the Central and Peripheral Nervous Systems
- Nestin expressing progenitor cells during establishment of the neural retina and its vasculature
