Simultaneous Estimation of the Fat Fraction and Râ‚‚* Via Tâ‚‚*-Corrected 6-Echo Dixon Volumetric Interpolated Breath-hold Examination Imaging for Osteopenia and Osteoporosis Detection: Correlations with Sex, Age, and Menopause
- Affiliations
-
- 1Department of Radiology, Inje University College of Medicine, Busan Paik Hospital, Busan, Korea. sunjulee98@gmail.com
- 2Department of Radiology, Chonbuk National University Hospital, Jeonju, Korea.
- KMID: 2447070
- DOI: http://doi.org/10.3348/kjr.2018.0032
Abstract
OBJECTIVE
To investigate the relationships of T2 *-corrected 6-echo Dixon volumetric interpolated breath-hold examination (VIBE) imaging-based fat fraction (FF) and R2 * values with bone mineral density (BMD); determine their associations with sex, age, and menopause; and evaluate the diagnostic performance of the FF and R2 * for predicting osteopenia and osteoporosis.
MATERIALS AND METHODS
This study included 153 subjects who had undergone magnetic resonance (MR) imaging, including MR spectroscopy (MRS) and T2 *-corrected 6-echo Dixon VIBE imaging. The FF and R2 * were measured at the L4 vertebra. The male and female groups were divided into two subgroups according to age or menopause. Lin's concordance and Pearson's correlation coefficients, Bland-Altman 95% limits of agreement, and the area under the curve (AUC) were calculated.
RESULTS
The correlation between the spectroscopic and 6-echo Dixon VIBE imaging-based FF values was statistically significant for both readers (pc = 0.940 [reader 1], 0.908 [reader 2]; both p < 0.001). A small measurement bias was observed for the MRS-based FF for both readers (mean difference = −0.3% [reader 1], 0.1% [reader 2]). We found a moderate negative correlation between BMD and the FF (r = −0.411 [reader 1], −0.436 [reader 2]; both p <0.001) with younger men and premenopausal women showing higher correlations. R2 * and BMD were more significantly correlated in women than in men, and the highest correlation was observed in postmenopausal women (r = 0.626 [reader 1], 0.644 [reader 2]; both p < 0.001). For predicting osteopenia and osteoporosis, the FF had a higher AUC in men and R2 * had a higher AUC in women. The AUC for predicting osteoporosis was highest with a combination of the FF and R2 * in postmenopausal women (AUC = 0.872 [reader 1], 0.867 [reader 2]; both p < 0.001).
CONCLUSION
The FF and R2 * measured using T2 *-corrected 6-echo Dixon VIBE imaging can serve as predictors of osteopenia and osteoporosis. R2 * might be useful for predicting osteoporosis, especially in postmenopausal women.
MeSH Terms
Figure
-
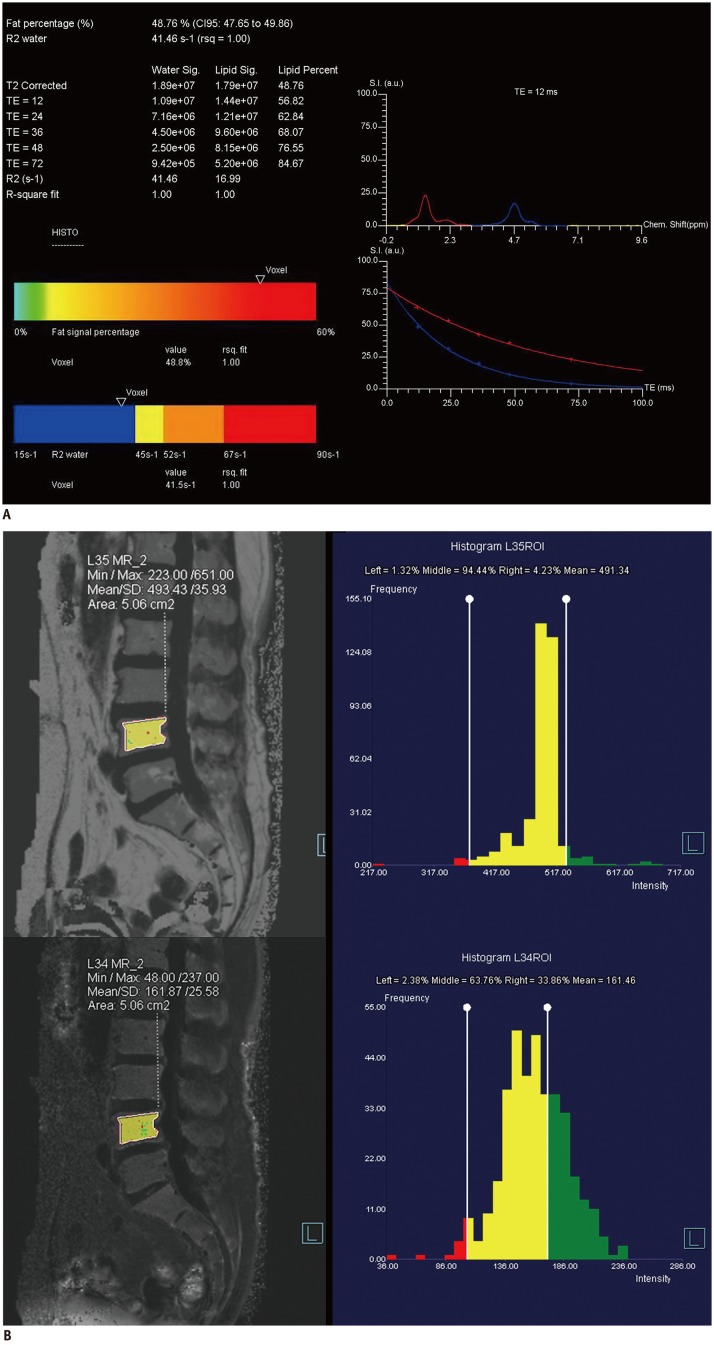
Fig. 1 71-year-old female subject with lower back pain.Screen-captured images of single-voxel T2-corrected multi-echo MRS (A) and T2*-corrected 6-echo Dixon VIBE imaging (B).A. FF of single-voxel HISTO MRS scan. Each water and fat integral at five echoes (TE = 12, 24, 36, 48, and 72 ms; top left) with estimated FF of 48.8% (bottom left). Water and fat spectral peaks at TE of 12 ms are shown. Red curve represents 1.3-ppm fat spectrum, and blue curve represents 4.7-ppm water spectrum (top right). Image on right shows T2 exponential decay curve. Chem. = chemical, CI = confidence interval, FF = fat fraction, HISTO = high-speed T2-corrected multi-echo, MRS = magnetic resonance spectroscopy, rsq = r-squared, S.I. (a.u.) = signal intensity (arbitrary units), TE = echo time, VIBE = volumetric interpolated breath-hold examination B. Measurement of FF and R2* at MR imaging workstation (Syngo software; Siemens Healthineers). Free-drawn polygonal ROIs was located at least 2 mm from endplate and excluded basivertebral plexus. ROIs were drawn on fat-only images (top left) and directly copied onto R2* map (bottom right). FF and R2* are displayed as histograms (right). FF = fat fraction, MR = magnetic resonance, MRS = magnetic resonance spectroscopy, ROI = region of interest, SD = standard deviation, VIBE = volumetric interpolated breath-hold examination
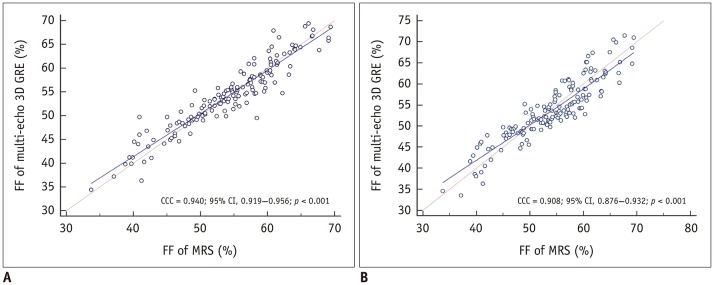
Fig. 2 Comparison between FF values measured with T2*-corrected 6-echo Dixon VIBE imaging and MRS at L4 vertebra.pc for assessment of agreement between FF values measured via MRS and T2*-corrected 6-echo Dixon VIBE imaging (reader 1, A; reader 2, B). Correlation between spectroscopic and T2*-corrected 6-echo Dixon VIBE-based FF values was statistically significant for readers 1 and 2 (both p < 0.001). pc values for readers 1 and 2 were 0.940 and 0.908, respectively. CCC = concordance correlation coefficient, GRE = gradient echo, 3D = three-dimensional
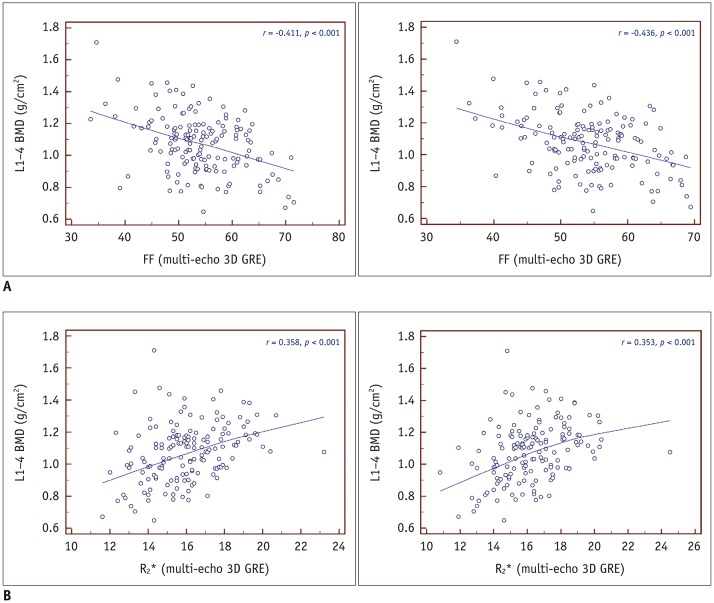
Fig. 3 Correlations between BMD and FF or R2*.A. Scatterplot displaying correlation between FF obtained via T2*-corrected 6-echo Dixon VIBE imaging and areal BMD (g/cm2; reader 1, A-left; reader 2, A-right). Moderate negative correlation between FF and areal BMD was found (r = −0.411 [reader 1], −0.436 [reader 2]; both p < 0.001). B. Scatterplot displaying correlation between R2* and areal BMD (g/cm2; reader 1, B-left; reader 2, B-right). Weak positive correlation between R2* and areal BMD was found (r = 0.358 [reader 1], 0.353 [reader 2]; both p <0.001). BMD = bone mineral density
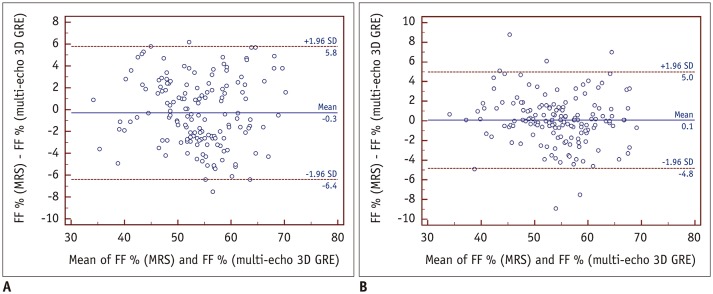
Fig. 4 Bland-Altman plots showing mean measurement bias with limits of agreement for FF derived from T2*-corrected 6-echo Dixon VIBE imaging relative to that measured with MRS.Mean measurement bias for reader 1 (A) was −0.3% (range, −6.4–5.8%), and mean measurement bias for reader 2 (B) was 0.1% (range, −4.8–5.0%). Mean bias is shown as solid line, and limits of agreement are shown as dashed lines.
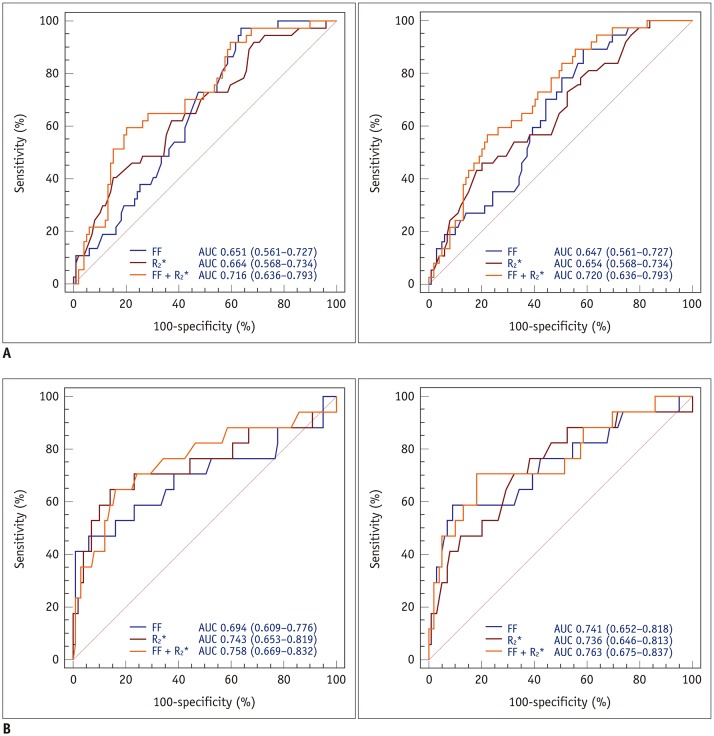
Fig. 5 Graphs showing ROC curves of readers 1 and 2 for predicting osteopenia (reader 1, A-left; reader 2, A-right) and osteoporosis (reader 1, B-left; reader 2, B-right) using FF, R2*, or combination of FF and R2*.ROC analysis demonstrated that combination of FF and R2* improved diagnostic performance for predicting osteopenia and osteoporosis for both readers. AUC = area under curve, ROC = receiver operating characteristic
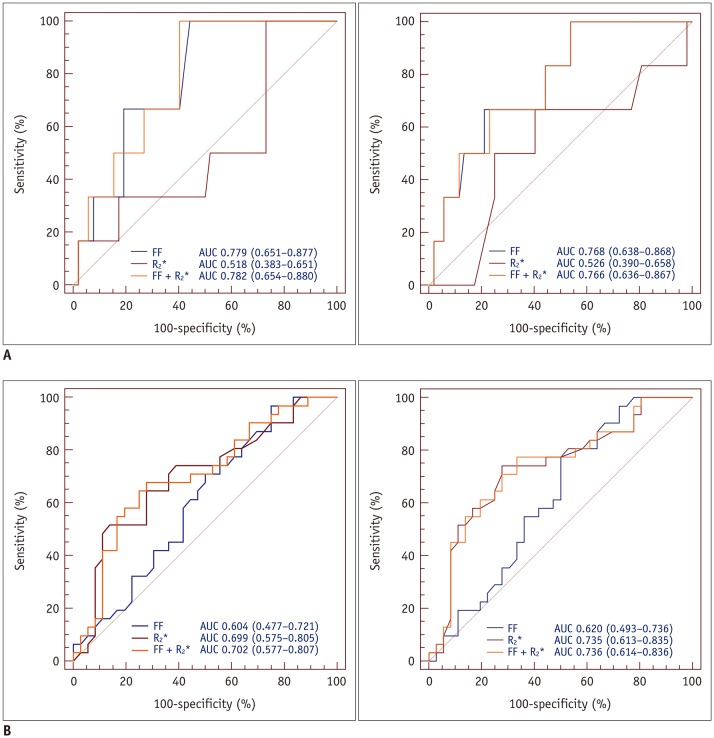
Fig. 6 ROC analysis of FF, R2*, and combination of FF and R2* for predicting osteopenia (reader 1, A-left; reader 2, A-right) and osteoporosis (reader 1, B-left; reader 2, B-right) in older men.ROC analysis demonstrated that AUCs for FF were higher than those for R2* for both readers. However, ROC curve showed only minor improvements in diagnostic performance for predicting osteopenia and osteoporosis.
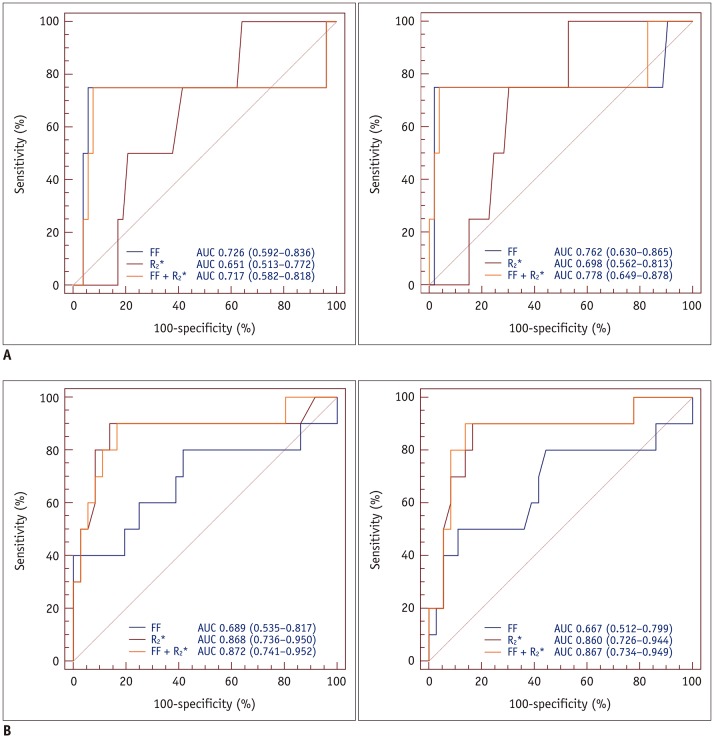
Fig. 7 ROC analysis of FF, R2*, and combination of FF and R2* for predicting osteopenia (reader 1, A-left; reader 2, A-right) and osteoporosis (reader 1, B-left; reader 2, B-right) in postmenopausal women.ROC analysis demonstrated that AUCs for R2* were excellent for both readers. However, there was no significant difference in AUCs between FF, R2*, and combination of FF and R2*.
Reference
-
1. Consensus Development Conference: diagnosis, prophylaxis and treatment of osteoporosis. Am J Med. 1993; 94:646–650. PMID: 8506892.2. Lane NE. Epidemiology, etiology, and diagnosis of osteoporosis. Am J Obstet Gynecol. 2006; 194(2 Suppl):S3–S11. PMID: 16448873.
Article3. Kanis JA, McCloskey EV, Johansson H, Oden A, Melton LJ 3rd, Khaltaev N. A reference standard for the description of osteoporosis. Bone. 2008; 42:467–475. PMID: 18180210.
Article4. Rosen CJ, Bouxsein ML. Mechanisms of disease: is osteoporosis the obesity of bone? Nat Clin Pract Rheumatol. 2006; 2:35–43. PMID: 16932650.
Article5. Bredella MA, Daley SM, Kalra MK, Brown JK, Miller KK, Torriani M. Marrow adipose tissue quantification of the lumbar spine by using dual-energy CT and single-voxel (1)H-MR spectroscopy: a feasibility study. Radiology. 2015; 277:230–235. PMID: 25988401.6. Gee CS, Nguyen JT, Marquez CJ, Heunis J, Lai A, Wyatt C, et al. Validation of bone marrow fat quantification in the presence of trabecular bone using MRI. J Magn Reson Imaging. 2015; 42:539–544. PMID: 25425074.
Article7. Karampinos DC, Melkus G, Baum T, Bauer JS, Rummeny EJ, Krug R. Bone marrow fat quantification in the presence of trabecular bone: initial comparison between water-fat imaging and single-voxel MRS. Magn Reson Med. 2014; 71:1158–1165. PMID: 23657998.
Article8. Li X, Kuo D, Schafer AL, Porzig A, Link TM, Black D, et al. Quantification of vertebral bone marrow fat content using 3 tesla MR spectroscopy: reproducibility, vertebral variation, and applications in osteoporosis. J Magn Reson Imaging. 2011; 33:974–979. PMID: 21448966.
Article9. Singhal V, Miller KK, Torriani M, Bredella MA. Short- and long-term reproducibility of marrow adipose tissue quantification by 1H-MR spectroscopy. Skeletal Radiol. 2016; 45:221–225. PMID: 26563561.
Article10. Yeung DKW, Griffith JF, Antonio GE, Lee FKH, Woo J, Leung PC. Osteoporosis is associated with increased marrow fat content and decreased marrow fat unsaturation: a proton MR spectroscopy study. J Magn Reson Imaging. 2005; 22:279–285. PMID: 16028245.
Article11. Griffith JF, Yeung DK, Antonio GE, Lee FK, Hong AW, Wong SY, et al. Vertebral bone mineral density, marrow perfusion, and fat content in healthy men and men with osteoporosis: dynamic contrast-enhanced MR imaging and MR spectroscopy. Radiology. 2005; 236:945–951. PMID: 16055699.
Article12. Griffith JF, Yeung DK, Antonio GE, Wong SY, Kwok TC, Woo J, et al. Vertebral marrow fat content and diffusion and perfusion indexes in women with varying bone density: MR evaluation. Radiology. 2006; 241:831–838. PMID: 17053202.
Article13. Shen W, Gong X, Weiss J, Jin Y. Comparison among T1-weighted magnetic resonance imaging, modified Dixon method, and magnetic resonance spectroscopy in measuring bone marrow fat. J Obes. 2013; 2013:298675. PMID: 23606951.
Article14. Li G, Xu Z, Gu H, Li X, Yuan W, Chang S, et al. Comparison of chemical shift-encoded water-fat MRI and MR spectroscopy in quantification of marrow fat in postmenopausal females. J Magn Reson Imaging. 2017; 45:66–73. PMID: 27341545.
Article15. Li GW, Xu Z, Chen QW, Tian YN, Wang XY, Zhou L, et al. Quantitative evaluation of vertebral marrow adipose tissue in postmenopausal female using MRI chemical shift-based water-fat separation. Clin Radiol. 2014; 69:254–262. PMID: 24286935.
Article16. Yoo HJ, Hong SH, Kim DH, Choi JY, Chae HD, Jeong BM, et al. Measurement of fat content in vertebral marrow using a modified dixon sequence to differentiate benign from malignant processes. J Magn Reson Imaging. 2017; 45:1534–1544. PMID: 27690264.
Article17. Le Ster C, Gambarota G, Lasbleiz J, Guillin R, Decaux O, Saint-Jalmes H. Breath-hold MR measurements of fat fraction, T1, and T2* of water and fat in vertebral bone marrow. J Magn Reson Imaging. 2016; 44:549–555. PMID: 26918280.18. Yu H, Shimakawa A, McKenzie CA, Brodsky E, Brittain JH, Reeder SB. Multiecho water-fat separation and simultaneous R2* estimation with multifrequency fat spectrum modeling. Magn Reson Med. 2008; 60:1122–1134. PMID: 18956464.19. Fischer MA, Nanz D, Shimakawa A, Schirmer T, Guggenberger R, Chhabra A, et al. Quantification of muscle fat in patients with low back pain: comparison of multi-echo MR imaging with single-voxel MR spectroscopy. Radiology. 2013; 266:555–563. PMID: 23143025.
Article20. Yoo YH, Kim HS, Lee YH, Yoon CS, Paek MY, Yoo H, et al. Comparison of multi-echo Dixon methods with volume interpolated breath-hold gradient echo magnetic resonance imaging in fat-signal fraction quantification of paravertebral muscle. Korean J Radiol. 2015; 16:1086–1095. PMID: 26357503.
Article21. Kühn JP, Hernando D, Muñoz del Rio A, Evert M, Kannengiessre S, Völzke H, et al. Effect of multipeak spectral modeling of fat for liver iron and fat quantification: correlation of biopsy with MR imaging results. Radiology. 2012; 265:133–142. PMID: 22923718.
Article22. Kühn JP, Hernando D, Meffert PJ, Reeder S, Hosten N, Laqua R, et al. Proton-density fat fraction and simultaneous R2* estimation as an MRI tool for assessment of osteoporosis. Eur Radiol. 2013; 23:3432–3439. PMID: 23812246.23. Koo TK, Li MY. A guideline of selecting and reporting intraclass correlation coefficients for reliability research. J Chiropr Med. 2016; 15:155–163. PMID: 27330520.
Article24. Lin LI. A concordance correlation coefficient to evaluate reproducibility. Biometrics. 1989; 45:255–268. PMID: 2720055.
Article25. Dancey CP, Reidy J. Statistics without maths for psychology. 5th ed. New York, NY: Pearson Prentice Hall;2011. p. 175–176.26. McCallum RS. Handbook of Nonverbal Assessment. 2nd ed. Cham: Springer;2017. p. 182.27. Schwartz AV, Sigurdsson S, Hue TF, Lang TF, Harris TB, Rosen CJ, et al. Vertebral bone marrow fat associated with lower trabecular BMD and prevalent vertebral fracture in older adults. J Clin Endocrinol Metab. 2013; 98:2294–2300. PMID: 23553860.
Article28. Ergen FB, Gulal G, Yildiz AE, Celik A, Karakaya J, Aydingoz U. Fat fraction estimation of the vertebrae in females using the T2*-IDEAL technique in detection of reduced bone mineralization level: comparison with bone mineral densitometry. J Comput Assist Tomogr. 2014; 38:320–324. PMID: 24378896.29. Shen W, Scherzer R, Gantz M, Chen J, Punyanitya M, Lewis CE, et al. Relationship between MRI-measured bone marrow adipose tissue and hip and spine bone mineral density in African-American and Caucasian participants: the CARDIA study. J Clin Endocrinol Metab. 2012; 97:1337–1346. PMID: 22319043.
Article30. Chung CB, Vande Berg BC, Tavernier T, Cotton A, Laredo JD, Vallee C, et al. End plate marrow changes in the asymptomatic lumbosacral spine: frequency, distribution and correlation with age and degenerative changes. Skeletal Radiol. 2004; 33:399–404. PMID: 15138721.
Article31. Karchevsky M, Schweitzer ME, Carrino JA, Zoga A, Montgomery D, Parker L. Reactive endplate marrow changes: a systematic morphologic and epidemiologic evaluation. Skeletal Radiol. 2005; 34:125–129. PMID: 15647940.
Article32. Wang YX, Griffith JF. Effect of menopause on lumbar disk degeneration: potential etiology. Radiology. 2010; 257:318–320. PMID: 20959546.
Article33. Teichtahl AJ, Urquhart DM, Wang Y, Wluka AE, O'Sullivan R, Jones G, et al. Lumbar disc degeneration is associated with modic change and high paraspinal fat content - a 3.0T magnetic resonance imaging study. BMC Musculoskelet Disord. 2016; 17:439. PMID: 27765024.
Article34. Teichtahl AJ, Urquhart DM, Wang Y, Wluka AE, O'Sullivan R, Jones G, et al. Modic changes in the lumbar spine and their association with body composition, fat distribution and intervertebral disc height - a 3.0 T-MRI study. BMC Musculoskelet Disord. 2016; 17:92. PMID: 26891686.
Article35. Li GW, Tang GY, Liu Y, Tang RB, Peng YF, Li W. MR spectroscopy and micro-CT in evaluation of osteoporosis model in rabbits: comparison with histopathology. Eur Radiol. 2012; 22:923–929. PMID: 22101829.
Article36. Kim DH, Yoo HJ, Hong SH, Choi JY, Chae HD, Chung BM. Differentiation of acute osteoporotic and malignant vertebral fractures by quantification of fat fraction with a Dixon MRI sequence. AJR Am J Roentgenol. 2017; 209:1331–1339. PMID: 28858543.
Article37. Rocha LA, Barreto DV, Barreto FC, Dias CB, Moysés R, Silva MR, et al. Serum ferritin level remains a reliable marker of bone marrow iron stores evaluated by histomorphometry in hemodialysis patients. Clin J Am Soc Nephrol. 2009; 4:105–109. PMID: 18842949.
Article38. Kim BJ, Lee SH, Koh JM, Kim GS. The association between higher serum ferritin level and lower bone mineral density is prominent in women ≥ 45 years of age (KNHANES 2008–2010). Osteoporos Int. 2013; 24:2627–2637. PMID: 23592044.39. Griffith JF, Yeung DK, Ma HT, Leung JC, Kwok TC, Leung PC. Bone marrow fat content in the elderly: a reversal of sex difference seen in younger subjects. J Magn Reson Imaging. 2012; 36:225–230. PMID: 22337076.
Article
- Full Text Links
-
- Actions
-
Cited
- CITED
-
- Close
- Share
-
- Similar articles
-
- Comparison of Multi-Echo Dixon Methods with Volume Interpolated Breath-Hold Gradient Echo Magnetic Resonance Imaging in Fat-Signal Fraction Quantification of Paravertebral Muscle
- Differentiation between Focal Malignant Marrow-Replacing Lesions and Benign Red Marrow Deposition of the Spine with T2*-Corrected Fat-Signal Fraction Map Using a Three-Echo Volume Interpolated Breath-Hold Gradient Echo Dixon Sequence
- Diagnosing Lung Nodules on Oncologic MR/PET Imaging: Comparison of Fast T1-Weighted Sequences and Influence of Image Acquisition in Inspiration and Expiration Breath-Hold
- Correlation Between Vertebral Marrow Fat Fraction Measured Using Dixon Quantitative Chemical Shift MRI and BMD Value on Dual-energy X-ray Absorptiometry
- Single breath-hold MR imaging of liver
