Comparison of Multi-Echo Dixon Methods with Volume Interpolated Breath-Hold Gradient Echo Magnetic Resonance Imaging in Fat-Signal Fraction Quantification of Paravertebral Muscle
- Affiliations
-
- 1Department of Radiology, Gangnam Severance Hospital, Yonsei University College of Medicine, Seoul 06273, Korea. agn70@yuhs.ac
- 2Department of Orthopedic Surgery, Gangnam Severance Hospital, Yonsei University College of Medicine, Seoul 06273, Korea.
- 3Department of Radiology, Severance Hospital, Yonsei University College of Medicine, Seoul 03722, Korea.
- 4Healthcare Sector, Siemens Ltd., Seoul 03737, Korea.
- 5Biostatistics Collaboration Lab, Yonsei University College of Medicine, Seoul 03722, Korea.
- 6Healthcare Sector, Siemens AG, Erlangen 91052, Germany.
- KMID: 2160776
- DOI: http://doi.org/10.3348/kjr.2015.16.5.1086
Abstract
OBJECTIVE
To assess whether multi-echo Dixon magnetic resonance (MR) imaging with simultaneous T2* estimation and correction yields more accurate fat-signal fraction (FF) measurement of the lumbar paravertebral muscles, in comparison with non-T2*-corrected two-echo Dixon or T2*-corrected three-echo Dixon, using the FF measurements from single-voxel MR spectroscopy as the reference standard.
MATERIALS AND METHODS
Sixty patients with low back pain underwent MR imaging with a 1.5T scanner. FF mapping images automatically obtained using T2*-corrected Dixon technique with two (non-T2*-corrected), three, and six echoes, were compared with images from single-voxel MR spectroscopy at the paravertebral muscles on levels L4 through L5. FFs were measured directly by two radiologists, who independently drew the region of interest on the mapping images from the three sequences.
RESULTS
A total of 117 spectroscopic measurements were performed either bilaterally (57 of 60 subjects) or unilaterally (3 of 60 subjects). The mean spectroscopic FF was 14.3 +/- 11.7% (range, 1.9-63.7%). Interobserver agreement was excellent between the two radiologists. Lin's concordance correlation between the spectroscopic findings and all the imaging-based FFs were statistically significant (p < 0.001). FFs obtained from the T2*-corrected six-echo Dixon sequences showed a significantly better concordance with the spectroscopic data, with its concordance correlation coefficient being 0.99 and 0.98 (p < 0.001), as compared with two- or three-echo methods.
CONCLUSION
T2*-corrected six-echo Dixon sequence would be a better option than two- or three-echo methods for noninvasive quantification of lumbar muscle fat quantification.
Keyword
MeSH Terms
Figure
-
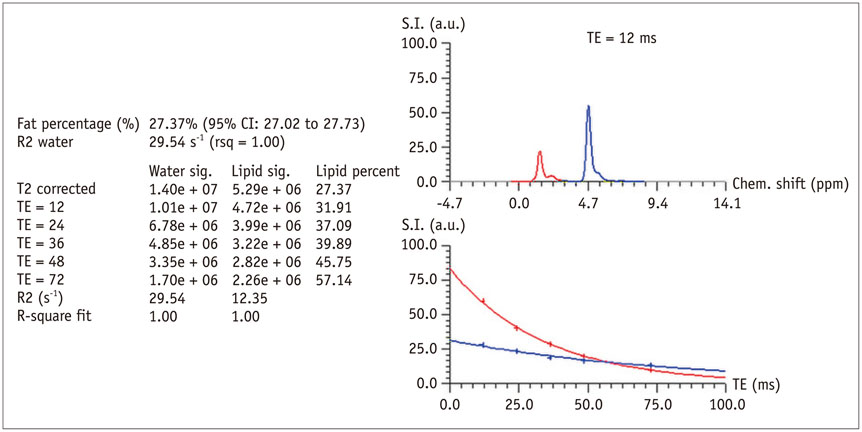
Fig. 1 T2-corrected single-voxel multi-echo 1H MR spectroscopy (MRS). Screen-captured image of T2-corrected single-voxel multi-echo 1H MRS result from 62-year-old female subject. Data on left includes five water and fat integrals at each measured echo (TE = 12, 24, 36, 48, and 72 ms) and estimated fat-signal fraction was 27.4%. Image on top right shows representative water and fat spectral peaks, which were measured at TE of 12 ms. Image on bottom left shows T2 exponential decay. CI = confidence interval, TE = echo time
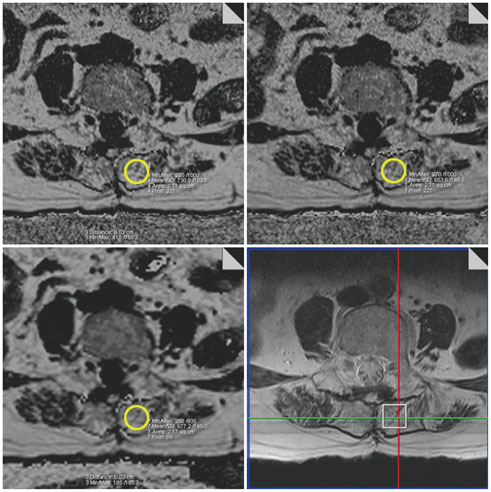
Fig. 2 Region of interest (ROI) placement from mapping images. Example of screen-captured image of ROI placement from mapping images, obtained from 68-year-old male subject. ROI was drawn on mapping image from non-T2*-corrected two-echo volume interpolated breath-hold gradient-echo Dixon (VIBE-Dixon) sequence (top left) at same location of spectroscopic voxel referring to captured image (bottom right) obtained while placing voxel in each MR imaging. This was then copied and pasted to other mapping images from T2*-corrected three-echo VIBE-Dixon sequence (top right) and T2*-corrected six-echo VIBE-Dixon sequence (bottom right). Diameter of circular ROI was fixed at 15 mm, based on voxel size of MR spectroscopy. For precise representative data acquisition embracing entire voxel area, ROIs were drawn at three consecutive slices of mapping images in same manner as stated above. As result, three ROI measurements from three fat-signal fraction pulse sequences were obtained for every voxel location.

Fig. 3 Concordance correlation coefficient (CCC) of fat-signal fraction (FF) between MR spectroscopy (MRS) and mapping image measurements. Concordance correlation coefficient for assessment of agreement between MRS and mapping image measurements obtained from FF maps using non-T2*-corrected two-echo VIBE-Dixon sequence (Observer A, A-1; Observer B, B-1), T2*-corrected three-echo Dixon sequence (Observer A, A-2; Observer B, B-2), T2*-corrected six-echo VIBE-Dixon sequence (Observer A, A-3; Observer B, B-3) in each observer. Correlation of FFs between all mapping images and spectroscopic data was statistically significant in each observer (p < 0.001). CCC was 0.93 for two-echo VIBE-Dixon, 0.94 for three-echo VIBE-Dixon, 0.99 for six-echo VIBE-Dixon pulse sequence in observer A, and was 0.94 for two-echo VIBE-Dixon, 0.93 for three-echo VIBE-Dixon, and 0.98 for six-echo VIBE-Dixon pulse sequence in observer B. FF of two-echo = FF obtained from non-T2*-corrected two-echo VIBE-Dixon sequence, FF of three-echo = FF obtained from T2*-corrected three-echo VIBE-Dixon sequence, FF of six-echo = FF obtained from T2*-corrected six-echo VIBE-Dixon sequence, FF of MRS = FF obtained from MR spectroscopy, VIBE-Dixon = volume interpolated breath-hold gradient-echo Dixon
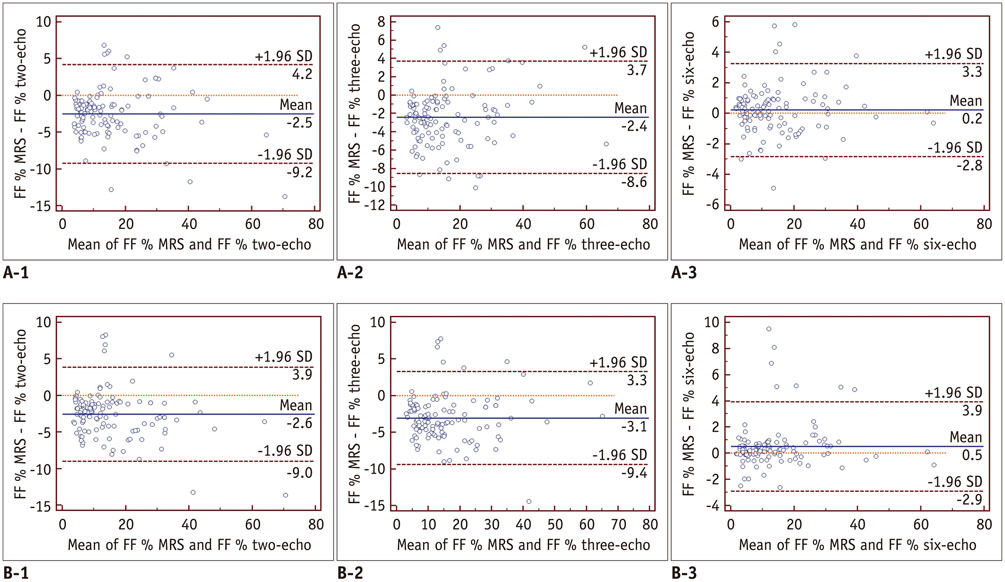
Fig. 4 Bland-Altman plots for assessment of agreement of fat-signal fraction (FF) between MR spectroscopy (MRS) and mapping image measurements. Bland-Altman plot shows mean measurement bias with limits of agreement of FFs, obtained from FF maps using non-T2*-corrected two-echo volume interpolated breath-hold gradient-echo (VIBE-Dixon) sequence (Observer A, A-1; Observer B, B-1), T2*-corrected three-echo VIBE-Dixon sequence (Observer A, A-2; Observer B, B-2), and T2*-corrected six-echo VIBE-Dixon sequence (Observer A, A-3; Observer B, B-3) in relation to FFs measured with MRS. Narrow range of limits of agreement was seen in T2*-corrected six-echo VIBE-Dixon as compared with other sequences in each observer. FF % two-echo = FF obtained from non-T2*-corrected two-echo VIBE-Dixon sequence, FF % three-echo = FF obtained from T2*-corrected three-echo VIBE-Dixon sequence, FF % six-echo = FF obtained from T2*-corrected six-echo VIBE-Dixon sequence, FF % MRS = FF obtained from MR spectroscopy, SD = standard deviation
Cited by 3 articles
-
The Association between the Magnetic Resonance Imaging Findings of Adhesive Capsulitis and Shoulder Muscle Fat Quantification Using a Multi-Echo Dixon Method
Min A Yoon, Suk-Joo Hong, Sun Hong, Chang Ho Kang, Baek Hyun Kim, In Seong Kim
Korean J Radiol. 2018;19(1):63-71. doi: 10.3348/kjr.2018.19.1.63.Fat Quantification in the Vertebral Body: Comparison of Modified Dixon Technique with Single-Voxel Magnetic Resonance Spectroscopy
Sang Hyup Lee, Hye Jin Yoo, Seung-Man Yu, Sung Hwan Hong, Ja-Young Choi, Hee Dong Chae
Korean J Radiol. 2019;20(1):126-133. doi: 10.3348/kjr.2018.0174.Simultaneous Estimation of the Fat Fraction and R2* Via T2*-Corrected 6-Echo Dixon Volumetric Interpolated Breath-hold Examination Imaging for Osteopenia and Osteoporosis Detection: Correlations with Sex, Age, and Menopause
Donghyun Kim, Sung Kwan Kim, Sun Joo Lee, Hye Jung Choo, Jung Won Park, Kun Yung Kim
Korean J Radiol. 2019;20(6):916-930. doi: 10.3348/kjr.2018.0032.
Reference
-
1. Freeman MD, Woodham MA, Woodham AW. The role of the lumbar multifidus in chronic low back pain: a review. PM R. 2010; 2:142–146. quiz 1 p following 1672. Kjaer P, Bendix T, Sorensen JS, Korsholm L, Leboeuf-Yde C. Are MRI-defined fat infiltrations in the multifidus muscles associated with low back pain? BMC Med. 2007; 5:2.3. Mengiardi B, Schmid MR, Boos N, Pfirrmann CW, Brunner F, Elfering A, et al. Fat content of lumbar paraspinal muscles in patients with chronic low back pain and in asymptomatic volunteers: quantification with MR spectroscopy. Radiology. 2006; 240:786–792.4. Mannion AF. Fibre type characteristics and function of the human paraspinal muscles: normal values and changes in association with low back pain. J Electromyogr Kinesiol. 1999; 9:363–377.5. Hebert JJ, Marcus RL, Koppenhaver SL, Fritz JM. Postoperative rehabilitation following lumbar discectomy with quantification of trunk muscle morphology and function: a case report and review of the literature. J Orthop Sports Phys Ther. 2010; 40:402–412.6. Chan ST, Fung PK, Ng NY, Ngan TL, Chong MY, Tang CN, et al. Dynamic changes of elasticity, cross-sectional area, and fat infiltration of multifidus at different postures in men with chronic low back pain. Spine J. 2012; 12:381–388.7. Cruz-Jentoft AJ, Baeyens JP, Bauer JM, Boirie Y, Cederholm T, Landi F, et al. Sarcopenia: European consensus on definition and diagnosis: Report of the European Working Group on Sarcopenia in Older People. Age Ageing. 2010; 39:412–423.8. Dufour AB, Hannan MT, Murabito JM, Kiel DP, McLean RR. Sarcopenia definitions considering body size and fat mass are associated with mobility limitations: the Framingham Study. J Gerontol A Biol Sci Med Sci. 2013; 68:168–174.9. Pineda-Alonso N, Xu Q, Sharma P, Martin D, Hu X. High speed multiple echo acquisition (HISTO): a rapid and simultaneous assessment of fat and iron content in liver by 1HMRS. Proc Intl Soc Mag Reson Med. 2008; 16:3699.10. Brix G, Heiland S, Bellemann ME, Koch T, Lorenz WJ. MR imaging of fat-containing tissues: valuation of two quantitative imaging techniques in comparison with localized proton spectroscopy. Magn Reson Imaging. 1993; 11:977–991.11. Kim H, Taksali SE, Dufour S, Befroy D, Goodman TR, Petersen KF, et al. Comparative MR study of hepatic fat quantification using single-voxel proton spectroscopy, two-point dixon and three-point IDEAL. Magn Reson Med. 2008; 59:521–527.12. Nardo L, Karampinos DC, Lansdown DA, Carballido-Gamio J, Lee S, Maroldi R, et al. Quantitative assessment of fat infiltration in the rotator cuff muscles using water-fat MRI. J Magn Reson Imaging. 2014; 39:1178–1185.13. Karampinos DC, Melkus G, Baum T, Bauer JS, Rummeny EJ, Krug R. Bone marrow fat quantification in the presence of trabecular bone: initial comparison between water-fat imaging and single-voxel MRS. Magn Reson Med. 2014; 71:1158–1165.14. Bley TA, Wieben O, François CJ, Brittain JH, Reeder SB. Fat and water magnetic resonance imaging. J Magn Reson Imaging. 2010; 31:4–18.15. Berglund J, Ahlström H, Johansson L, Kullberg J. Two-point dixon method with flexible echo times. Magn Reson Med. 2011; 65:994–1004.16. Fischer MA, Nanz D, Reiner CS, Montani M, Breitenstein S, Leschka S, et al. Diagnostic performance and accuracy of 3-D spoiled gradient-dual-echo MRI with water- and fat-signal separation in liver-fat quantification: comparison to liver biopsy. Invest Radiol. 2010; 45:465–470.17. Bernard CP, Liney GP, Manton DJ, Turnbull LW, Langton CM. Comparison of fat quantification methods: a phantom study at 3.0T. J Magn Reson Imaging. 2008; 27:192–197.18. Hayashi N, Miyati T, Minami T, Takeshita Y, Ryu Y, Matsuda T, et al. Quantitative analysis of hepatic fat fraction by single-breath-holding MR spectroscopy with T2 correction: phantom and clinical study with histologic assessment. Radiol Phys Technol. 2013; 6:219–225.19. Gaeta M, Scribano E, Mileto A, Mazziotti S, Rodolico C, Toscano A, et al. Muscle fat fraction in neuromuscular disorders: dual-echo dual-flip-angle spoiled gradient-recalled MR imaging technique for quantification--a feasibility study. Radiology. 2011; 259:487–494.20. Yu H, McKenzie CA, Shimakawa A, Vu AT, Brau AC, Beatty PJ, et al. Multiecho reconstruction for simultaneous water-fat decomposition and T2* estimation. J Magn Reson Imaging. 2007; 26:1153–1161.21. Elliott JM, Walton DM, Rademaker A, Parrish TB. Quantification of cervical spine muscle fat: a comparison between T1-weighted and multi-echo gradient echo imaging using a variable projection algorithm (VARPRO). BMC Med Imaging. 2013; 13:30.22. Horng DE, Hernando D, Hines CD, Reeder SB. Comparison of R2* correction methods for accurate fat quantification in fatty liver. J Magn Reson Imaging. 2013; 37:414–422.23. Koelblinger C, Krššák M, Maresch J, Wrba F, Kaczirek K, Gruenberger T, et al. Hepatic steatosis assessment with 1H-spectroscopy and chemical shift imaging at 3.0 T before hepatic surgery: reliable enough for making clinical decisions? Eur J Radiol. 2012; 81:2990–2995.24. Zhong X, Nickel MD, Kannengiesser SA, Dale BM, Kiefer B, Bashir MR. Liver fat quantification using a multi-step adaptive fitting approach with multi-echo GRE imaging. Magn Reson Med. 2014; 72:1353–1365.25. Wokke BH, Bos C, Reijnierse M, van Rijswijk CS, Eggers H, Webb A, et al. Comparison of dixon and T1-weighted MR methods to assess the degree of fat infiltration in duchenne muscular dystrophy patients. J Magn Reson Imaging. 2013; 38:619–624.26. Liu CY, McKenzie CA, Yu H, Brittain JH, Reeder SB. Fat quantification with IDEAL gradient echo imaging: correction of bias from T(1) and noise. Magn Reson Med. 2007; 58:354–364.27. Ropponen A, Videman T, Battié MC. The reliability of paraspinal muscles composition measurements using routine spine MRI and their association with back function. Man Ther. 2008; 13:349–356.28. Lee SJ, Janssen I, Heymsfield SB, Ross R. Relation between whole-body and regional measures of human skeletal muscle. Am J Clin Nutr. 2004; 80:1215–1221.29. Rosner B. Fundamentals of biostatistics. 6th ed. Boston: Duxbury Press;2005.30. Lin LI. A concordance correlation coefficient to evaluate reproducibility. Biometrics. 1989; 45:255–268.31. Dewitte K, Fierens C, Stöckl D, Thienpont LM. Application of the Bland-Altman plot for interpretation of method-comparison studies: a critical investigation of its practice. Clin Chem. 2002; 48:799–801. author reply 801-80232. Lee YH, Kim S, Lim D, Song HT, Suh JS. MR Quantification of the Fatty Fraction from T2*-corrected Dixon Fat/Water Separation Volume-interpolated Breathhold Examination (VIBE) in the Assessment of Muscle Atrophy in Rotator Cuff Tears. Acad Radiol. 2015; 22:909–917.33. Fischer MA, Nanz D, Shimakawa A, Schirmer T, Guggenberger R, Chhabra A, et al. Quantification of muscle fat in patients with low back pain: comparison of multi-echo MR imaging with single-voxel MR spectroscopy. Radiology. 2013; 266:555–563.34. Yokoo T, Shiehmorteza M, Hamilton G, Wolfson T, Schroeder ME, Middleton MS, et al. Estimation of hepatic proton-density fat fraction by using MR imaging at 3.0 T. Radiology. 2011; 258:749–759.35. Cassidy FH, Yokoo T, Aganovic L, Hanna RF, Bydder M, Middleton MS, et al. Fatty liver disease: MR imaging techniques for the detection and quantification of liver steatosis. Radiographics. 2009; 29:231–260.36. Bydder M, Yokoo T, Hamilton G, Middleton MS, Chavez AD, Schwimmer JB, et al. Relaxation effects in the quantification of fat using gradient echo imaging. Magn Reson Imaging. 2008; 26:347–359.37. Hines CD, Yu H, Shimakawa A, McKenzie CA, Brittain JH, Reeder SB. T1 independent, T2* corrected MRI with accurate spectral modeling for quantification of fat: validation in a fat-water-SPIO phantom. J Magn Reson Imaging. 2009; 30:1215–1222.38. Kang BK, Yu ES, Lee SS, Lee Y, Kim N, Sirlin CB, et al. Hepatic fat quantification: a prospective comparison of magnetic resonance spectroscopy and analysis methods for chemical-shift gradient echo magnetic resonance imaging with histologic assessment as the reference standard. Invest Radiol. 2012; 47:368–375.39. Westphalen AC, Qayyum A, Yeh BM, Merriman RB, Lee JA, Lamba A, et al. Liver fat: effect of hepatic iron deposition on evaluation with opposed-phase MR imaging. Radiology. 2007; 242:450–455.40. Beard JL. Iron biology in immune function, muscle metabolism and neuronal functioning. J Nutr. 2001; 131(2S-2):568S–579S. discussion 580S41. Kondo H, Miura M, Kodama J, Ahmed SM, Itokawa Y. Role of iron in oxidative stress in skeletal muscle atrophied by immobilization. Pflugers Arch. 1992; 421:295–297.42. Hofer T, Marzetti E, Xu J, Seo AY, Gulec S, Knutson MD, et al. Increased iron content and RNA oxidative damage in skeletal muscle with aging and disuse atrophy. Exp Gerontol. 2008; 43:563–570.43. Brown SH, Gregory DE, Carr JA, Ward SR, Masuda K, Lieber RL. ISSLS prize winner: adaptations to the multifidus muscle in response to experimentally induced intervertebral disc degeneration. Spine (Phila Pa 1976). 2011; 36:1728–1736.44. Reeder SB, Robson PM, Yu H, Shimakawa A, Hines CD, McKenzie CA, et al. Quantification of hepatic steatosis with MRI: the effects of accurate fat spectral modeling. J Magn Reson Imaging. 2009; 29:1332–1339.
- Full Text Links
-
- Actions
-
Cited
- CITED
-
- Close
- Share
-
- Similar articles
-
- Differentiation between Focal Malignant Marrow-Replacing Lesions and Benign Red Marrow Deposition of the Spine with T2*-Corrected Fat-Signal Fraction Map Using a Three-Echo Volume Interpolated Breath-Hold Gradient Echo Dixon Sequence
- Single breath-hold MR imaging of liver
- Simultaneous Estimation of the Fat Fraction and Râ‚‚* Via Tâ‚‚*-Corrected 6-Echo Dixon Volumetric Interpolated Breath-hold Examination Imaging for Osteopenia and Osteoporosis Detection: Correlations with Sex, Age, and Menopause
- Background Gradient Correction using Excitation Pulse Profile for Fat and T2* Quantification in 2D Multi-Slice Liver Imaging
- Measurement and Compensation of Respiration-Induced B0 Variations in Lumbar Spine Bone Marrow Fat Quantification
