Three-Dimensional Ground Glass Opacity Ratio in CT Images Can Predict Tumor Invasiveness of Stage IA Lung Cancer
- Affiliations
-
- 1Department of Thoracic Surgery, Armed Forces Capital Hospital, Seongnam, Korea.
- 2Department of Medicine, The Graduate School of Yonsei University, Seoul, Korea.
- 3Department of Radiology, Yonsei University College of Medicine, Seoul, Korea.
- 4Department of Thoracic and Cardiovascular Surgey, Yonsei University College of Medicine, Seoul, Korea. CYLEECS@yuhs.ac
- 5Department of Pathology, Dongguk University College of Medicine, Dongguk University Ilsan Hospital, Goyang, Korea.
- KMID: 2374157
- DOI: http://doi.org/10.3349/ymj.2016.57.5.1131
Abstract
- PURPOSE
We investigated the relationship between various parameters, including volumetric parameters, and tumor invasiveness according to the International Association for the Study of Lung Cancer (IASLC)/American Thoracic Society (ATS)/European Respiratory Society (ERS) classification.
MATERIALS AND METHODS
We retrospectively reviewed 99 patients with completely resected stage IA lung adenocarcinoma. The correlation between several parameters [one-dimensional ground glass opacity (1D GGO) ratio, two-dimensional (2D) GGO ratio, three-dimensional (3D) GGO ratio, 1D solid size, 2D solid size, and 3D solid size] and tumor invasiveness according to IASLC/ATS/ERS classification was investigated using receiver operating characteristic (ROC) analysis. Adenocarcinoma in situ and minimally invasive adenocarcinoma were referred to as noninvasive adenocarcinoma.
RESULTS
The areas under the curve (AUC) to predict invasive adenocarcinoma for the 1D, 2D, and 3D GGO ratios were 0.962, 0.967, and 0.971, respectively. The optimal cut-off values for the 1D, 2D, and 3D GGO ratios were 38%, 62%, and 74%, respectively. The AUC values for 1D, 2D, and 3D solid sizes to predict invasive adenocarcinoma were 0.933, 0.944, and 0.903, respectively. The optimal cut-off values for 1D, 2D, and 3D solid sizes were 1.2 cm, 1.5 cm2, and 0.7 cm3, respectively. The difference in the ROC curves for 3D GGO ratio and 3D solid size was significant (p=0.01).
CONCLUSION
Computed tomography image-related parameters based on GGO were well correlated with and predictive of invasiveness according to IASLC/ATS/ERS classification. 3D GGO ratio was more strongly correlated with pathologic invasiveness than 3D solid size.
Keyword
MeSH Terms
-
Adenocarcinoma/*diagnostic imaging/*pathology
Adult
Aged
Aged, 80 and over
Area Under Curve
Female
Humans
*Imaging, Three-Dimensional
Lung Neoplasms/*diagnostic imaging/*pathology
Male
Middle Aged
Neoplasm Invasiveness
Neoplasm Staging
Predictive Value of Tests
ROC Curve
Retrospective Studies
*Tomography, X-Ray Computed
Tumor Burden
Figure
-

Fig. 1 Representative examples of 3D segmentation and measurement of parameters. 3D segmentation performed using the lung window setting (window width=1465 HU; level=−498 HU). The threshold value for ground glass opacity (GGO) was determined after plotting line histograms on multiplanar axial (A), coronal (B), and sagittal (C) images. Using the threshold values obtained from the line histogram, segmentation was performed by including the entire nodule and adjacent parenchyma within the volume of interest and then extracting the pixel over the threshold values. Of the 3 threshold values, the most suitable one was selected by visual assessment on comparing the nodule on the source image and that on the extracted image. The threshold value for the solid portion was considered either −290 HU or −90 HU based on the comparison of the border between the GGO and the solid portion on the source image with that on the color-coded segmentation image (D). After segmentation, the volume of the total nodule, the volume of the GGO portion, the volume of the solid portion, and the volume percentage of the GGO and solid portion were calculated (E). On the axial plane of the greatest area of the nodule, the longest diameter of the nodule and the maximum perpendicular diameter were measured using electronic calipers on the color-coded image (F). On the axial plane with the greatest area of solid portion, the longest diameter and maximum perpendicular diameter of the solid portion were measured (G). 3D, three-dimensional; HU, Hounsfield unit.
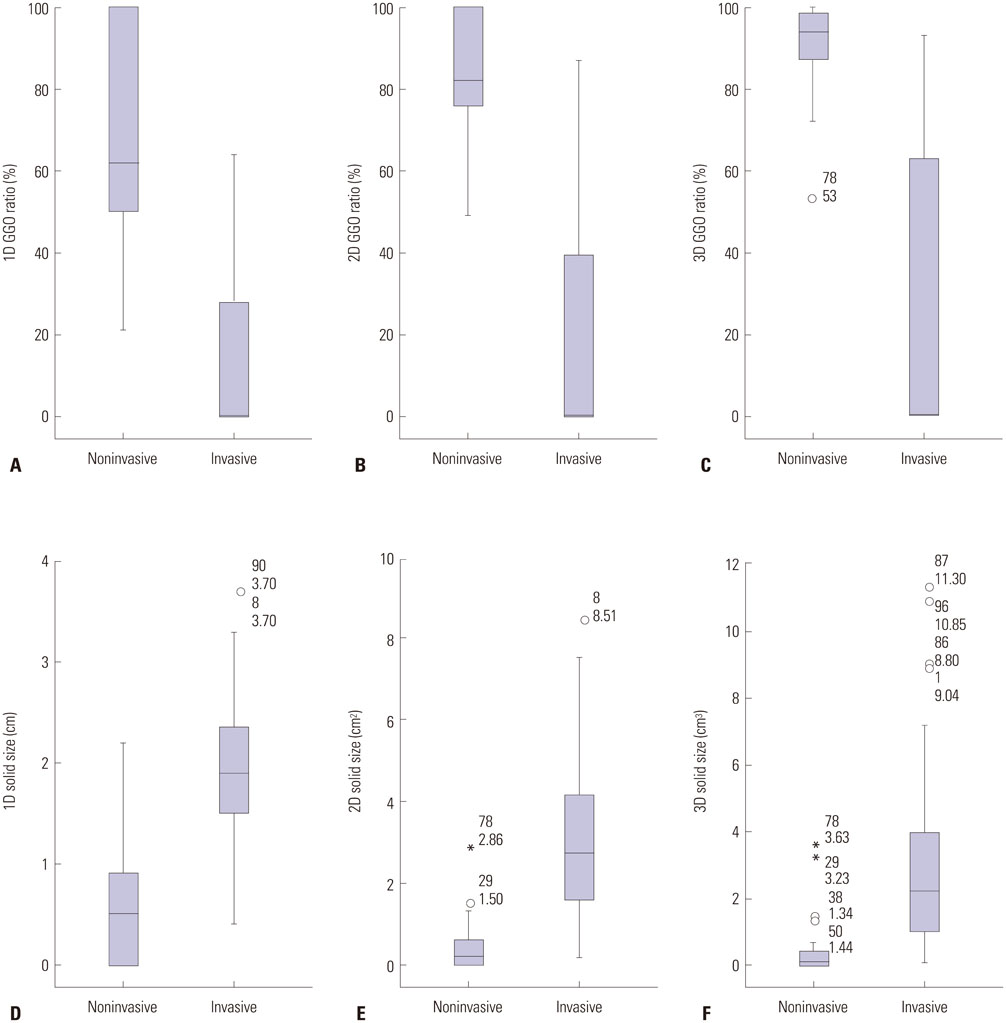
Fig. 2 Box plots showing the distributions of parameters for noninvasive and invasive adenocarcinoma. (A) One-dimensional (1D) ground glass opacity (GGO) ratio, (B) two-dimensional (2D) GGO ratio, (C) three-dimensional (3D) GGO ratio, (D) 1D solid size, (E) 2D solid size, (F) 3D solid size.

Fig. 3 Receiver operating characteristic curves for the (A) one-dimensional (1D) ground glass opacity (GGO) ratio, (B) two-dimensional (2D) GGO ratio, (C) three-dimensional (3D) GGO ratio, (D) 1D solid size, (E) 2D solid size, and (F) 3D solid size showing the optimal cut-off values for the parameters. AUC, area under the curve.
Reference
-
1. National Lung Screening Trial Research Team. Aberle DR, Adams AM, Berg CD, Black WC, Clapp JD, et al. Reduced lung-cancer mortality with low-dose computed tomographic screening. N Engl J Med. 2011; 365:395–409.
Article2. Wood DE, Kazerooni E, Baum SL, Dransfield MT, Eapen GA, Ettinger DS, et al. Lung cancer screening, version 1.2015: featured updates to the NCCN guidelines. J Natl Compr Canc Netw. 2015; 13:23–34.3. Patz EF Jr, Pinsky P, Gatsonis C, Sicks JD, Kramer BS, Tammemägi MC, et al. Overdiagnosis in low-dose computed tomography screening for lung cancer. JAMA Intern Med. 2014; 174:269–274.
Article4. Maldonado F, Duan F, Raghunath SM, Rajagopalan S, Karwoski RA, Garg K, et al. Noninvasive computed tomography-based risk stratification of lung adenocarcinomas in the national lung screening trial. Am J Respir Crit Care Med. 2015; 192:737–744.
Article5. Travis WD, Brambilla E, Noguchi M, Nicholson AG, Geisinger KR, Yatabe Y, et al. International association for the study of lung cancer/ american thoracic society/european respiratory society international multidisciplinary classification of lung adenocarcinoma. J Thorac Oncol. 2011; 6:244–285.6. Russell PA, Wainer Z, Wright GM, Daniels M, Conron M, Williams RA. Does lung adenocarcinoma subtype predict patient survival?: a clinicopathologic study based on the new International Association for the Study of Lung Cancer/American Thoracic Society/European Respiratory Society international multidisciplinary lung adenocarcinoma classification. J Thorac Oncol. 2011; 6:1496–1504.
Article7. Yanagawa N, Shiono S, Abiko M, Ogata SY, Sato T, Tamura G. New IASLC/ATS/ERS classification and invasive tumor size are predictive of disease recurrence in stage I lung adenocarcinoma. J Thorac Oncol. 2013; 8:612–618.
Article8. Hashizume T, Yamada K, Okamoto N, Saito H, Oshita F, Kato Y, et al. Prognostic significance of thin-section CT scan findings in small-sized lung adenocarcinoma. Chest. 2008; 133:441–447.
Article9. Takahashi M, Shigematsu Y, Ohta M, Tokumasu H, Matsukura T, Hirai T. Tumor invasiveness as defined by the newly proposed IASLC/ATS/ERS classification has prognostic significance for pathologic stage IA lung adenocarcinoma and can be predicted by radiologic parameters. J Thorac Cardiovasc Surg. 2014; 147:54–59.
Article10. Linning E, Daqing M. Volumetric measurement pulmonary ground-glass opacity nodules with multi-detector CT: effect of various tube current on measurement accuracy--a chest CT phantom study. Acad Radiol. 2009; 16:934–939.
Article11. Yanagawa M, Tanaka Y, Kusumoto M, Watanabe S, Tsuchiya R, Honda O, et al. Automated assessment of malignant degree of small peripheral adenocarcinomas using volumetric CT data: correlation with pathologic prognostic factors. Lung Cancer. 2010; 70:286–294.
Article12. Matsuguma H, Yokoi K, Anraku M, Kondo T, Kamiyama Y, Mori K, et al. Proportion of ground-glass opacity on high-resolution computed tomography in clinical T1 N0 M0 adenocarcinoma of the lung: A predictor of lymph node metastasis. J Thorac Cardiovasc Surg. 2002; 124:278–284.
Article13. Okada M, Nishio W, Sakamoto T, Uchino K, Tsubota N. Discrepancy of computed tomographic image between lung and mediastinal windows as a prognostic implication in small lung adenocarcinoma. Ann Thorac Surg. 2003; 76:1828–1832.
Article14. Suzuki K, Koike T, Asakawa T, Kusumoto M, Asamura H, Nagai K, et al. A prospective radiological study of thin-section computed tomography to predict pathological noninvasiveness in peripheral clinical IA lung cancer (Japan Clinical Oncology Group 0201). J Thorac Oncol. 2011; 6:751–756.
Article15. Takamochi K, Nagai K, Yoshida J, Suzuki K, Ohde Y, Nishimura M, et al. Pathologic N0 status in pulmonary adenocarcinoma is predictable by combining serum carcinoembryonic antigen level and computed tomographic findings. J Thorac Cardiovasc Surg. 2001; 122:325–330.
Article16. Honda T, Kondo T, Murakami S, Saito H, Oshita F, Ito H, et al. Radiographic and pathological analysis of small lung adenocarcinoma using the new IASLC classification. Clin Radiol. 2013; 68:e21–e26.
Article17. Lampen-Sachar K, Zhao B, Zheng J, Moskowitz CS, Schwartz LH, Zakowski MF, et al. Correlation between tumor measurement on Computed Tomography and resected specimen size in lung adenocarcinomas. Lung Cancer. 2012; 75:332–335.
Article18. Isaka T, Yokose T, Ito H, Imamura N, Watanabe M, Imai K, et al. Comparison between CT tumor size and pathological tumor size in frozen section examinations of lung adenocarcinoma. Lung Cancer. 2014; 85:40–46.
Article19. Sumikawa H, Johkoh T, Nagareda T, Sekiguchi J, Matsuo K, Fujita Y, et al. Pulmonary adenocarcinomas with ground-glass attenuation on thin-section CT: quantification by three-dimensional image analyzing method. Eur J Radiol. 2008; 65:104–111.
Article
- Full Text Links
-
- Actions
-
Cited
- CITED
-
- Close
- Share
-
- Similar articles
-
- Ground-Glass Opacity in Lung Metastasis from Adenocarcinoma of the Stomach: A Case Report
- The Clinical Approach to Nodular Ground Glass Opacity in the Lung
- Clinical Outcome of Stereotactic Body Radiotherapy in Patients with Early-Stage Lung Cancer with Ground-Glass Opacity Predominant Lesions: A Single Institution Experience
- Radiologic Approach to the Idiopathic Interstitial Pneumonias
- Paraquat Induced Lung Injury: Long-term Follow-up of HRCT
