J Korean Soc Radiol.  2017 Mar;76(3):221-228. 10.3348/jksr.2017.76.3.221.

Rapid Progression of Gliomatosis Cerebri to Secondary Glioblastoma, Factors That Affect the Progression Rate: A Case Report

Affiliations
  • 1Department of Radiology, Eulji University Hospital, Daejeon, Korea. midosyu@eulji.ac.kr
  • 2Department of Neurosurgery, Eulji University Hospital, Daejeon, Korea.
  • 3Department of Pathology, Eulji University School of Medicine, Daejeon, Korea.

Abstract

Glioblastomas may develop de novo or through progression from low-grade or anaplastic astrocytomas. The term "˜primary glioblastoma' refers to a glioblastoma that lacks a precursor lesion and has a clinical history of less than three months. On the other hand, the term "˜secondary glioblastoma' indicates that the glioblastoma has progressed from a low-grade tumor after a long latency period and often manifests in younger patients. These subtypes of glioblastoma develop via different genetic pathways, and they differ in prognosis and response to therapy. Thus, differential diagnosis of these subtypes and prediction of the factors that affect the progression from low-grade diffuse astrocytoma to secondary glioblastoma would be clinically very important. We present a rare case of secondary glioblastoma, which developed only three months after the follow up imaging evaluations, with a history of low grade glioma, and present the factors that cause rapid progression.


MeSH Terms

Astrocytoma
Diagnosis, Differential
Disease Progression
Follow-Up Studies
Glioblastoma*
Glioma
Hand
Humans
Latency Period (Psychology)
Neoplasms, Neuroepithelial*
Prognosis

Figure

  • Fig. 1. Initial contrast-enhanced conventional, perfusion MRI, and MR spectroscopy in an 80-year-old male, suggesting gliomatosis cerebri. A-D. Fluid attenuation inversion recovery (FLAIR) images show diffuse swelling with increased signal intensity and mild gyral effacement involving the left anterior temporal, the left parahippocampal, some of the left frontal cortical and white matter areas (A) as well as the left high parietal white matter and some cortical areas (B). Gadobenate dimeglumine-enhanced T1-weighted MRI shows slightly decreased signal without an enhancing lesion in the corresponding sites (C, D). E, F. Cerebral blood volume parameter map shows an increased signal at the level of high signal intensity detected on conventional MRI. G. On MR spectroscopy, an increased choline peak and a markedly decreased N-acetylaspartate peak are seen in the diffuse ill-demarcated patchy high FLAIR signal intensity, poorly enhancing lesions involving the left anterior parahippocampal temporal area, suggesting gliomatosis cerebri.

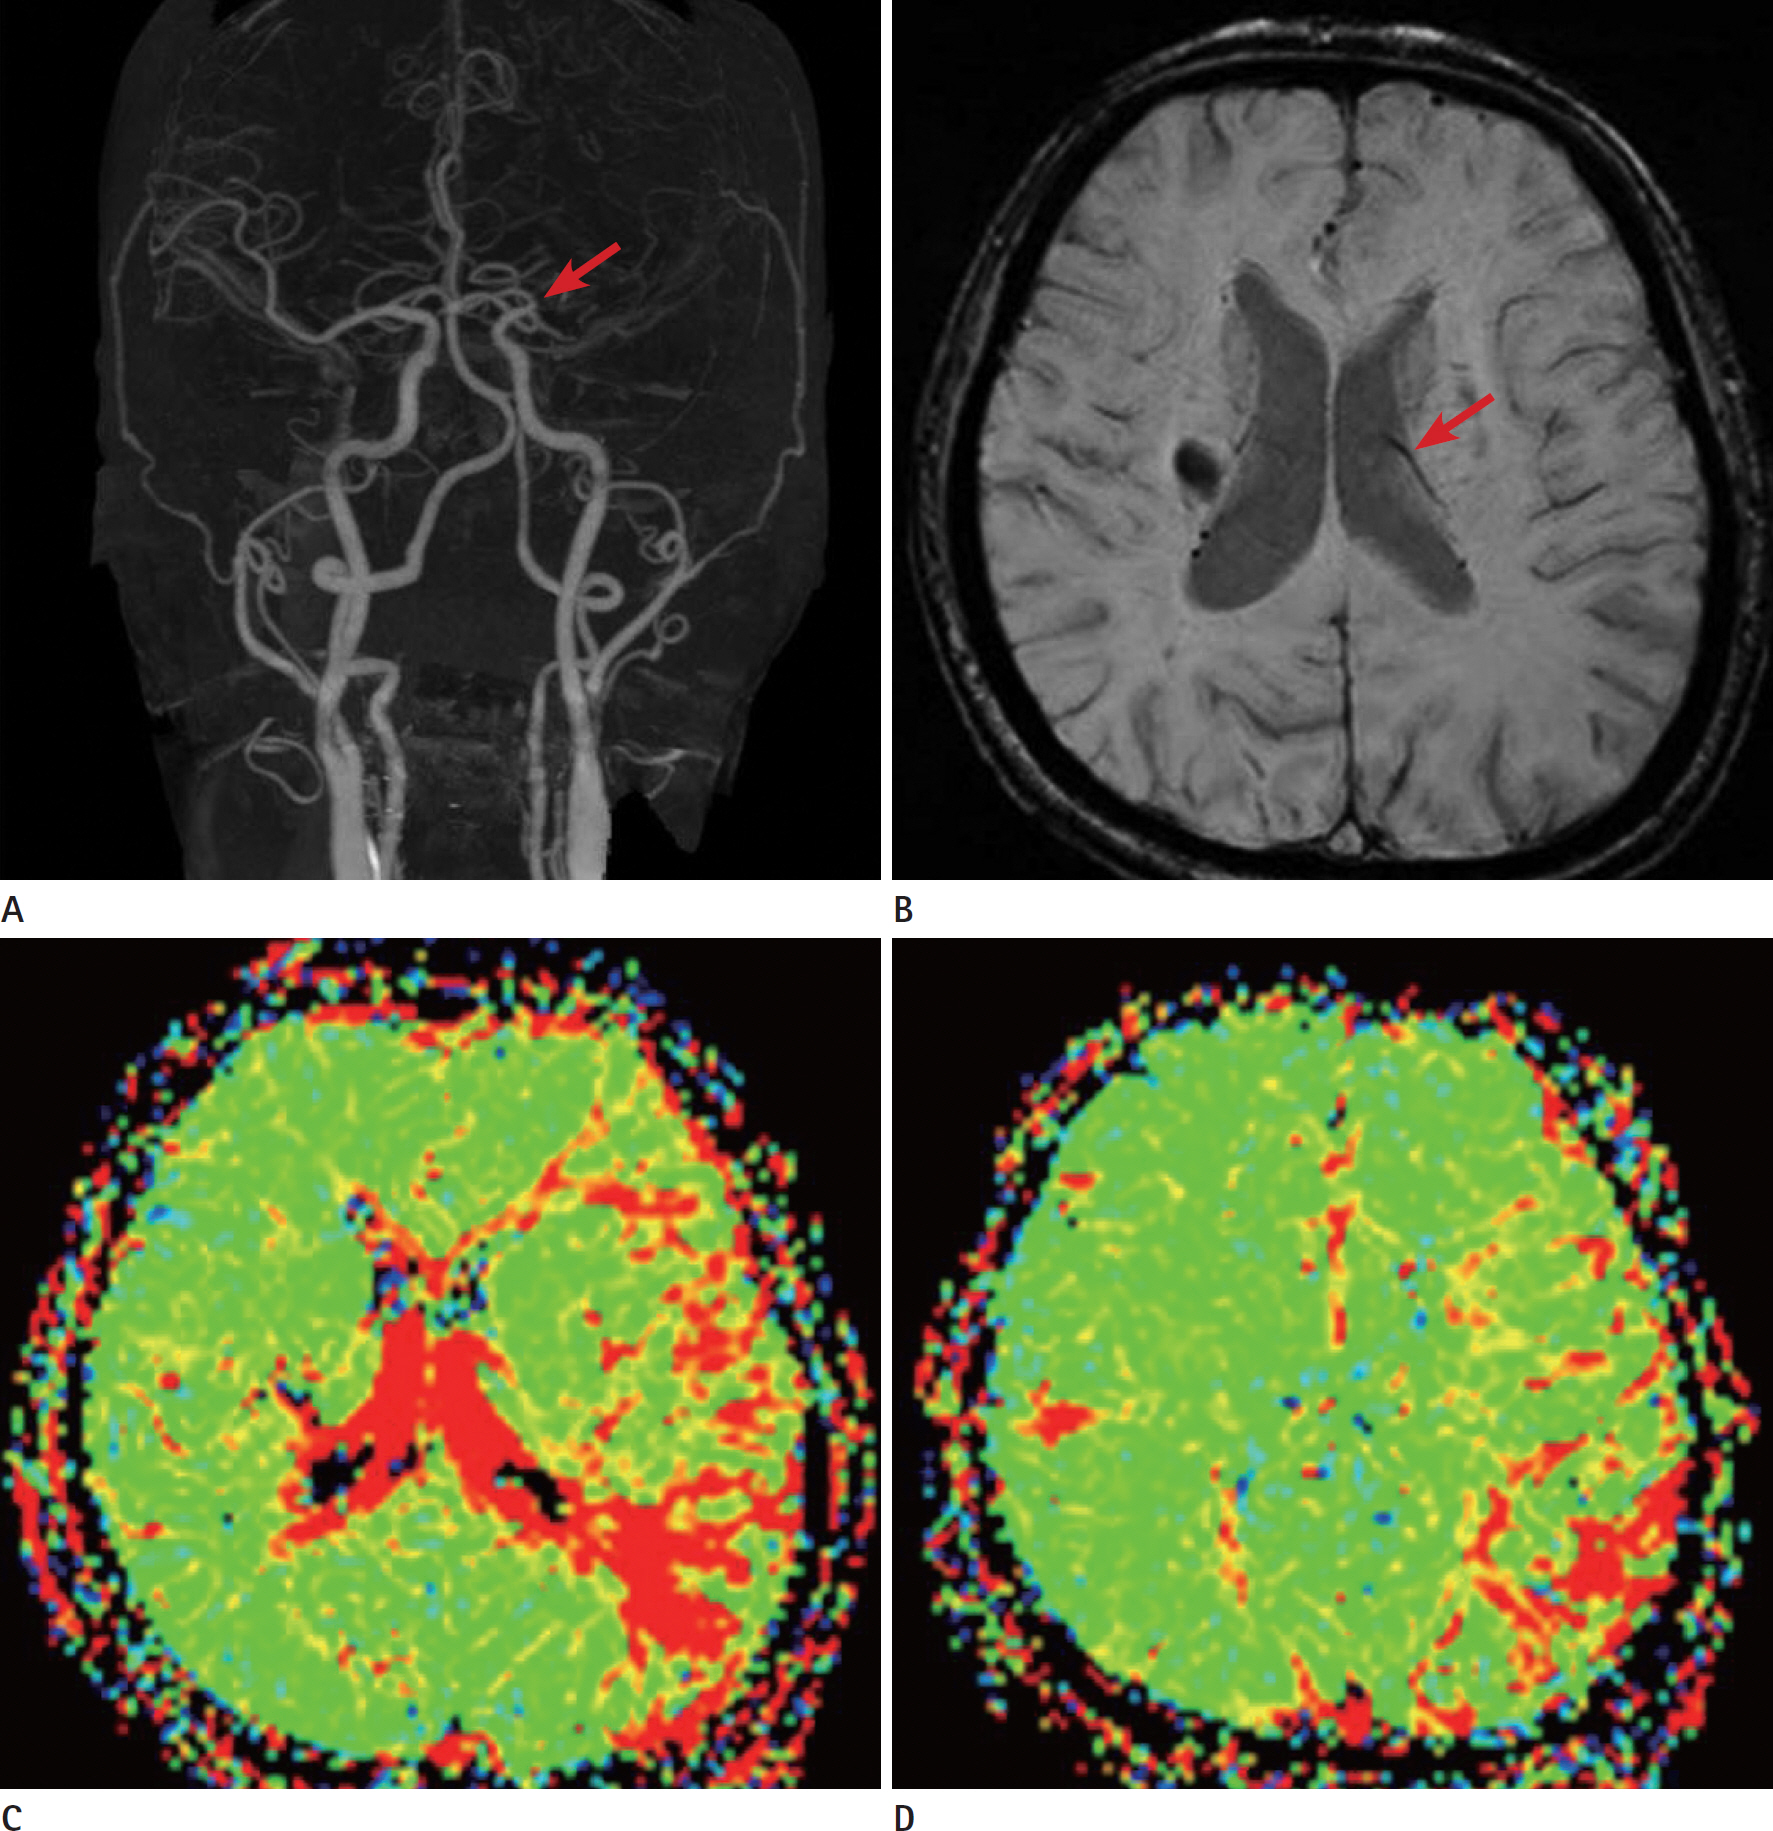
  • Fig. 2. Initial evaluation of an 80-year-old male by CT angiography, susceptibility-weighted MR Imaging, and perfusion MRI, showing the se-quelae of previous infarction as the presence of a large penumbra or oligemia. A. CT angiography shows total occlusion of the left proximal portion of the middle cerebral artery segment one (arrow). However, distal run-off by collaterals is faintly visible. B. On susceptibility-weighted MRI, there are asymmetrically prominent and deep medullary veins in the left hemisphere (arrow), suggestive of increased oxygen extraction. C, D. Mean transit time (MTT) parameter maps show significant asymmetry with a large area of increased intensity, which indicates prolonged MTT in the left border zone of the frontal, parietal, temporal periventricular white matter areas in the left middle cerebral artery territory, suggesting the presence of a large penumbra or oligemia.

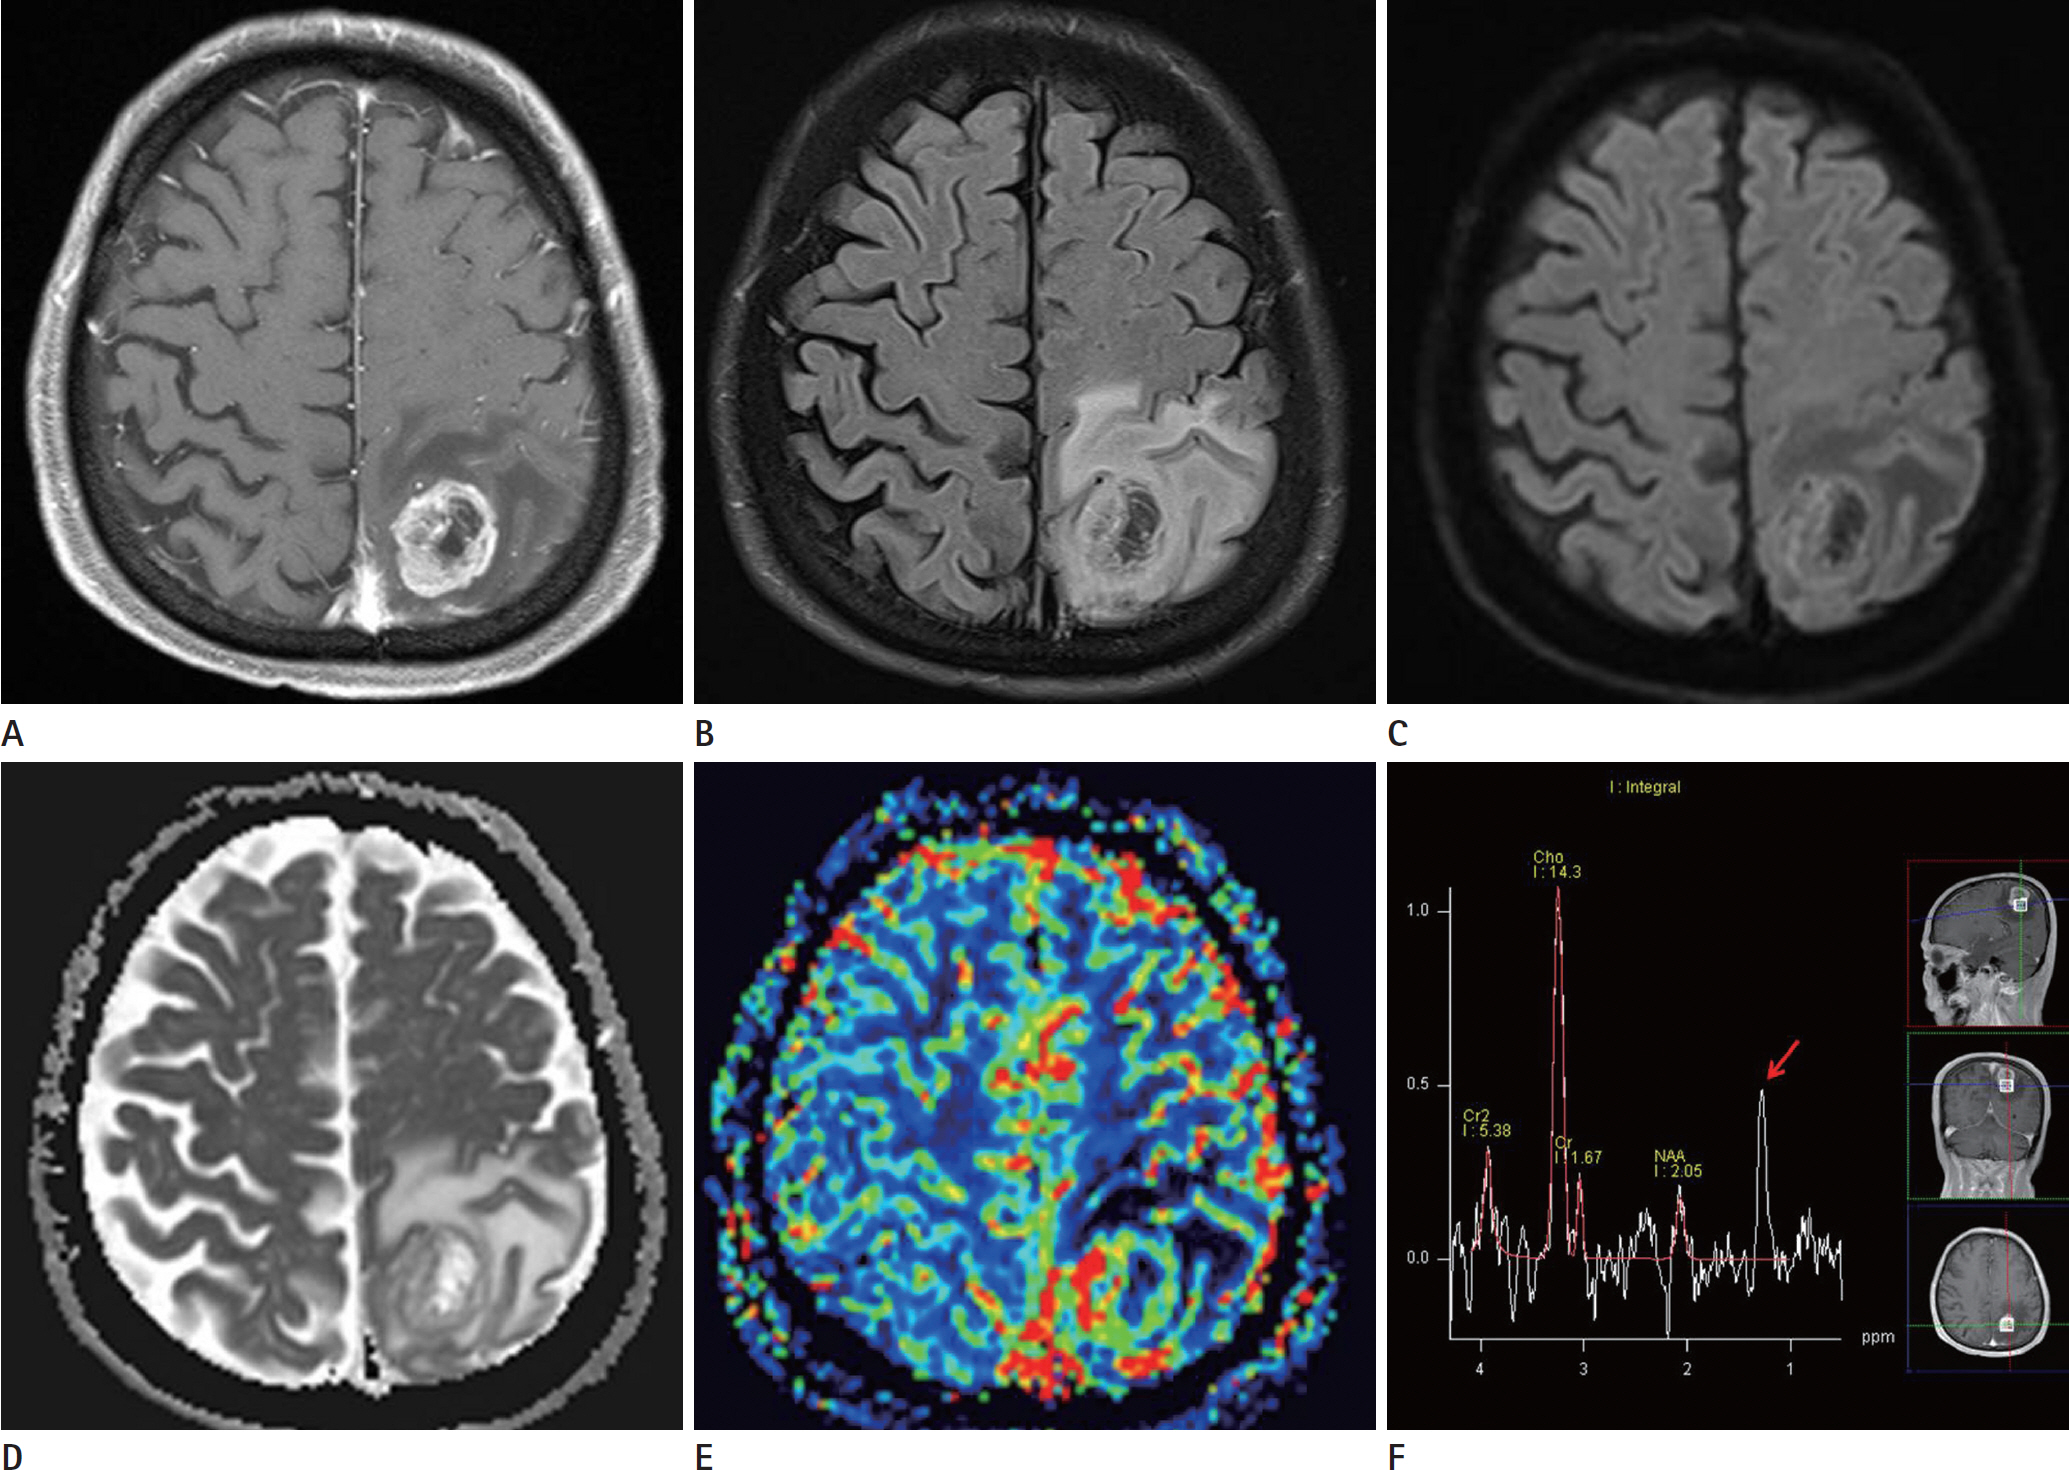
  • Fig. 3. Follow-up contrast-enhanced, perfusion MRI and MR spectroscopy after 3 months showing a newly developed glioblastoma at the site of the previous gliomatosis cerebri lesion. A. Contrast- enhanced T1weighted MRI shows a markedly enhancing wall with uneven thickness of the mass. B. Fluid attenuation inversion recovery images show a newly developed interval mass, measuring approximately 2.9 × 2.5 × 2.4 cm in dimensions in the left high parietal white matter and some cortical areas. The mass shows a lobulated margin, multiple internal septae, and peripheral edema. Central portion of the mass shows dark signal intensity. C. Diffusion weighted imaging and (D) apparent diffusion coefficient show diffusion restriction in the thickened wall of the mass, but no increased signal intensity is detected in the central necrotic portion. E. Perfusion MRI shows a markedly increased cerebral blood volume in the newly developed-interval enhancing-peripheral wall of the central necrotic mass. F. Increased choline peak and lactate peak (arrow) are seen in the peripheral enhancing wall of the mass with central necrosis in the left high parietal area, suggesting a malignant tumor such as glioblastoma or anaplastic glioma.

  • Fig. 4. Photomicrograph of the lesion in the left high parietal lobe on hematoxylin and eosin (H& E) staining and immunohistochemical staining. A, B. Photomicrograph of the lesion shows classical features of glioblastoma (A) high grade glioblastoma with glomeruloid proliferation and vascular proliferation (H& E, × 200) and (B) low grade component of the tumor (H& E, × 400). C. Neoplastic glial cells show strong positivity for Glial fibrillary acidic protein immunohistochemical staining (× 100). D. Ki67, a marker of cell division and an indicator of tumor cell proliferation activity, shows high levels of reactivity, indicating an increased grade of glioma (× 100). E. p53 expression, which is considered an early event in glioma progression and is generally associated with secondary glioblastoma, rather than primary glioblastoma, shows moderately positive reactivity (× 100). F. Hypoxia-inducible factor 1a (HIF-1α) is a transcriptional factor that activates tumor survival under an unstable hypoxic tumor microenviron-ment. Some of the tumor cells show nuclear staining, indicating that the tumor is in a hypoxic environment (× 400).


Reference

1. Ohgaki H, Kleihues P. Genetic pathways to primary and secondary glioblastoma. Am J Pathol. 2007; 170:1445–1453.
Article
2. Watanabe K, Tachibana O, Sata K, Yonekawa Y, Kleihues P, Ohgaki H. Overexpression of the EGF receptor and p53 mutations are mutually exclusive in the evolution of primary and secondary glioblastomas. Brain Pathol. 1996; 6:217–223. discussion 223-224.
Article
3. Watanabe K, Sato K, Biernat W, Tachibana O, von Ammon K, Ogata N, et al. Incidence and timing of p53 mutations during astrocytoma progression in patients with multiple biop-sies. Clin Cancer Res. 1997; 3:523–530.
4. Nobusawa S, Watanabe T, Kleihues P, Ohgaki H. IDH1 mutations as molecular signature and predictive factor of secondary glioblastomas. Clin Cancer Res. 2009; 15:6002–6007.
Article
5. Scherer H. Cerebral astrocytomas and their derivatives. Am J Cancer. 1940; 40:159–198.
6. Ohgaki H, Kleihues P. The definition of primary and secondary glioblastoma. Clin Cancer Res. 2013; 19:764–772.
Article
7. Burger PC, Scheithauer BW. Tumors of the central nervous system. Atlas of tumor pathology. Washington, DC: Armed Forces Institute of Pathology;1994.
8. Kleihues P, Ohgaki H. Primary and secondary glioblastomas: from concept to clinical diagnosis. Neuro Oncol. 1999; 1:44–51.
Article
9. Parsons DW, Jones S, Zhang X, Lin JC, Leary RJ, Angenendt P, et al. An integrated genomic analysis of human glioblastoma multiforme. Science. 2008; 321:1807–1812.
Article
10. Vaupel P. The role of hypoxia-induced factors in tumor progression. Oncologist. 2004; 9(Suppl 5):10–17.
Article
Full Text Links
  • JKSR
Actions
Cited
CITED
export Copy
Close
Share
  • Twitter
  • Facebook
Similar articles
Copyright © 2024 by Korean Association of Medical Journal Editors. All rights reserved.     E-mail: koreamed@kamje.or.kr