The Effect of the Degree of Luminal Contrast-Enhancement on CT Measurement of Plaque Size: A Comparison with T1-weighted Magnetic Resonance Imaging
- Affiliations
-
- 1Department of Diagnostic Radiology, Department of Cardiovascular Radiology Cardiovascular Center, and Research Institute of Radiological Science, Yonsei University College of Medicine, Korea. bchoi@yuhs.ac
- 2Department of Diagnostic Radiology, Gangnam Severance Hospital, Yonsei University College of Medicine, Korea.
Abstract
- PURPOSE
We studied early and delayed contrast-enhanced CT to determine the effects of the degree of luminal enhancement on the measurement of plaque size compared to T1-weighted MRI.
MATERIALS AND METHODS
T1-weighted MRI and a two-phase contrast-enhanced CT was performed in 5 New Zealand white rabbits with atherosclerosis. Early-phase images were acquired during an expected peak enhancement period of the lumen; delayed-phase images were acquired 240 sec after administration of the contrast media. Anteroposterior and lateral luminal diameters (APD, LD), luminal area (LA), total vessel area (TVA), and plaque area (PA) of the aorta were measured on MRI and CT, respectively and compared to each other.
RESULTS
A total of 78 slices of the aorta were analyzed. PA, measured on T1-weighted MR images, was significantly greater than PA for both early-phase and delayed-phase CT (p < 0.001). The mean difference in PA was 12.13 +/- 5.52 mm2 (p < 0.001), 11.51 +/- 4.37 mm2 (p < 0.001), -0.62 +/- 3.87 mm2 (p = 0.159) for MRI vs. early-phase CT, MRI vs. delayed-phase CT, and early-phase CT vs. delayed-phase CT, respectively.
CONCLUSION
Different luminal densities by contrast enhancement do not affect the CT measurement of plaque area for the detection of obstructive coronary artery disease.
MeSH Terms
Figure
-
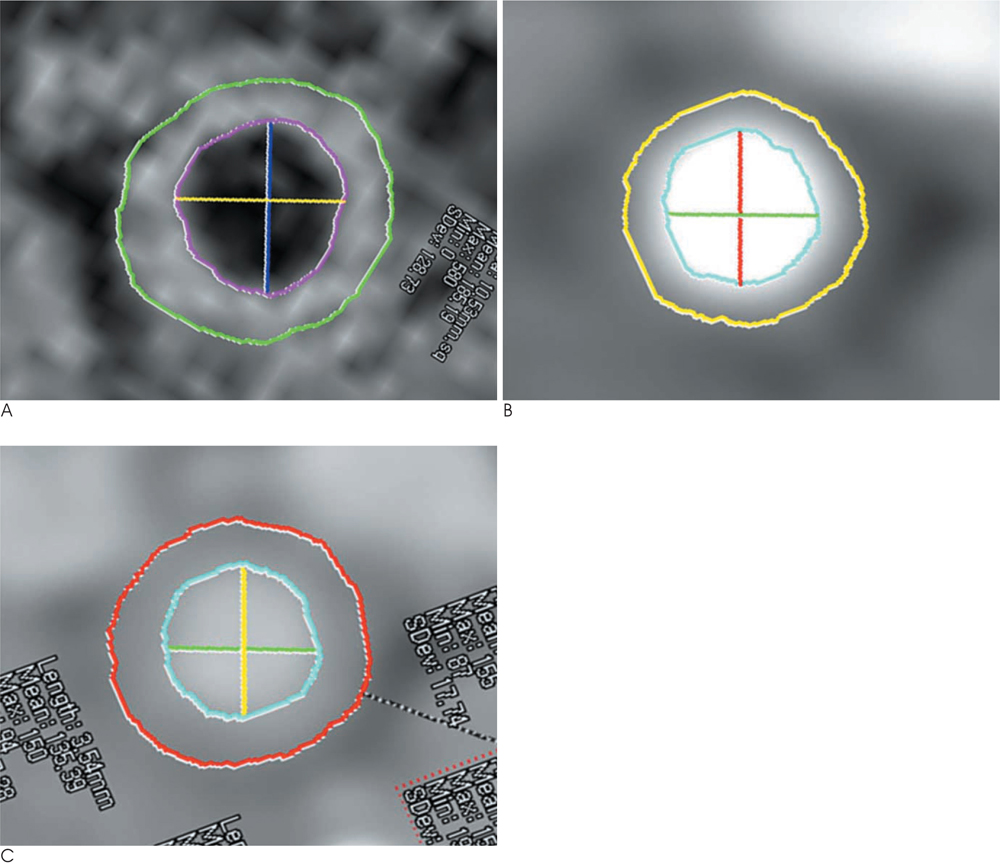
Fig. 1 Measurements. A tracing of the anterior posterior luminal diameter (vertical lines), lateral luminal diameter (horizontal lines), luminal area (inner circles), and total vessel area (outer circles) on T1-weighted MRI (A), early-phase CT (B), and delayed-phase CT (C).
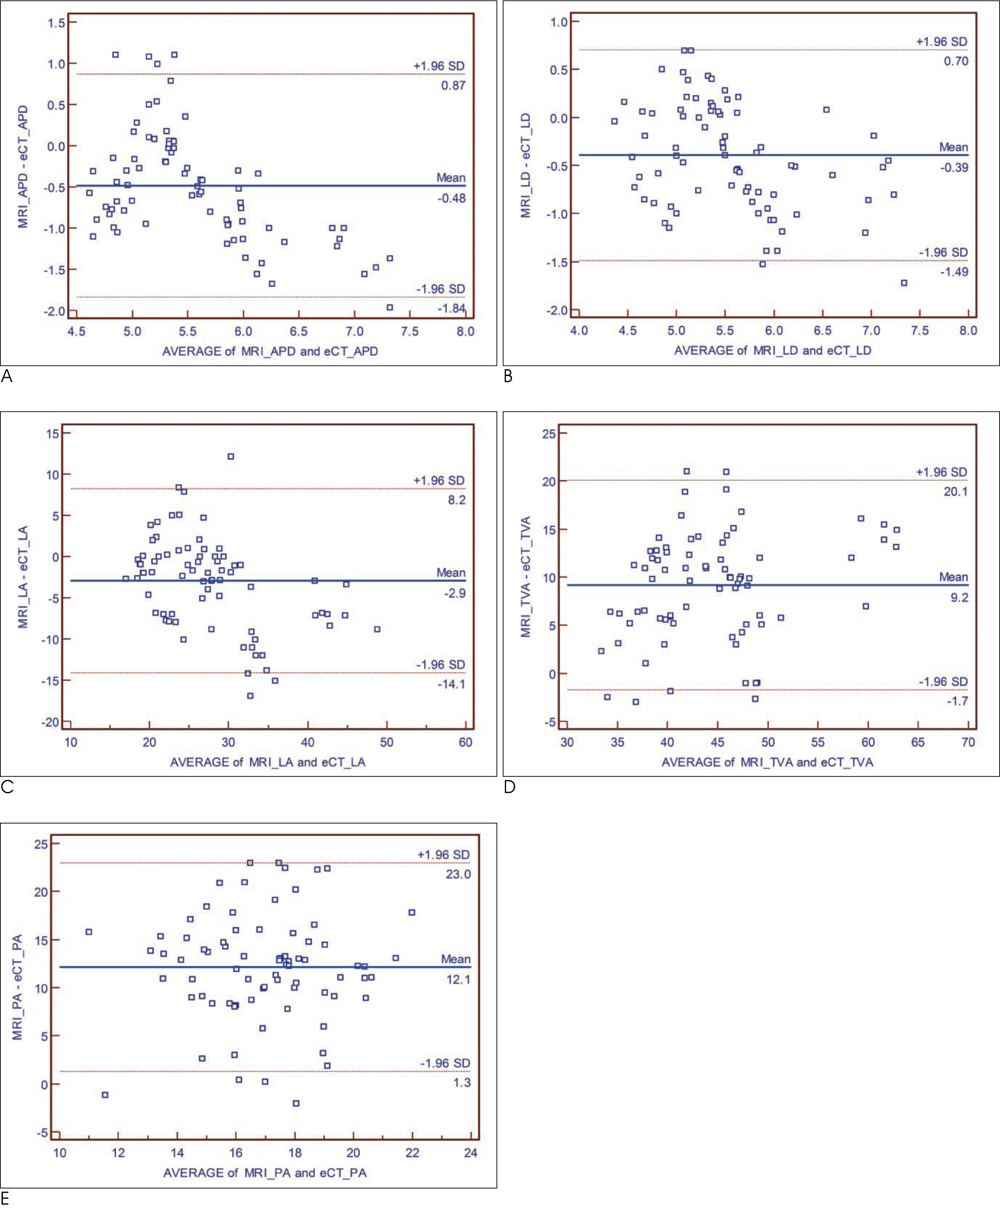
Fig. 2 Bland-Altman plots representing the bias and limits of agreement between MRI, and early-phase CT for the anteroposterior luminal diameter (A), lateral luminal diameter (B), luminal area (C), total vessel area (D), and plaque area (E). APD = anteroposterior luminal diameter, LD = lateral luminal diameter, LA = luminal area, TVA = total vessel area, PA = plaque area, MRI = magnetic resonance imaging, eCT = earlyphase CT, dCT = delayed-phase CT
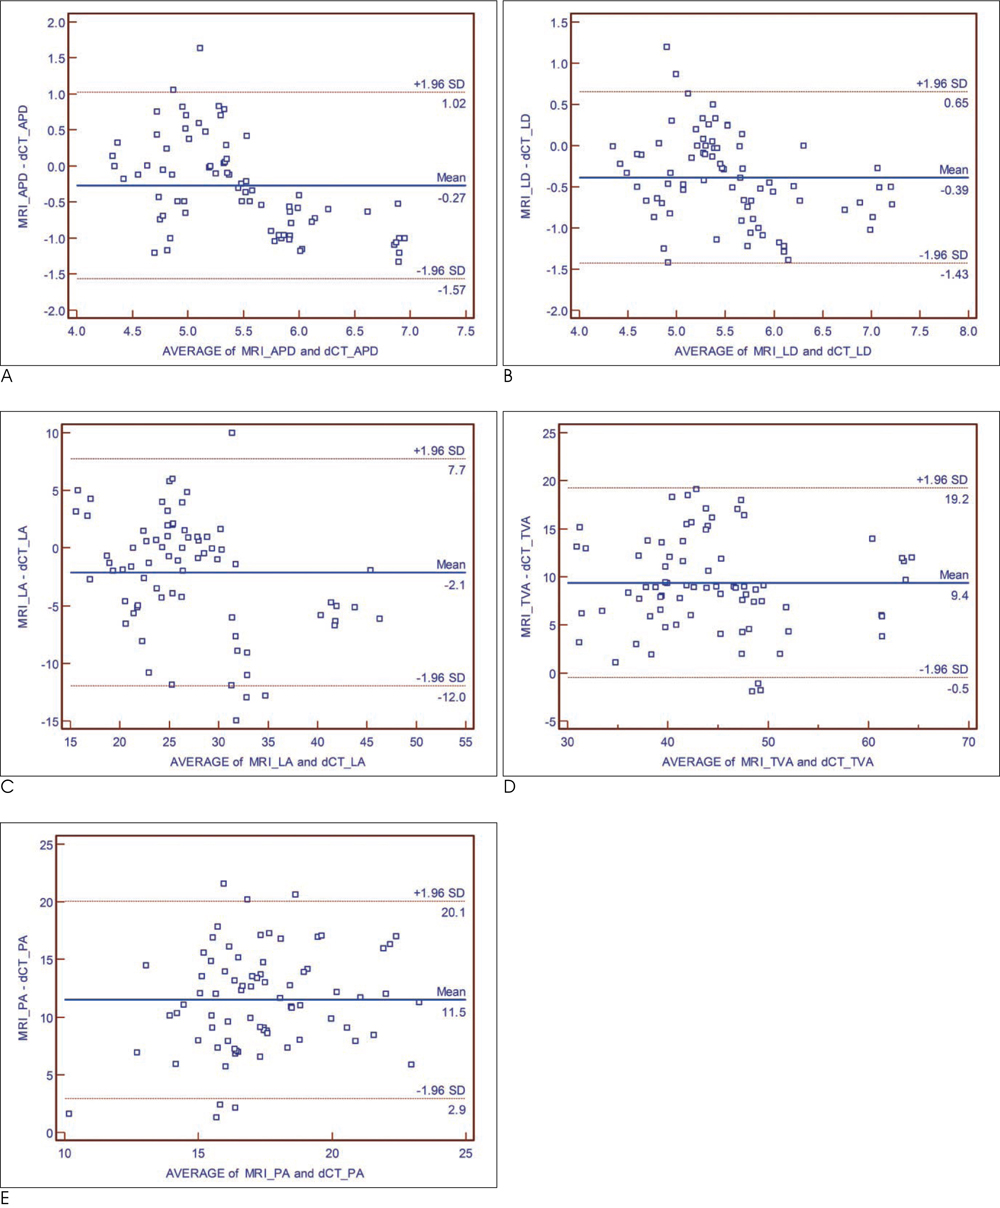
Fig. 3 Bland-Altman plots representing the bias and limits of agreement between MRI, and delayed-phase CT for the anteroposterior luminal diameter (A), lateral luminal diameter (B), luminal area (C), total vessel area (D), and plaque area (E). APD = anteroposterior luminal diameter, LD = lateral luminal diameter, LA = luminal area, TVA = total vessel area, PA = plaque area, MRI = magnetic resonance imaging, eCT = earlyphase CT, dCT = delayed-phase CT

Fig. 4 Bland-Altman plots representing the bias and limits of agreement between early-phase CT and delayed-phase CT for the anteroposterior luminal diameter (A), lateral luminal diameter (B), luminal area (C), total vessel area (D), and plaque area (E). APD = anteroposterior luminal diameter, LD = lateral luminal diameter, LA = luminal area, TVA = total vessel area, PA = plaque area, MRI = magnetic resonance imaging, eCT = earlyphase CT, dCT = delayed-phase CT
Reference
-
1. Mowatt G, Cook JA, Hillis GS, Walker S, Fraser C, Jia X, et al. 64-slice computed tomography angiography in the diagnosis and assessment of coronary artery disease: systematic review and meta-analysis. Heart. 2008; 94:1386–1393.2. Budoff MJ, Dowe D, Jollis JG, Gitter M, Sutherland J, Halamert E, et al. Diagnostic performance of 64-multidetector row coronary computed tomographic angiography for evaluation of coronary artery stenosis in individuals without known coronary artery disease: results from the prospective multicenter ACCURACY (assessment by coronary computed tomographic angiography of individuals undergoing invasive coronary angiography) trial. J Am Coll Cardiol. 2008; 52:1724–1732.3. Miller JM, Rochitte CE, Dewey M, Arbab-Zadeh A, Niinuma H, Gottlieb I, et al. Diagnostic performance of coronary angiography by 64-row CT. N Engl J Med. 2008; 359:2324–2336.4. Schepis T, Marwan M, Pflederer T, Seltmann M, Ropers D, Daniel WG, et al. Quantification of non-calcified coronary atherosclerotic plaques with dual-source computed tomography: comparison with intravascular ultrasound. Heart. 2010; 96:610–615.5. Yang WI, Hur J, Ko YG, Choi BW, Kim JS, Choi D, et al. Assessment of tissue characteristics of noncalcified coronary plaques by 64-slice computed tomography in comparison with integrated backscatter intravascular ultrasound. Coron Artery Dis. 2010; 21:168–174.6. Hur J, Kim YJ, Lee HJ, Nam JE, Choe KO, Seo JS, et al. Quantification and characterization of obstructive coronary plaques using 64-slice computed tomography: a comparison with intravascular ultrasound. J Comput Assist Tomogr. 2009; 33:186–192.7. Leber AW, Becker A, Knez A, von Ziegler F, Sirol M, Nikolaou K, et al. Accuracy of 64-slice computed tomography to classify and quantify plaque volumes in the proximal coronary system: a comparative study using intravascular ultrasound. J Am Coll Cardiol. 2006; 47:672–677.8. Viles-Gonzalez JF, Poon M, Sanz J, Rius T, Nikolaou K, Fayad ZA, et al. In vivo 16-slice, multidetector-row computed tomography for the assessment of experimental atherosclerosis: comparison with magnetic resonance imaging and histopathology. Circulation. 2004; 110:1467–1472.9. Cademartiri F, Mollet NR, Runza G, Bruining N, Hamers R, Somers P, et al. Influence of intracoronary attenuation on coronary plaque measurements using multislice computed tomography: observations in an ex vivo model of coronary computed tomography angiography. Eur Radiol. 2005; 15:1426–1431.10. Yuan C, Kerwin WS, Ferguson MS, Polissar N, Zhang S, Cai J, et al. Contrast-enhanced high resolution MRI for atherosclerotic carotid artery tissue characterization. J Magn Reson Imaging. 2002; 15:62–67.11. Zaho XQ, Phan BA, Chu B, Bray F, Moore AB, Polissar NL, et al. Testing the hypothesis of atherosclerotic plaque lipid depletion during lipid therapy by magnetic resonance imaging: study design of carotid plaque composition study. Am Heart J. 2007; 154:239–246.12. Cai J, Hatsukami TS, Ferguson MS, Kerwin WS, Saam T, Chu B, et al. In vivo quantitative measurement of intact fibrous cap and lipid-rich necrotic core size in atherosclerotic carotid plaque: comparison of high-resolution, contrast-enhanced magnetic resonance imaging and histology. Circulation. 2005; 112:3437–3444.13. Briely-Saebo KC, Mulder WJ, Mani V, Hyafil F, Amirbekian V, Aguinaldo JG, et al. Magnetic resonance imaging of vulnerable atherosclerotic plaques: current imaging strategies and molecular imaging probes. J Magn Reson Imaging. 2007; 26:460–479.14. Kerwin WS, Zhao X, Yuan C, Hatsukami TS, Maravilla KR, Underhill HR, et al. Contrast-enhanced MRI of carotid atherosclerosis: dependence on contrast agent. J Magn Reson Imaging. 2009; 30:35–40.15. Dong L, Wang J, Yarnykh VL, Underhill HR, Neradilek MB, Polissar N, et al. Efficient flow suppressed MRI improves interscan reproducibility of carotid atherosclerosis plaque burden measurements. J Magn Reson Imaging. 2010; 32:452–458.16. Helft G, Worthley SG, Fuster V, Zaman AG, Schechter C, Osende JI, et al. Atherosclerotic aortic component quantification by noninvasive magnetic resonance imaging: an in vivo study in rabbits. J Am Coll Cardiol. 2001; 37:1149–1154.17. Courtman DW, Schwartz SM, Hart CE. Sequential injury of the rabbit abdominal aorta induces intramural coagulation and luminal narrowing independent of intimal mass: extrinsic pathway inhibition eliminates luminal narrowing. Circ Res. 1998; 82:996–1006.18. Choi BW, Hur J, Lee HJ, Kim YJ, Kim TH, Choe KO. Gadolinium-enhanced magnetic resonance imaging of atherosclerotic plaques in comparison with histopathology: an in vivo study in aorta of rabbits. J Korean Soc Magn Reson Med. 2009; 13:81–87.19. Petranovic M, Soni A, Bezzera H, Loureiro R, Sarwar A, Raffel C, et al. Assessment of nonstenotic coronary lesions by 64-slice multidetector computed tomography in comparison to intravascular ultrasound: evaluation of nonculprit coronary lesions. J Cardiovasc Comput Tomogr. 2009; 3:24–31.20. Sun J, Zhang Z, Lu B, Yu W, Yang Y, Zhou Y, et al. Identification and quantification of coronary atherosclerotic plaques: a comparison of 64-MDCT and intravascular ultrasound. AJR Am J Roentgenol. 2008; 190:748–754.21. Hoffmann H, Frieler K, Hamm B, Dewey M. Intra- and interobserver variability in detection and assessment of calcified and noncalcified coronary artery plaques using 64-slice computed tomography: variability in coronary artery plaque measurement using MSCT. Int J Cardiovasc Imaging. 2008; 24:735–742.22. Pflederer T, Schmid M, Ropers D, Ropers U, Komatsu S, Daniel WG, et al. Interobserver variability of 64-slice computed tomography for the quantification of non-calcified coronary atherosclerotic plaque. Rofo. 2007; 179:953–957.
- Full Text Links
-
- Actions
-
Cited
- CITED
-
- Close
- Share
-
- Similar articles
-
- Radiologic Findings of Multiple Myeloma with Gastric Involvement: A Case Report
- Importance of Contrast-Enhanced Fluid-Attenuated Inversion Recovery Magnetic Resonance Imaging in Various Intracranial Pathologic Conditions
- Ultrasonographic and Magnetic Resonance Imaging Findings of Testicular Lymphoma
- MR of Normal Pancreas: Comparison of Five Pulse Sequences and Enhancing Patterns on Dynamic Imaging
- Abbreviated Breast Magnetic Resonance Imaging: Background, Evidence From Studies, and Future Considerations
