Investigation of Perfusion-weighted Signal Changes on a Pulsed Arterial Spin Labeling Magnetic Resonance Imaging Technique: Dependence on the Labeling Gap, Delay Time, Labeling Thickness, and Slice Scan Order
- Affiliations
-
- 1Department of Radiology, Kyung Hee University Hospital at Gangdong, Seoul, Korea. ghjahng@gmail.com
- 2Department of Radiology, Kyung Hee University College of Medicine, Seoul, Korea.
Abstract
- Currently, an arterial spin labeling (ASL) magnetic resonance imaging (MRI) technique does not routinely used in clinical studies to measure perfusion in brain because optimization of imaging protocol is required to obtain optimal perfusion signals. Therefore, the objective of this study was to investigate changes of perfusion-weighed signal intensities with varying several parameters on a pulsed arterial spin labeling MRI technique obtained from a 3T MRI system. We especially evaluated alternations of ASL-MRI signal intensities on special brain areas, including in brain tissues and lobes. The signal targeting with alternating radiofrequency (STAR) pulsed ASL method was scanned on five normal subjects (mean age: 36 years, range: 29~41 years) on a 3T MRI system. Four parameters were evaluated with varying: 1) the labeling gap, 2) the labeling delay time, 3) the labeling thickness, and 4) the slice scan order. Signal intensities were obtained from the perfusion-weighted imaging on the gray and white matters and brain lobes of the frontal, parietal, temporal, and occipital areas. The results of this study were summarized: 1) Perfusion-weighted signal intensities were decreased with increasing the labeling gap in the bilateral gray matter areas and were least affected on the parietal lobe, but most affected on the occipital lobe. 2) Perfusion-weighted signal intensities were decreased with increasing the labeling delay time until 400 ms, but increased up to 1,000 ms in the bilateral gray matter areas. 3) Perfusion-weighted signal intensities were increased with increasing the labeling thickness until 120 mm in both the gray and white matter. 4) Perfusion-weighted signal intensities were higher descending scans than asending scans in both the gray and white matter. We investigated changes of perfusion-weighted signal intensities with varying several parameters in the STAR ASL method. It should require having protocol optimization processing before applying in patients. It has limitations to apply the ASL method in the white matter on a 3T MRI system.
Keyword
MeSH Terms
Figure
-
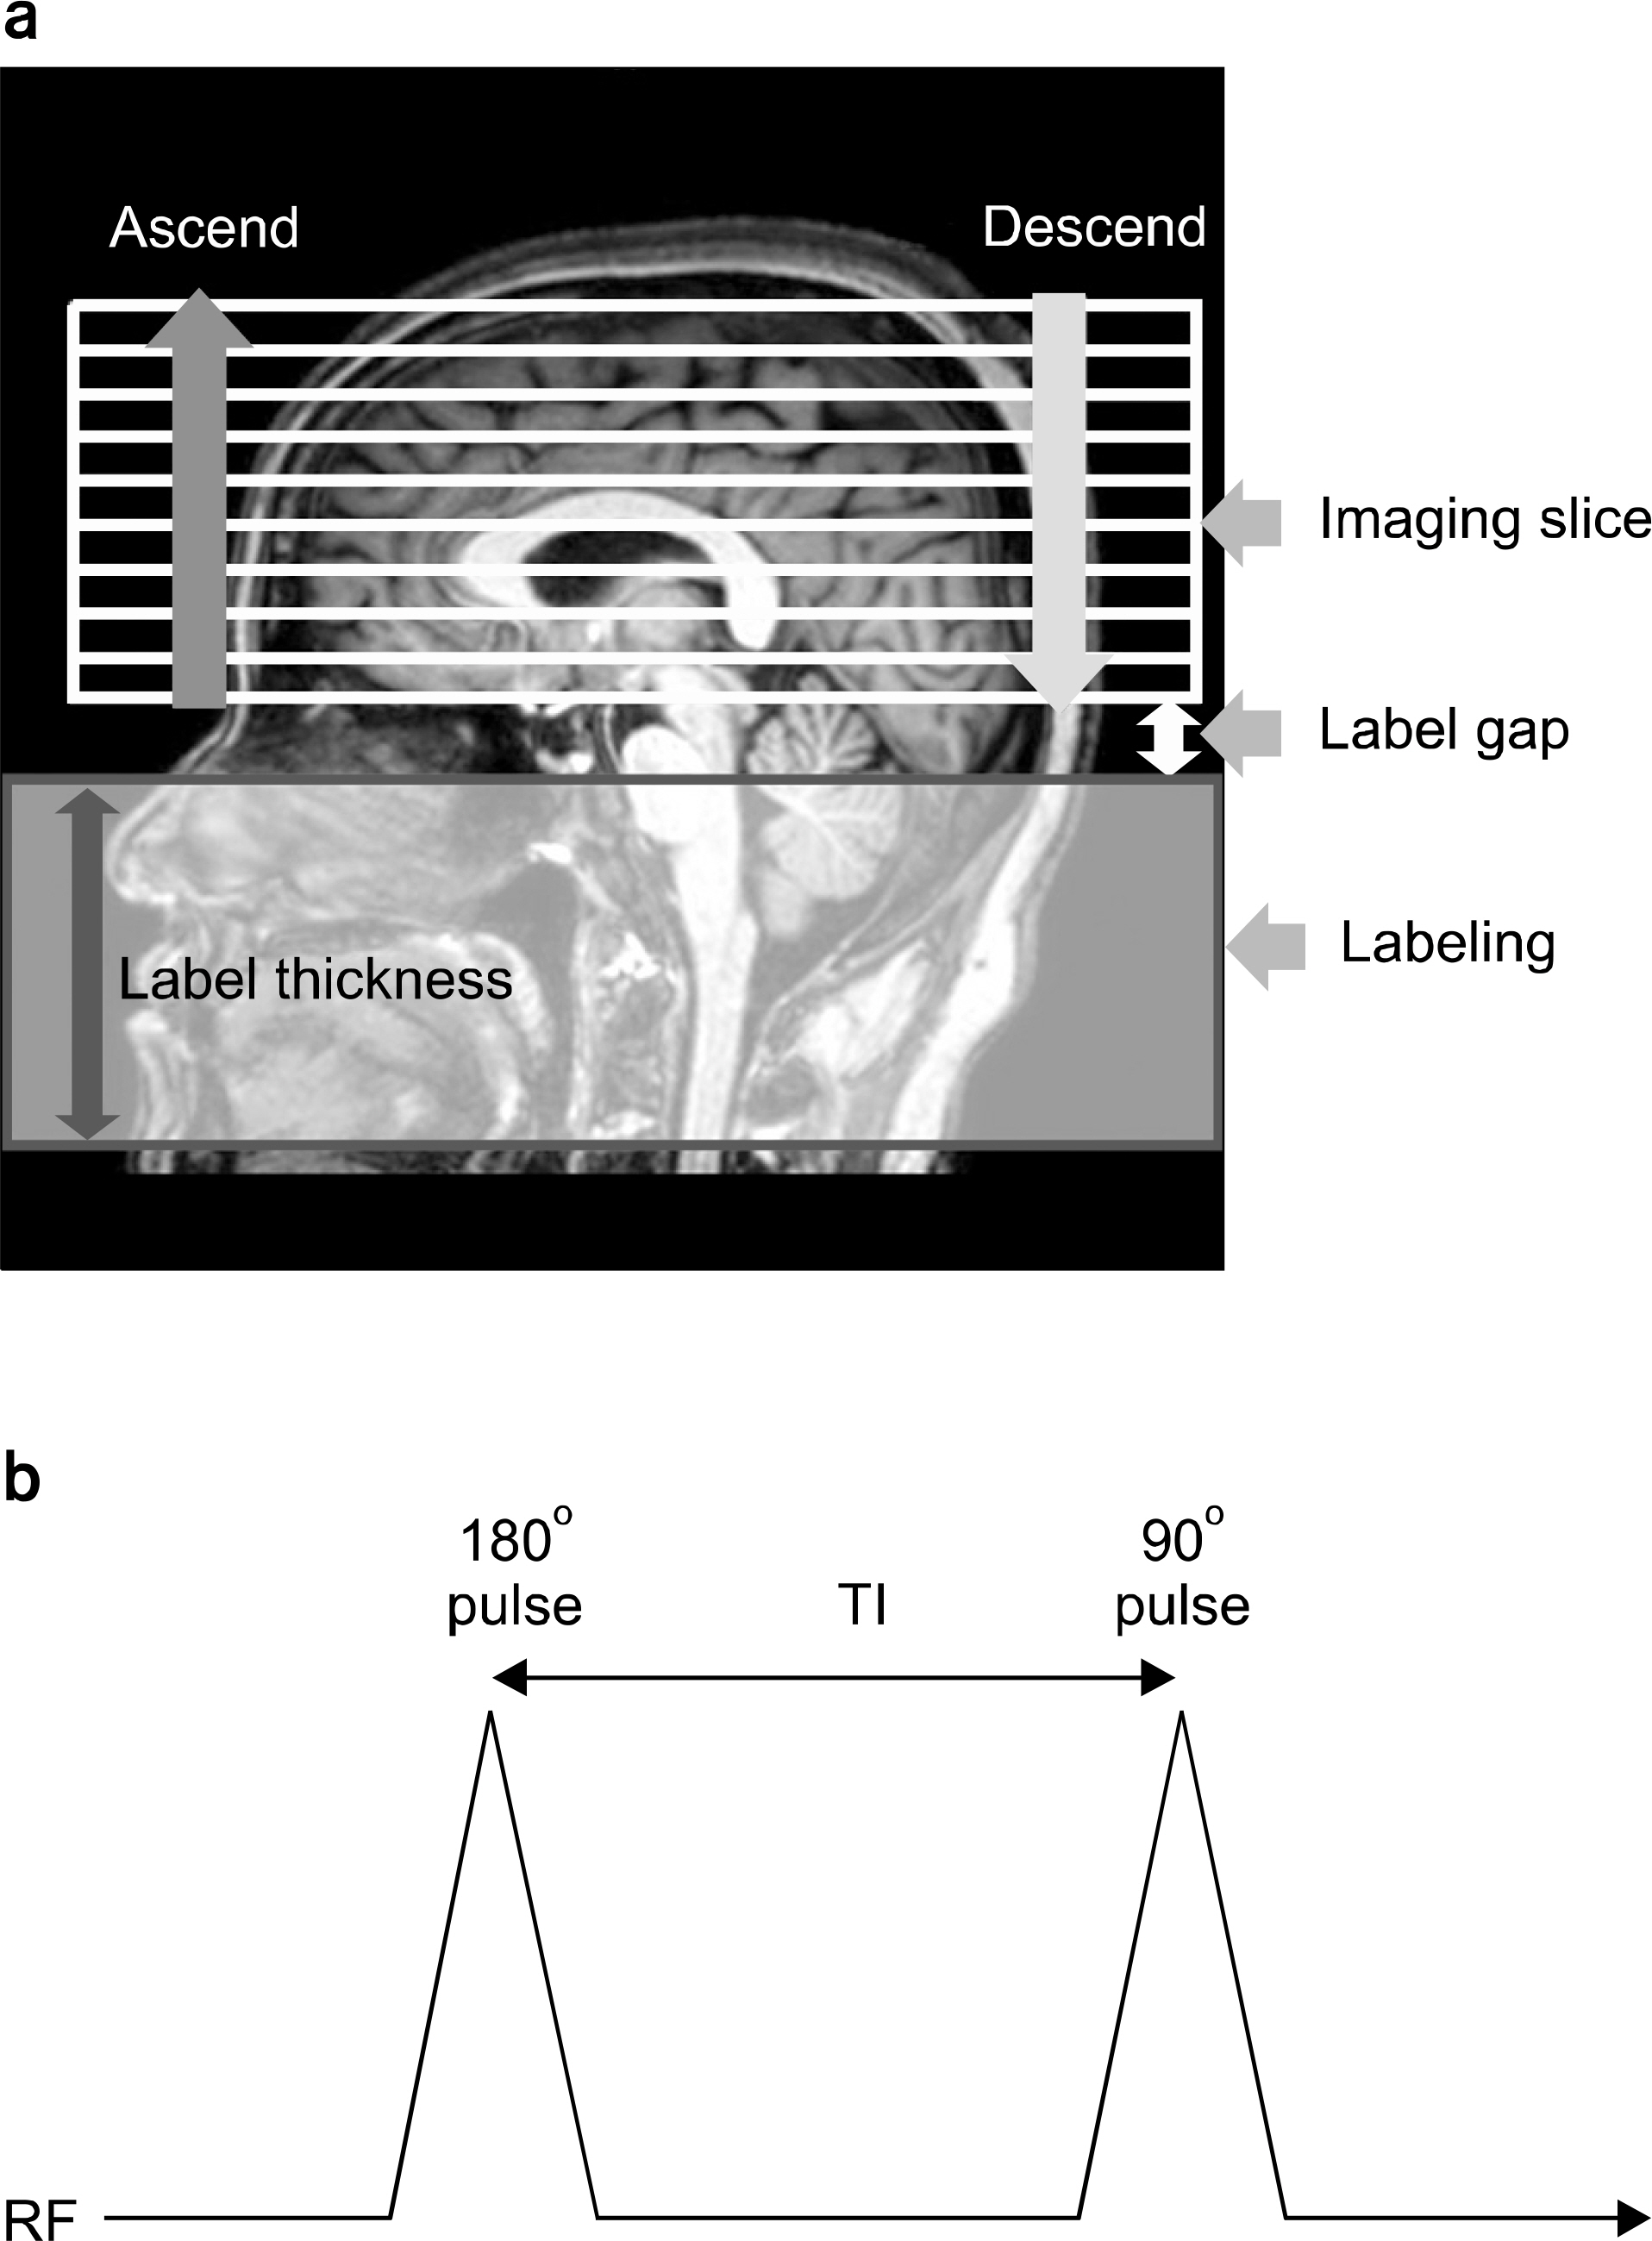
Fig. 1. Descriptions of the experimental conditions of the labeling gap, the labeling thickness, slice scan orders (a), and the labeling delay time (TI) (b).
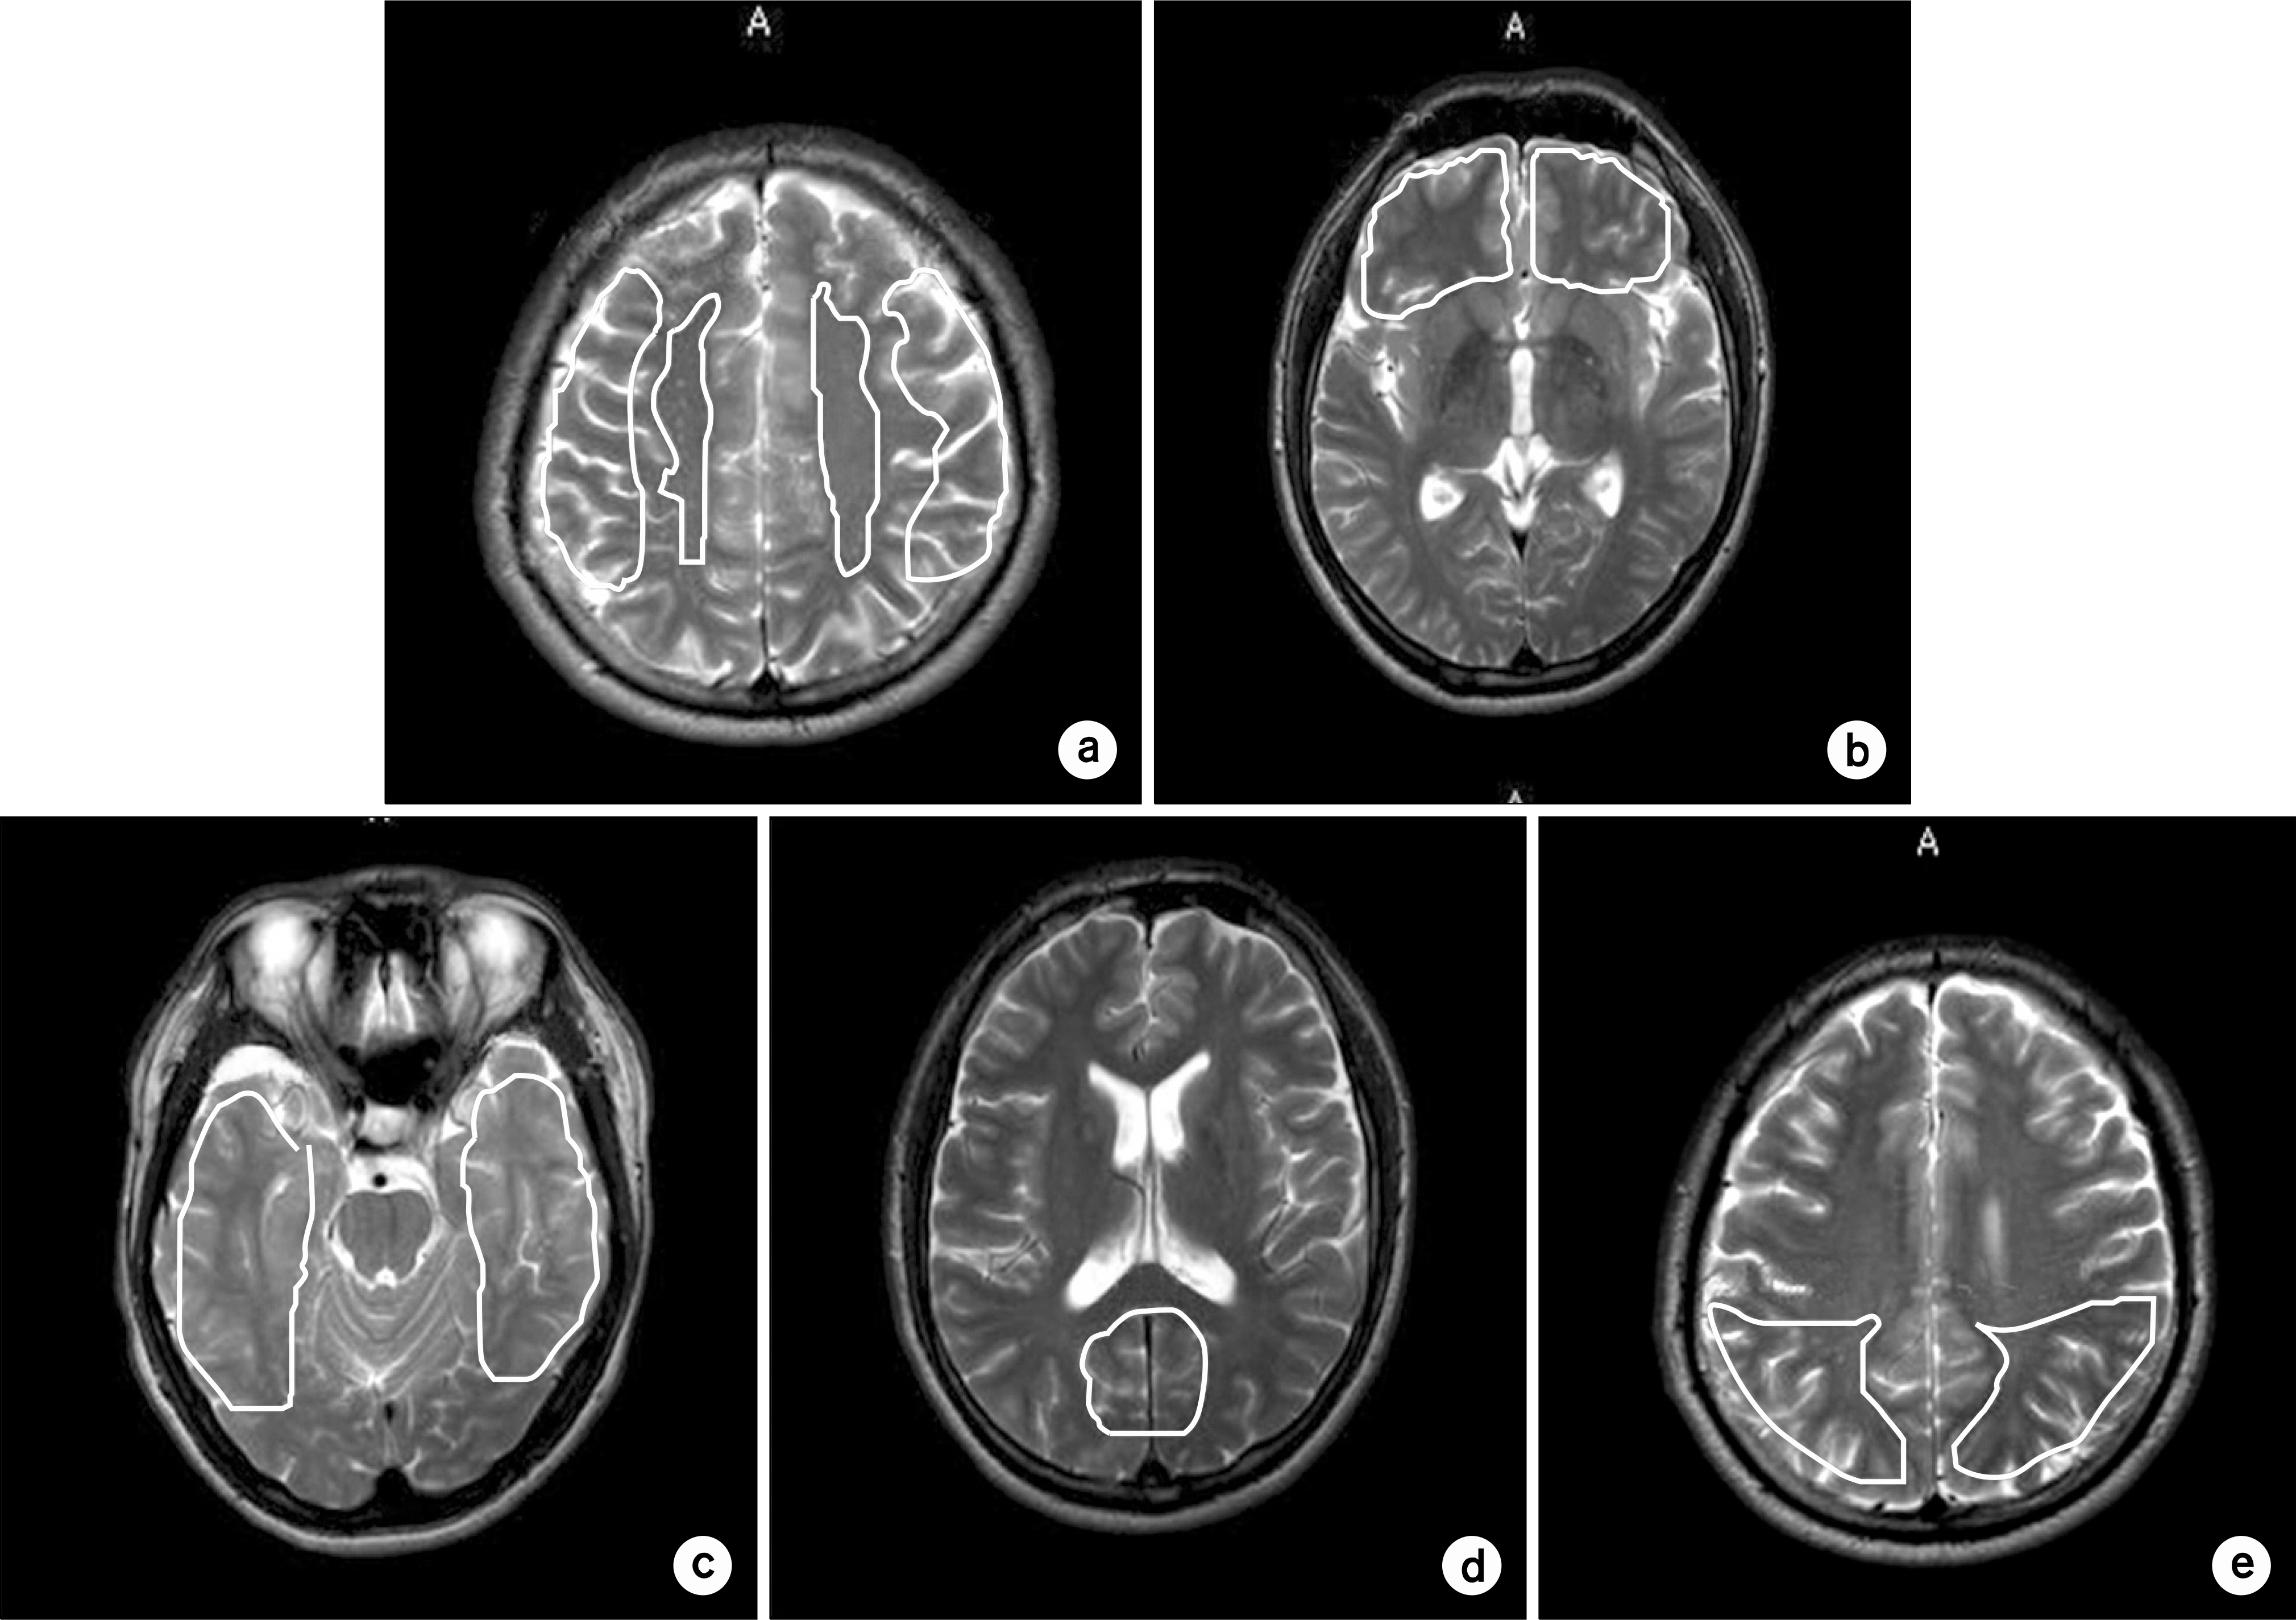
Fig. 2. Definitions of the region-of-interests (ROI) of gray matter and white matter (a), the frontal lobe (b), the temporal lobe (c), the occipital lobe (d), and the the parietal lobe (e) drawing on a T2-weighted image.
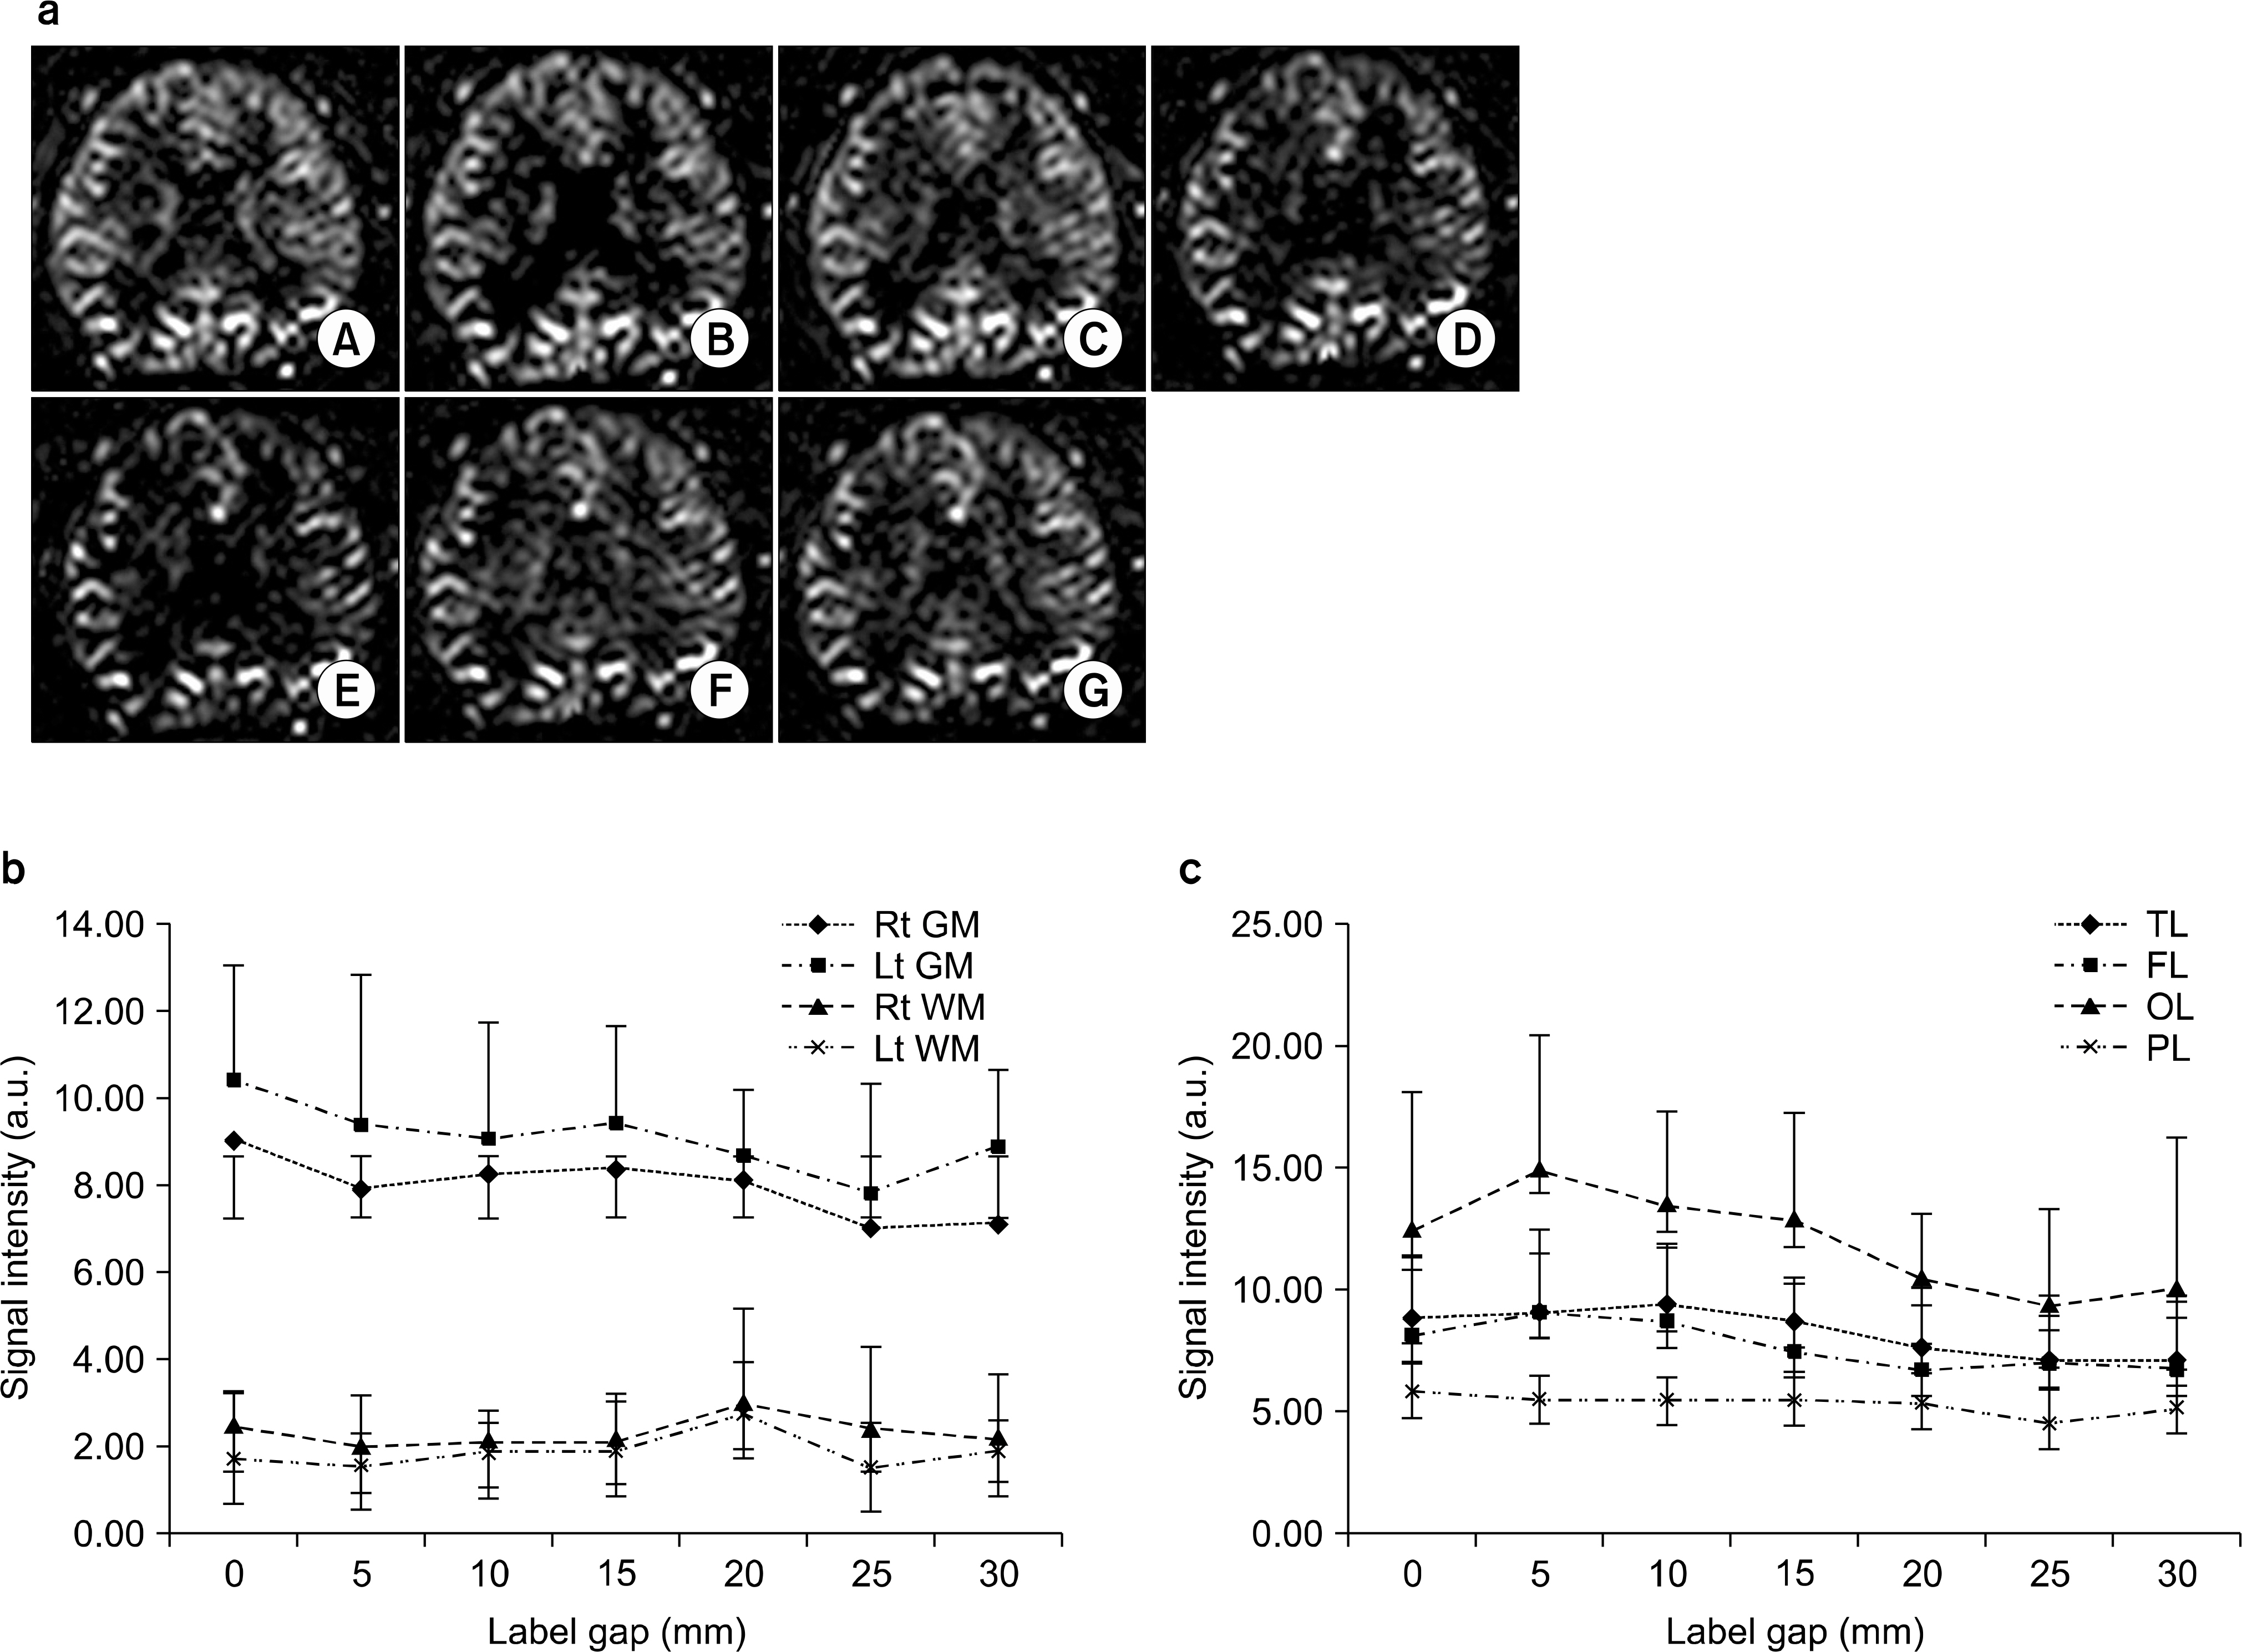
Fig. 3. Experimental results of changing the labeling gaps: perfusion-weighted images (a) and the corresponding signal-intensities in the the gray (GM) and white (WM) matters (b) and in the the frontal (FL), parietal (PL), temporal (TL), and occipital (OL) lobes (c). Rt: right; Lt: left. The labeling gaps were 0 (A), 5 (B), 10 (C), 15 (D), 20 (E), 25 (F), and 30 (G) mm in Fig. 3a. There was statistically signidicant difference between right and left signal intensities in the gray matter (p=0.0169), but not in the white matter (p=0.0510). There was statistically signidicant difference between right and left signal intensities in the parietal lobe (p=0.0417), but not in the temporal (p=0.2530) and frontal (p=0.3279) lobes.
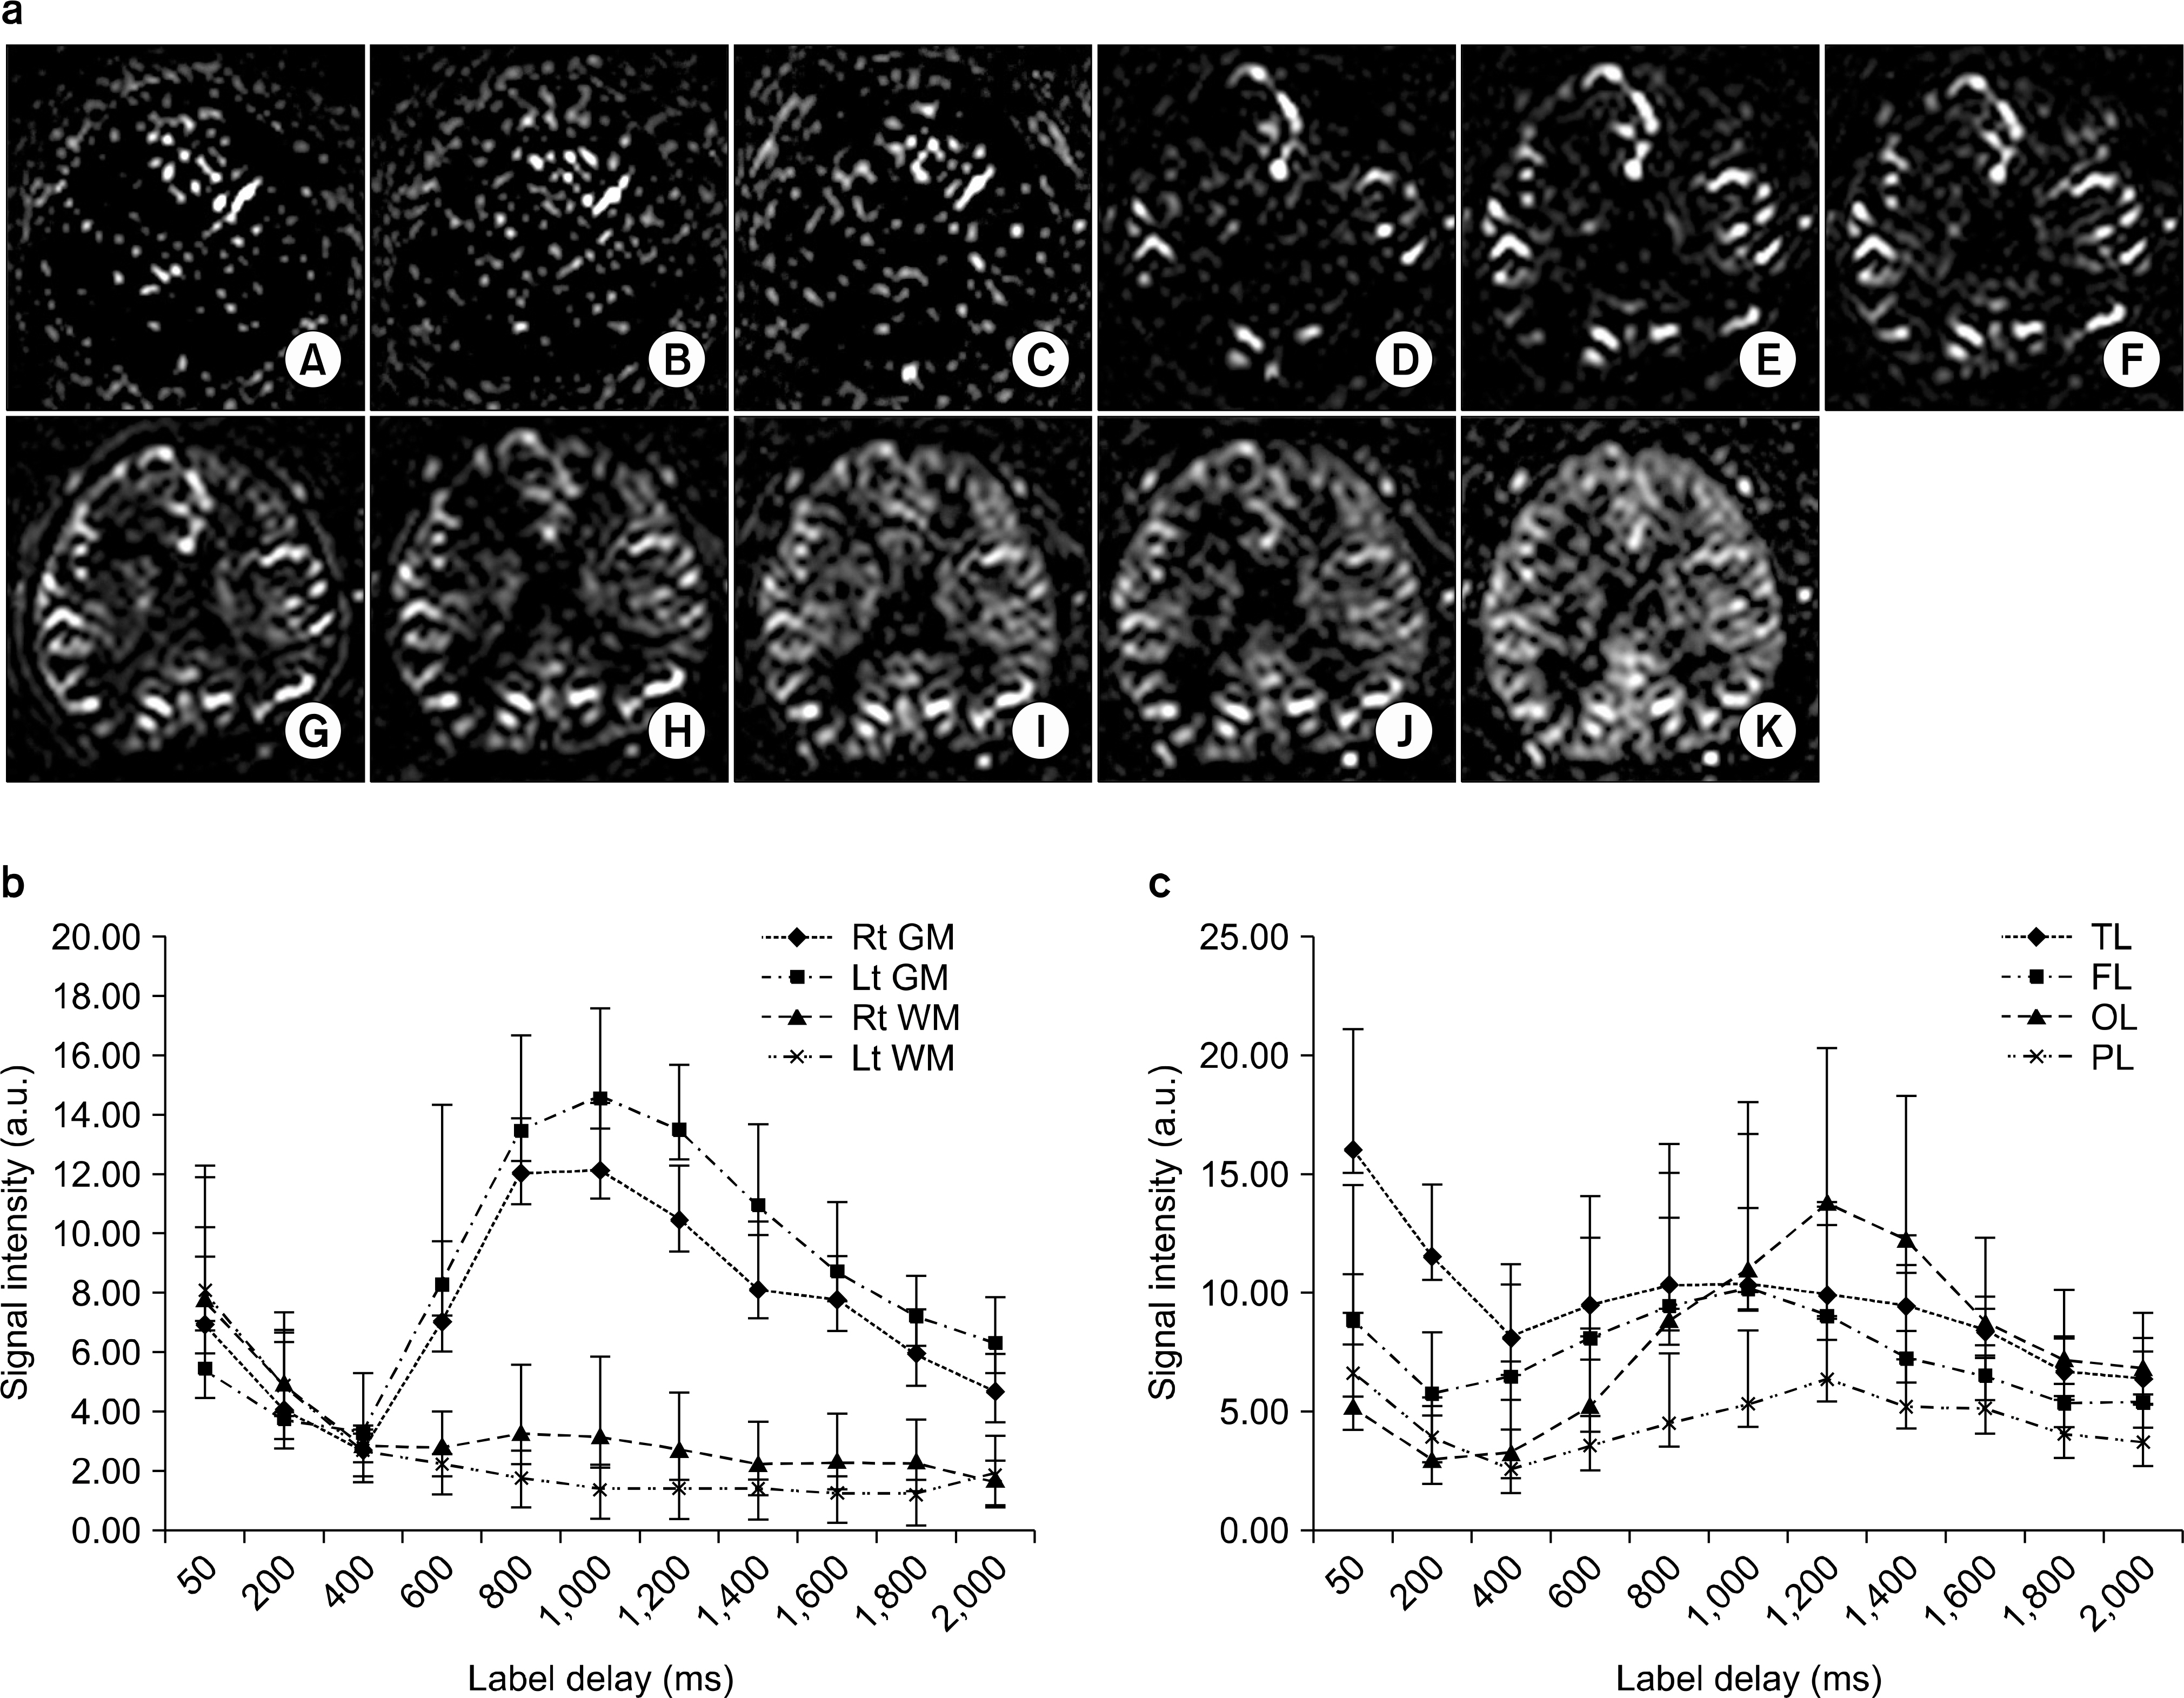
Fig. 4. Experimental results of changing the labeling delay times: perfusion-weighted images (a) and the corresponding signal intensities in the gray (GM) and white (WM) matters (b) and in the the frontal (FL), parietal (PL), temporal (TL), and occipital (OL) lobes (c). Rt: right; Lt: left. The labeling delay times were 50 (A), 200 (B), 400 (C), 600 (D), 800 (E), 1,000 (F), 1,200 (G), 1,400 (H), 1,600 (I), 1,800 (J), and 2,000 (K) ms in Fig. 4a. There was not statistically signidicant difference between right and left signal intensities in both the gray matter (p=0.4230) and the white matter (p=0.3897). There was not statistically signidicant difference between right and left signal intensities in the parietal lobe (p=0.5392), the temporal (p=0.6891) and frontal (p=0.6619) lobes.
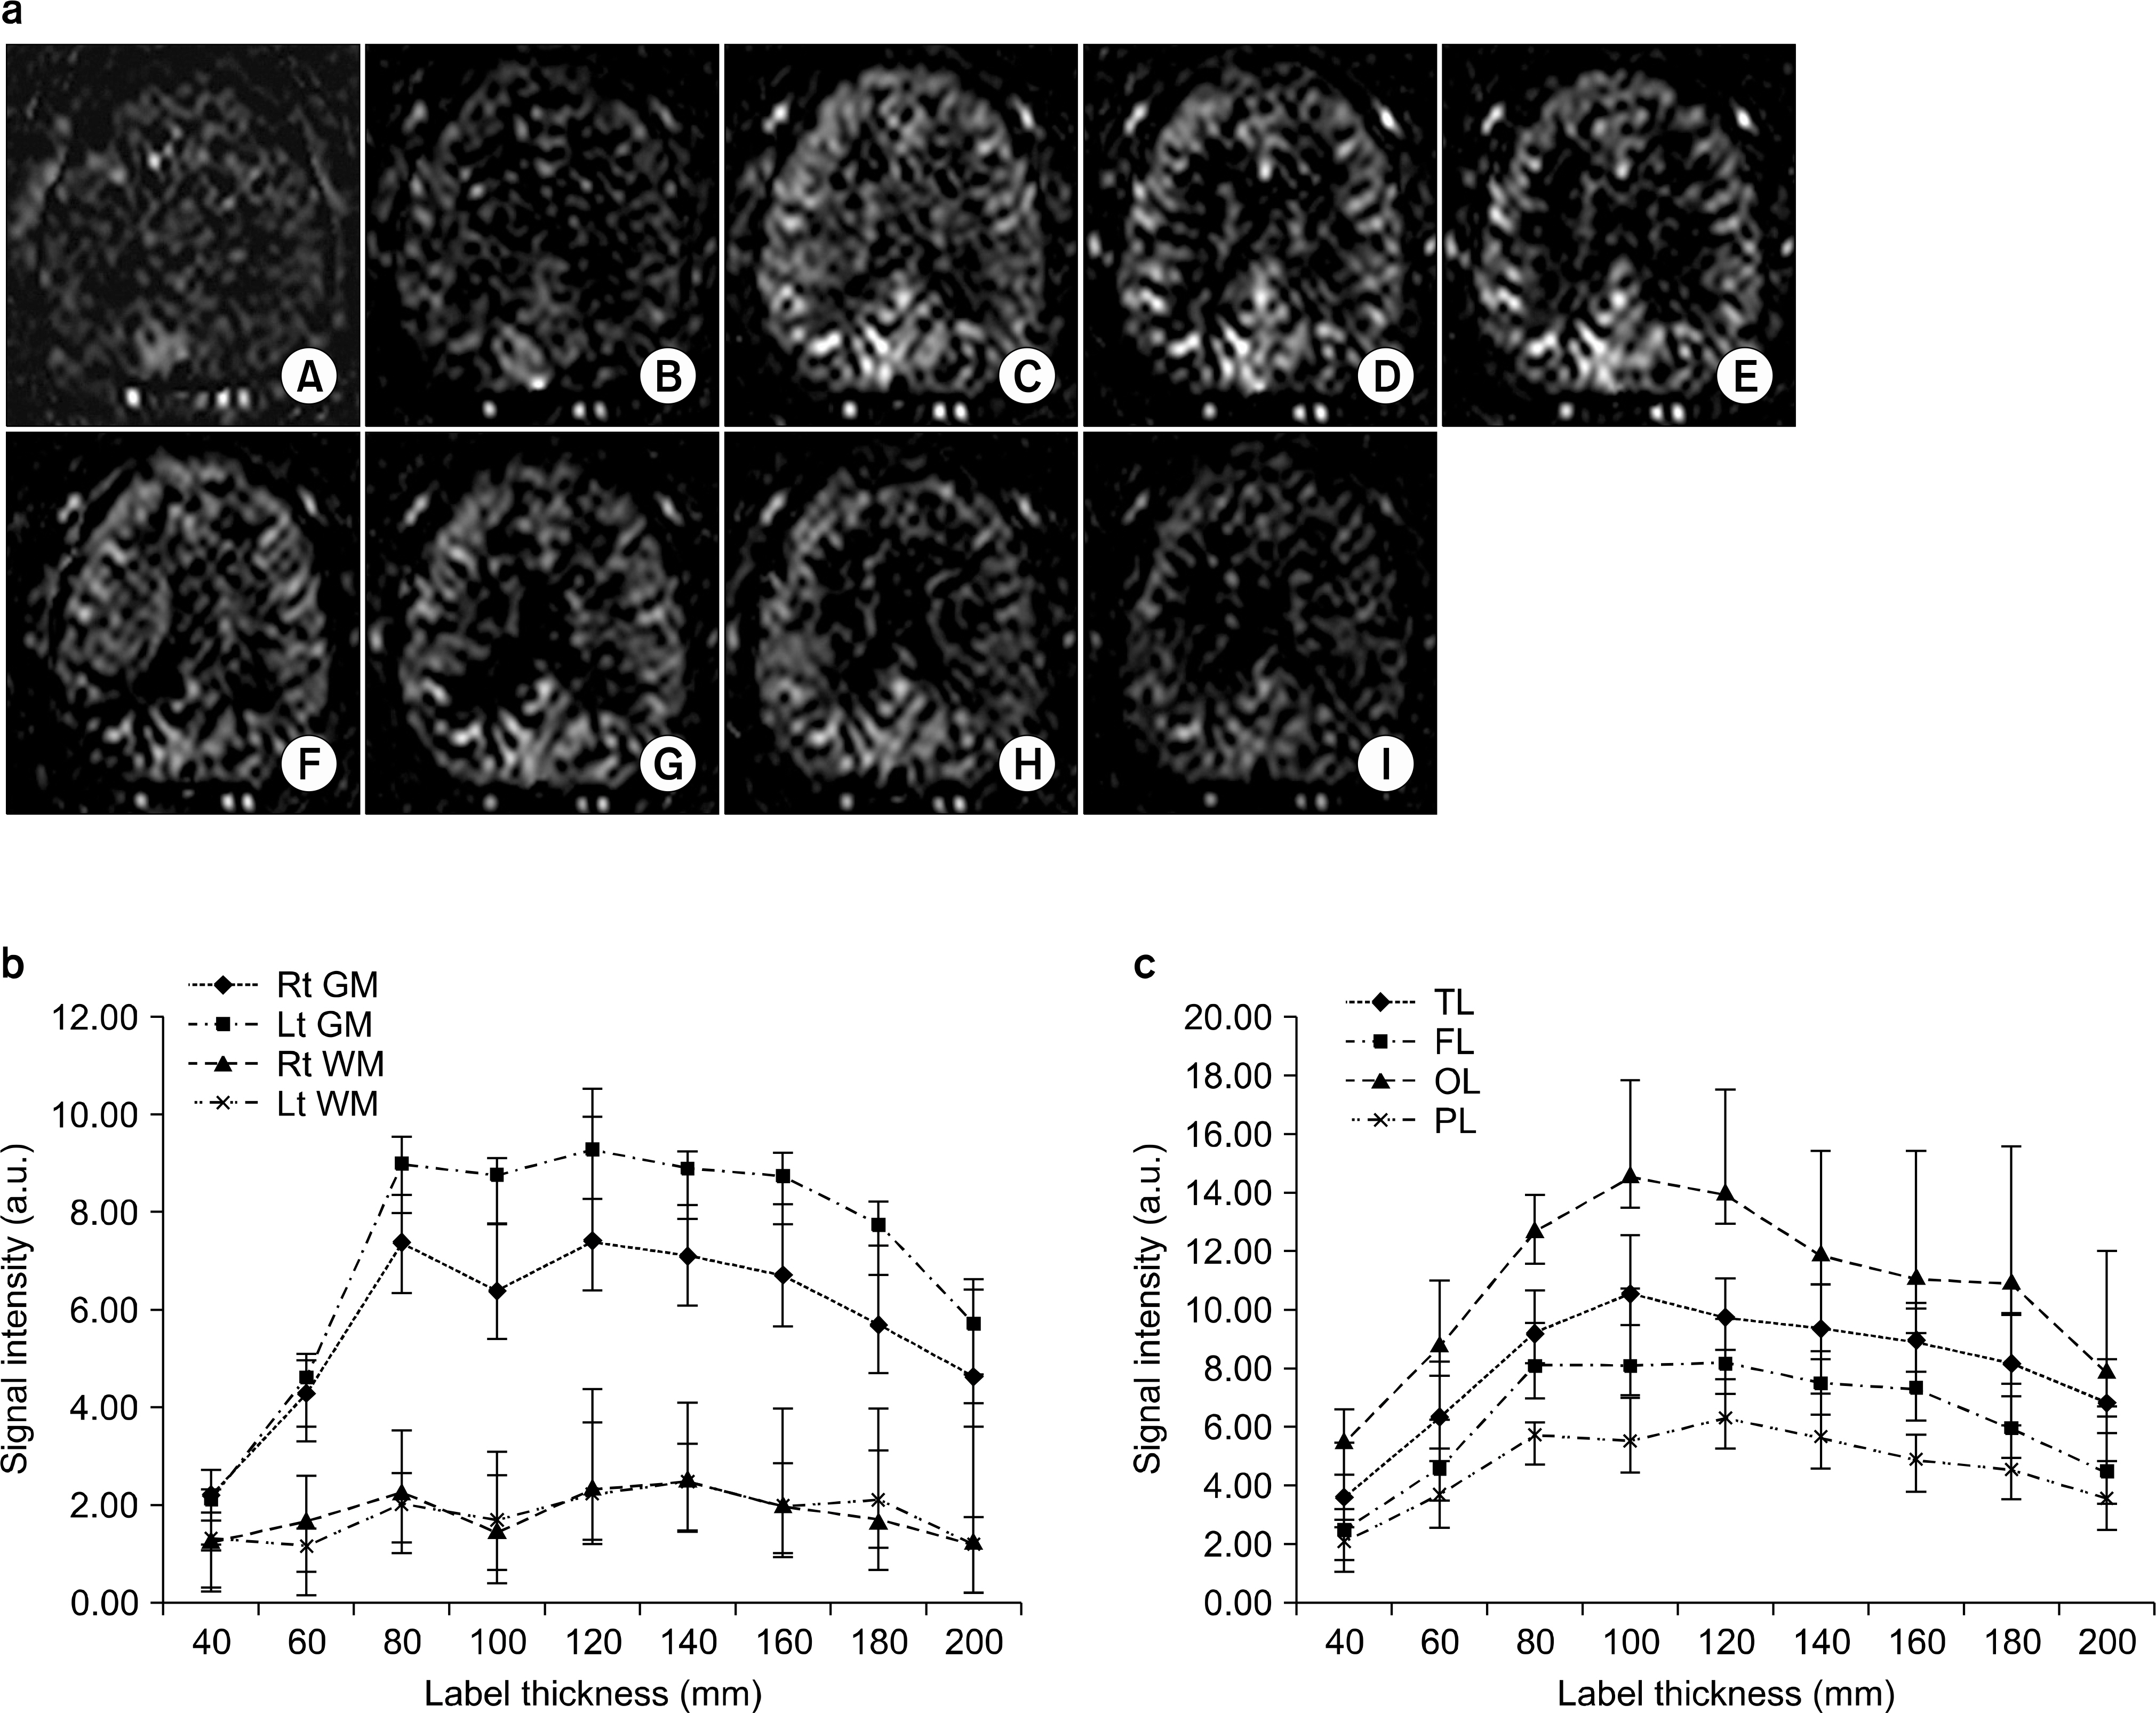
Fig. 5. Experimental results of changing the labeling thicknesses: perfusion-weighted images (a) and the corresponding signal intensities in the gray (GM) and white (WM) matters (b) and in the the frontal (FL), parietal (PL), temporal (TL), and occipital (OL) lobes (c). Rt: right; Lt: left. The labeling thicknesses were 40 (A), 60 (B), 80 (C), 100 (D), 120 (E), 140 (F), 160 (G), 180 (H), and 200 (I) mm in Fig 5a. There was not statistically signidicant difference between right and left signal intensities in both the gray matter (p=0.1713) and the white matter (p=0.9922). There was not statistically signidicant difference between right and left signal intensities in the parietal lobe (p=0.6257), the temporal (p=0.6619) and frontal (p=0.7477) lobes.
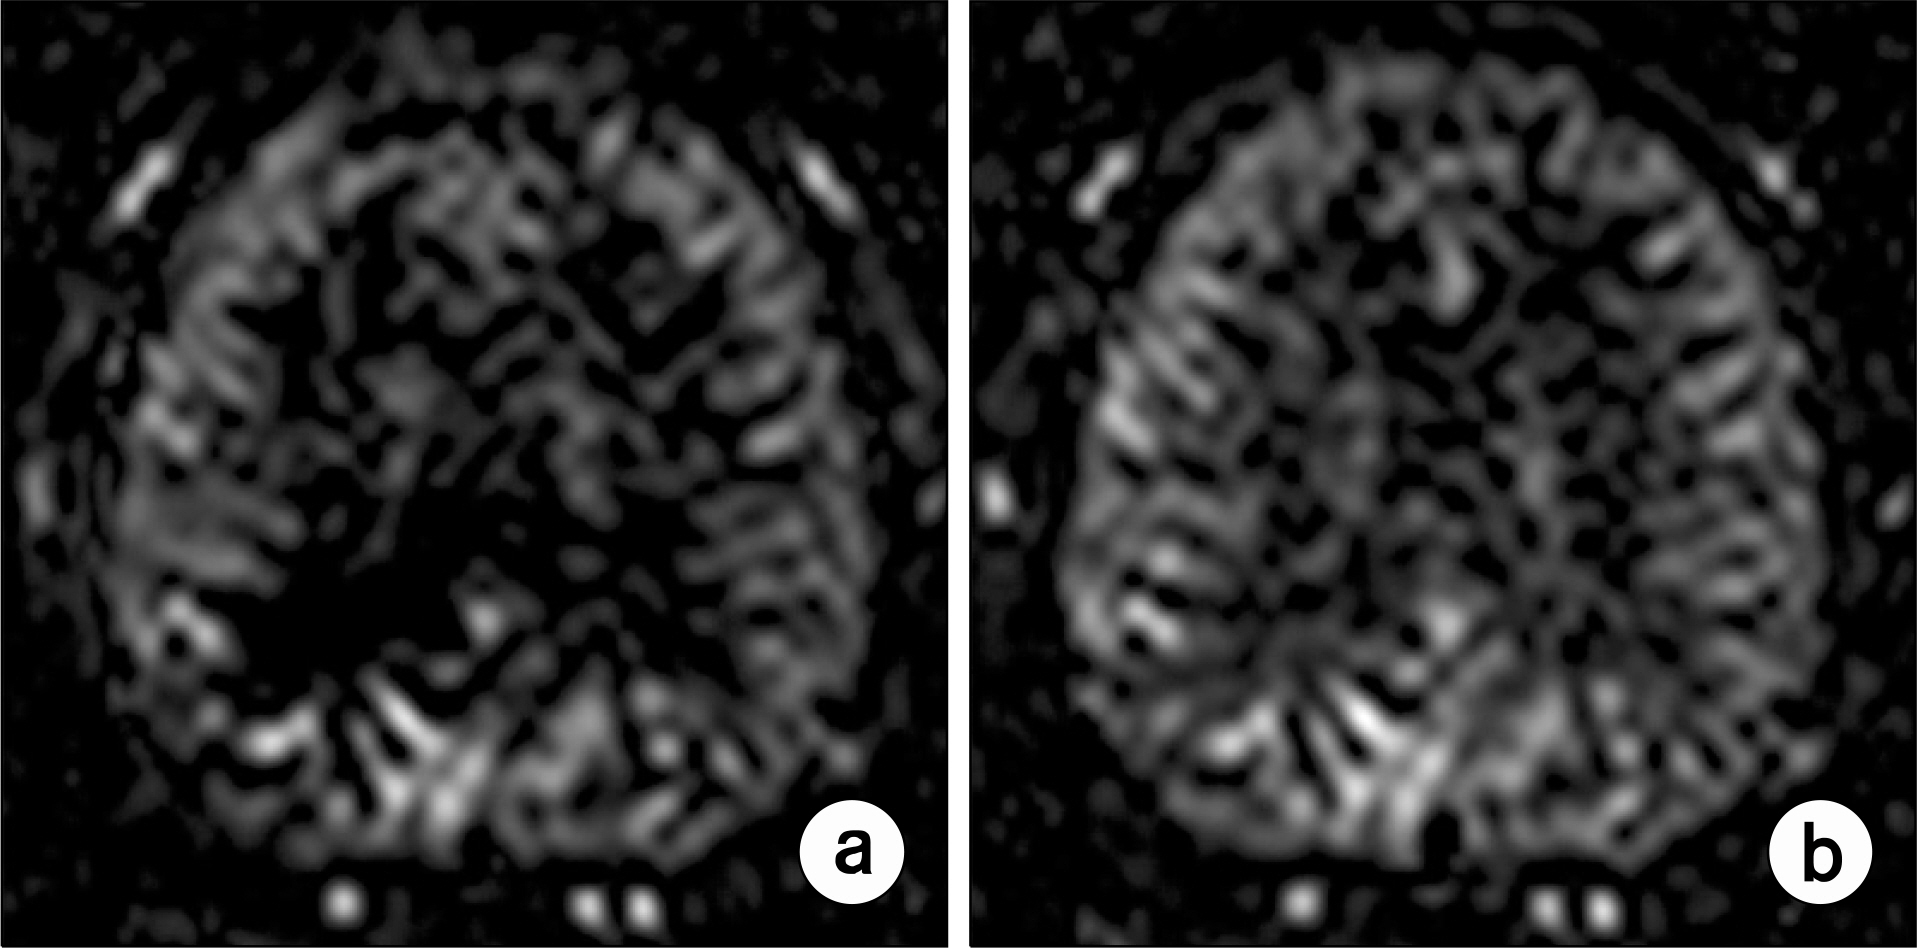
Fig. 6. Perfusion-weighted images obtained with changing the slice scan orders (a. ascend, b. descend).
Reference
-
1. Detre JA, Alsop DC. Perfusion magnetic resonance imaging with continuous arterial spin labeling: methods and clinical applications in the central nervous system. Eur J Radiol. 30(2):115–124. 1999.
Article2. Jahng GH, Kim HS, Kim SM, Ryu CW. Principles and technical aspects of perfusion magnetic resonance imaging JKSMRM. 15(2):91–101. 2011.3. Du AT, Jahng GH, Hayasaka S, et al. Hypoperfusion in frontotemporal dementia and Alzheimer disease by arterial spin labeling MRI. Neurology. 67(7):1215–1220. 2006.
Article4. Johnson NA, Jahng GH, Weiner MW, et al. Pattern of cerebral hypoperfusion in Alzheimer disease and mild cognitive impairment measured with arterial spin-labeling MR imaging: initial experience. Radiology. 234(3):851–859. 2005.
Article5. Wang J, Licht DJ, Jahng GH, et al. Pediatric perfusion imaging using pulsed arterial spin labeling. J Magn Reson Imaging. 18(4):404–413. 2003.
Article6. Cha S. Dynamic susceptibility-weighted contrast-enhanced perfusion MR imaging in pediatric patients. Neuroimaging Clin N Am. 16(1):137–147. ix. 2006.
Article7. Fatterpekar GM, Galheigo D, Narayana A, Johnson G, Knopp E. Treatment-related change versus tumor recurrence in high-grade gliomas: a diagnostic conundrum-use of dynamic susceptibility contrast-enhanced (DSC) perfusion MRI. AJR Am J Roentgenol. 198(1):19–26. 2012.
Article8. Franiel T, Hamm B, Hricak H. Dynamic contrast-enhanced magnetic resonance imaging and pharmacokinetic models in prostate cancer. Eur Radiol. 21(3):616–626. 2011.
Article9. Sourbron SP, Buckley DL. Tracer kinetic modelling in MRI: estimating perfusion and capillary permeability. Phys Med Biol. 57(2):R1–33. 2012.
Article10. Detre JA, Rao H, Wang DJ, Chen YF, Wang Z. Applications of arterial spin labeled MRI in the brain. J Magn Reson Imaging. 35(5):1026–1037. 2012.
Article11. Hendrikse J, Petersen ET, Golay X. Vascular disorders: insights from arterial spin labeling. Neuroimaging Clin N Am. 22(2):259–269. x-xi. 2012.
Article12. Wolk DA, Detre JA. Arterial spin labeling MRI: an emerging biomarker for Alzheimer's disease and other neurodegenerative conditions. Curr Opin Neurol. 25(4):421–428. 2012.13. Zaharchuk G. Arterial spin label imaging of acute ischemic stroke and transient ischemic attack. Neuroimaging Clin N Am. 21(2):285–301. x. 2011.
Article14. Wu WC, St Lawrence KS, Licht DJ, Wang DJ. Quantification issues in arterial spin labeling perfusion magnetic resonance imaging. Top Magn Reson Imaging. 21(2):65–73. 2010.
Article15. Liu Y, Zhu X, Feinberg D, et al. Arterial spin labeling MRI study of age and gender effects on brain perfusion hemodynamics. Magn Reson Med. 68(3):912–922. 2012.
Article16. Kim HG, Jahng GH, Oh CH. Simulations of perfusion signals of pulsed arterial spin labeling MRI. JKSMRM. 15(3):191–198. 2011.
Article17. Jahng GH. Practical considerations of arterial spin labeling MRI for measuring the multislice perfusion in the human brain. Korean J Med Phys. 18(1):35–41. 2007.18. Edelman RR, Chen Q. EPISTAR MRI: multislice mapping of cerebral blood flow. Magn Reson Med. 40(6):800–805. 1998.
Article19. Edelman RR, Siewert B, Darby DG, Thangaraj V, Nobre AC, Mesulam MM, Warach S. Qualitative mapping of cerebral blood flow and functional localization with echo-planar MR imaging and signal targeting with alternating radio frequency. Radiology. 192(2):513–520. 1994.
Article20. Petersen ET, Lim T, Golay X. Model-free arterial spin labeling quantification approach for perfusion MRI. Magn Reson Med. 55(2):219–232. 2006.
Article21. Dai W, Garcia D, de Bazelaire C, Alsop DC. Continuous flow-driven inversion for arterial spin labeling using pulsed radio frequency and gradient fields. Magn Reson Med. 60(6):1488–1497. 2008.
Article
- Full Text Links
-
- Actions
-
Cited
- CITED
-
- Close
- Share
-
- Similar articles
-
- Practical Considerations of Arterial Spin Labeling MRI for Measuring the Multi-slice Perfusion in the Human Brain
- Simulations of Perfusion Signals of Pulsed Arterial Spin Labeling MRI
- Arterial Spin Labeling Perfusion MRI Signal Processing Through Traditional Methods and Machine Learning
- Perfusion Hyperintensities in Patients With Seizures: Evaluation With Arterial Spin Labeling Magnetic Resonance Imaging Within 24 Hours After Onset
- Pseudo Continuous Arterial Spin Labeling MR Imaging of Status Epilepticus
