Simulations of Perfusion Signals of Pulsed Arterial Spin Labeling MRI
- Affiliations
-
- 1Department of Radiology, Kyung Hee University Hospital at Gangdong, School of Medicine, Kyung Hee University, Korea. ghjahng@gmail.com
- 2Department of Electronics and Information Engineering, Korea University, Korea.
- KMID: 2000047
- DOI: http://doi.org/10.13104/jksmrm.2011.15.3.191
Abstract
- PURPOSE
A pulsed arterial spin labeling (PASL) signal usually depends on several parameters. The objective of this study was to determine the optimal parameters using simulation for perfusion signals of PASL magnetic resonance imaging (MRI).
MATERIALS AND METHODS
Perfusion signals, DeltaM/M(0b), derived from the Bloch equation were evaluated in regard to the four most important parameters in PASL MRI: the tissue-to-blood coefficient (lambda), the longitudinal relaxation time of blood (T(1b)), the arterial transit delay from the application of tag (deltat), and the magnetic field strength (B0). The simulation was conducted with Mathematica software.
RESULTS
First, perfusion signals differed depending on the value of lambda in brain tissue. The maximum signal, DeltaM/M(0b) = 0.390, was obtained at an inversion time (TI) = 1.53 sec for gray matter on 3T MRI. Second, perfusion signals were reduced with increasing deltat. The maximum signal, DeltaM/M0b = 0.526, was obtained at TI = 2.1 sec for deltat = 0.5 sec. Finally, perfusion signals increased with increasing B0. The maximum signal, DeltaM = 1.15, was obtained at TI = 1.52 sec for 3T MRI.
CONCLUSION
We reported that the optimized TI values were obtained to provide the highest PASL signals. It is very important that optimized TI values be used to obtain high-quality perfusion signals using PASL MRI.
Figure
-
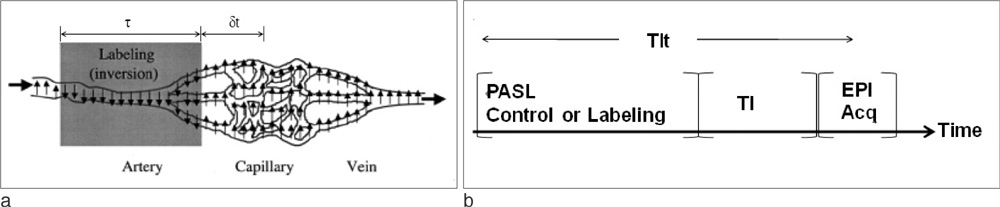
Fig. 1 Schematic illustration of the labeling of the spins in the arteries (1a) and schematic of the PASL pulse sequence (1b). τ is the duration of the arrival of labeled water molecules at the tissue. δt is the delay of water molecules between arterial labeling and exchange into tissue. TIt is the total labeling delay time, which is the time interval from the center of the labeling radiofrequency pulse and the center of the excitation pulse.
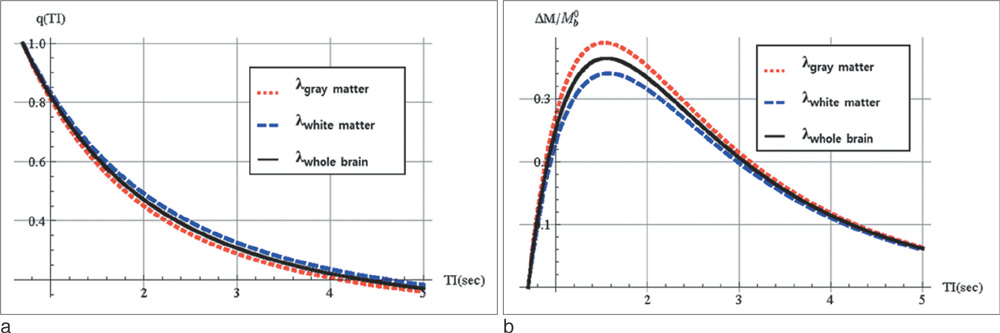
Fig. 2 Simulation results of the q-factor (2a) and perfusion signals (2b) depended on three different values of tissue-to-blood partition coefficient (λ). Whole brain (Solid line), gray matter (Dotted line), and white matter (Dashed line) Other parameters were used for T1b = 1.6 sec, δt = 0.7 sec, and α = 1 at 3T.
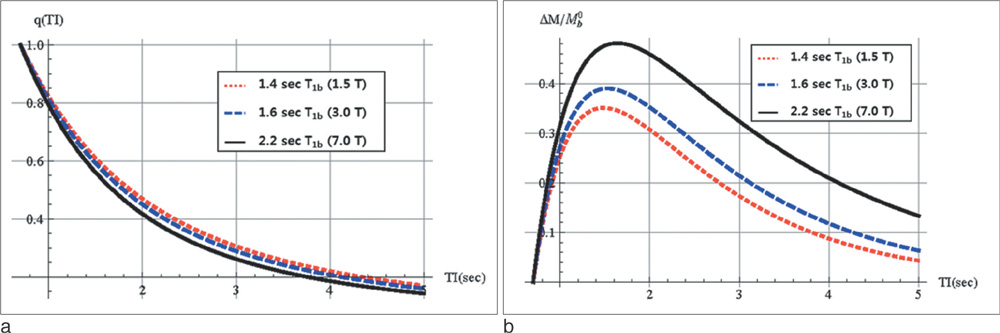
Fig. 3 Simulation results of the q-factor (3a) and perfusion signals (3b) depended on the longitudinal relaxation time of blood (T1b) T1b at 1.5T (Dotted line), at 3T (Dashed line), and at 7T (Solid line) Other parameters were used for λgm = 1.05 ml/g, δt = 0.7 sec, and α = 1 at 3T. T1b values were 1.4 sec, 1.6 sec, and 2.2 sec, for 1.5T, 3.0T, and 7.0T respectively.
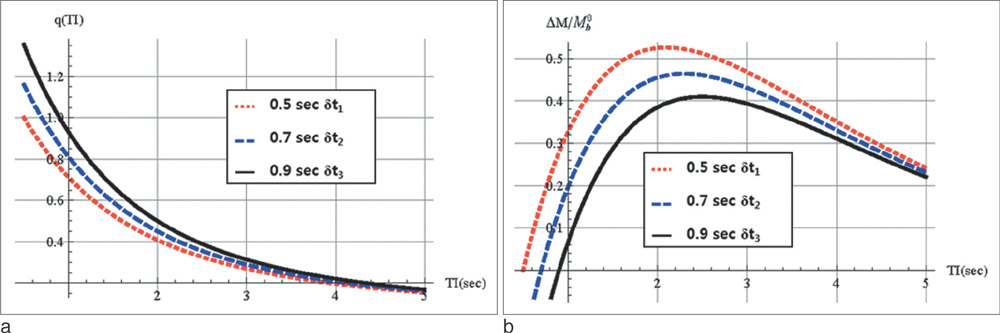
Fig. 4 Simulation results of the q-factor (4a) and perfusion signals (4b) depended on the arterial transit delay (δt). δt at 0.5 sec (Solid line, Black), at 0.7 sec (Dotted line, Red), and at 0.9 sec (Dashed line, Blue) Other parameters were used for λgm = 1.05 ml/g, T1b = 1.6 sec, and α = 1 at 3T.
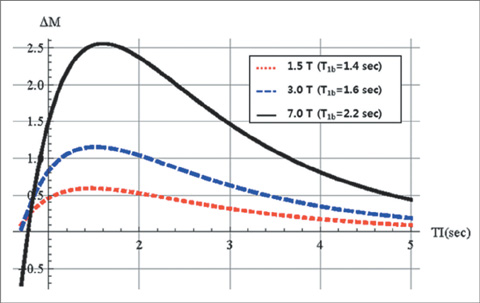
Fig. 5 Simulation results of perfusion signals (5) depended on the strength of the magnetic field (M0b). 1.5T (Solid line), 3T (Dotted line), and 7T (Dashed line) Other parameters were used for λgm = 1.05 ml/g, δt = 0.7 sec, and α = 1. T1b values were 1.4 sec, 1.6 sec, and 2.2 sec, for 1.5T, 3.0T, and 7.0T, respectively.
Cited by 2 articles
-
Advances in magnetic resonance technique for tumor imaging
Dong Woo Park
J Korean Med Assoc. 2015;58(6):516-522. doi: 10.5124/jkma.2015.58.6.516.Investigation of Perfusion-weighted Signal Changes on a Pulsed Arterial Spin Labeling Magnetic Resonance Imaging Technique: Dependence on the Labeling Gap, Delay Time, Labeling Thickness, and Slice Scan Order
Jae-Hoo Byun, Myung-Hwan Park, Ji-Yeon Kang, Jin-Wan Lee, Kang-Won Lee, Geon-Ho Jahng
Prog Med Phys. 2013;24(2):108-118. doi: 10.14316/pmp.2013.24.2.108.
Reference
-
1. Detre JA, Wang J, Wang Z, Rao H. Arterial spin-labeled perfusion MRI in basic and clinical neuroscience. Curr Opin Neurol. 2009. 22:348–355.2. Luypaert R, Boujraf S, Sourbron S, Osteaux M. Diffusion and perfusion MRI: basic physics. Eur J Radiol. 2001. 38:19–27.3. Jahng GH, Kim HS, Kim SM, Ryu CW. Principles and technical aspects of perfusion magnetic resonance imaging. J Korean Soc Magn Reson Med. 2011. 15:91–101.4. Le Bihan D, Breton E, Lallemand D, Grenier P, Cabanis E, Laval-Jeantet M. MR imaging of intravoxel incoherent motions: application to diffusion and perfusion in neurologic disorders. Radiology. 1986. 161:401–407.5. Detre JA, Leigh JS, Williams DS, Koretsky AP. Perfusion imaging. Magn Reson Med. 1992. 23:37–45.6. Golay X, Hendrikse J, Lim TC. Perfusion imaging using arterial spin labeling. Top Magn Reson Imaging. 2004. 15:10–27.7. Wong EC, Buxton RB, Frank LR. Implementation of quantitative perfusion imaging techniques for functional brain mapping using pulsed arterial spin labeling. NMR Biomed. 1997. 10:237–249.8. Williams DS, Detre JA, Leigh JS, Koretsky AP. Magnetic resonance imaging of perfusion using spin inversion of arterial water. Proc Natl Acad Sci U S A. 1992. 89:212–216.9. Edelman RR, Siewert B, Darby DG, Thangaraj V, Nobre AC, Mesulam MM, Warach S. Qualitative mapping of cerebral blood flow and functional localization with echo-planar MR imaging and signal targeting with alternating radio frequency. Radiology. 1994. 192:513–520.10. Edelman RR, Chen Q. EPISTAR MRI: multislice mapping of cerebral blood flow. Magn Reson Med. 1998. 40:800–805.11. Kwong KK, Chesler DA, Weisskoff RM, Donahue KM, Davis TL, Ostergaard L, Campbell TA, Rosen BR. MR perfusion studies with T1-weighted echo planar imaging. Magn Reson Med. 1995. 34:878–887.12. Kim SG. Quantification of relative cerebral blood flow change by flow-sensitive alternating inversion recovery (FAIR) technique: application to functional mapping. Magn Reson Med. 1995. 34:293–301.13. Jahng GH, Zhu XP, Matson GB, Weiner MW, Schuff N. Improved perfusion-weighted MRI by a novel double inversion with proximal labeling of both tagged and control acquisitions. Magn Reson Med. 2003. 49:307–314.14. Jahng GH, Weiner MW, Schuff N. Improved arterial spin labeling method: applications for measurements of cerebral blood flow in human brain at high magnetic field MRI. Med Phys. 2007. 34:4519–4525.15. Jahng GH. Practical considerations of arterial spin labeling MRI for measuring the multi-slice perfusion in the human brain. Korean J Med Phys. 2007. 18:35–41.16. Alsop DC, Detre JA. Reduced transit-time sensitivity in noninvasive magnetic resonance imaging of human cerebral blood flow. J Cereb Blood Flow Metab. 1996. 16:1236–1249.17. Wong EC, Buxton RB, Frank LR. A theoretical and experimental comparison of continuous and pulsed arterial spin labeling techniques for quantitative perfusion imaging. Magn Reson Med. 1998. 40:348–355.18. Buxton RB, Frank LR, Wong EC, Siewert B, Warach S, Edelman RR. A general kinetic model for quantitative perfusion imaging with arterial spin labeling. Magn Reson Med. 1998. 40:383–396.19. Herscovitch P, Raichle ME. What is the correct value for the brain--blood partition coefficient for water? J Cereb Blood Flow Metab. 1985. 5:65–69.20. Weaver BM, Staddon GE, Mapleson WW. Tissue/blood and tissue/water partition coefficients for propofol in sheep. Br J Anaesth. 2001. 86:693–703.21. Barth M, Moser E. Proton NMR relaxation times of human blood samples at 1.5 T and implications for functional MRI. Cell Mol Biol (Noisy-le-grand). 1997. 43:783–791.22. Varela M, Hajnal JV, Petersen ET, Golay X, Merchant N, Larkman DJ. A method for rapid in vivo measurement of blood T1. NMR Biomed. 2011. 24:80–88.23. Stanisz GJ, Odrobina EE, Pun J, Escaravage M, Graham SJ, Bronskill MJ, Henkelman RM. T1, T2 relaxation and magnetization transfer in tissue at 3T. Magn Reson Med. 2005. 54:507–512.24. Dobre MC, Ugurbil K, Marjanska M. Determination of blood longitudinal relaxation time (T1) at high magnetic field strengths. Magn Reson Imaging. 2007. 25:733–735.25. Roberts DA, Rizi R, Lenkinski RE, Leigh JS Jr. Magnetic resonance imaging of the brain: blood partition coefficient for water: application to spin-tagging measurement of perfusion. J Magn Reson Imaging. 1996. 6:363–366.26. Calamante F, Williams SR, van Bruggen N, Kwong KK, Turner R. A model for quantification of perfusion in pulsed labelling techniques. NMR Biomed. 1996. 9:79–83.27. Lu H, Clingman C, Golay X, van Zijl PC. Determining the longitudinal relaxation time (T1) of blood at 3.0 Tesla. Magn Reson Med. 2004. 52:679–682.28. Silvennoinen MJ, Kettunen MI, Kauppinen RA. Effects of hematocrit and oxygen saturation level on blood spin-lattice relaxation. Magn Reson Med. 2003. 49:568–571.29. Zhernovoi AI, Sharshina LM. Effects of hematocrit on blood proton relaxation time. Med Tekh. 1997. 33–34.
- Full Text Links
-
- Actions
-
Cited
- CITED
-
- Close
- Share
-
- Similar articles
-
- Investigation of Perfusion-weighted Signal Changes on a Pulsed Arterial Spin Labeling Magnetic Resonance Imaging Technique: Dependence on the Labeling Gap, Delay Time, Labeling Thickness, and Slice Scan Order
- Practical Considerations of Arterial Spin Labeling MRI for Measuring the Multi-slice Perfusion in the Human Brain
- Arterial Spin Labeling Perfusion MRI Signal Processing Through Traditional Methods and Machine Learning
- Monitoring Cerebral Perfusion Changes Using Arterial Spin-Labeling Perfusion MRI after Indirect Revascularization in Children with Moyamoya Disease
- Perfusion Magnetic Resonance Imaging: A Comprehensive Update on Principles and Techniques
