J Korean Ophthalmol Soc.
2013 Jun;54(6):902-912. 10.3341/jkos.2013.54.6.902.
Usefulness of Automated Measurements of Localized Retinal Nerve Fiber Layer Defects Area Using Significance Map
- Affiliations
-
- 1Department of Ophthalmology, Ajou University School of Medicine, Suwon, Korea. KBUhm@hanyang.ac.kr
- KMID: 2217266
- DOI: http://doi.org/10.3341/jkos.2013.54.6.902
Abstract
- PURPOSE
To evaluate the usefulness of automated measurements of the localized retinal nerve fiber layer (RNFL) defects area in patients with glaucoma.
METHODS
Fifty one patients with localized RNFL defects in RNFL red-free photographs and 53 healthy subjects were included. All participants were imaged with 3D spectral-domain optical coherence tomography (OCT). The area of defects was measured with the RNFL significance map (red = p < 1% and yellow = p < 5%) using Image J manually and Matlab software automatically. The area under the receiver operating characteristic curve (AUC) was calculated for the RNFL defect area of the RNFL photograph and RNFL maps, circumpapillary RNFL thickness, optic disc parameter, and macular inner retina thickness.
RESULTS
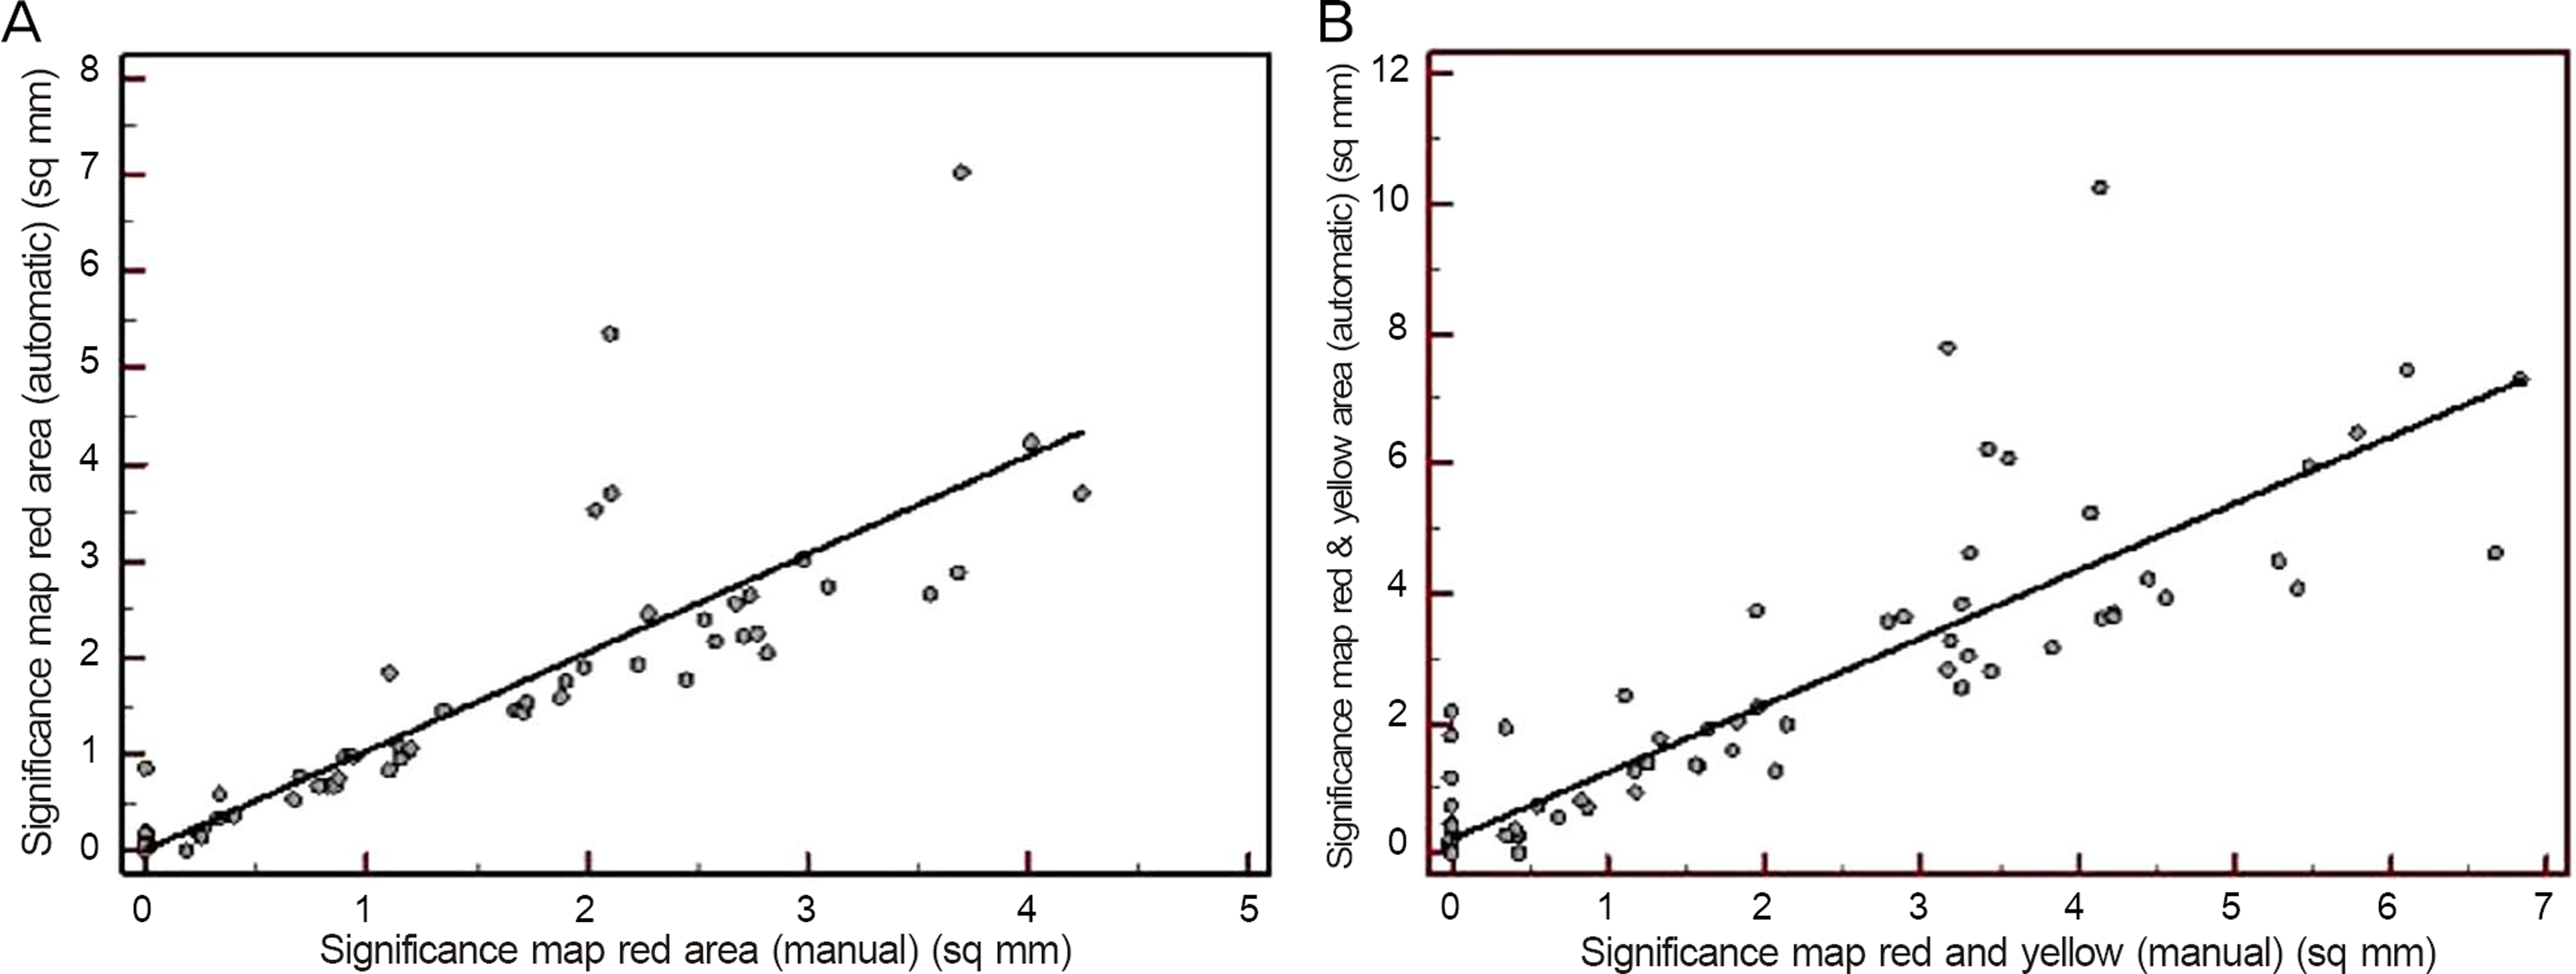
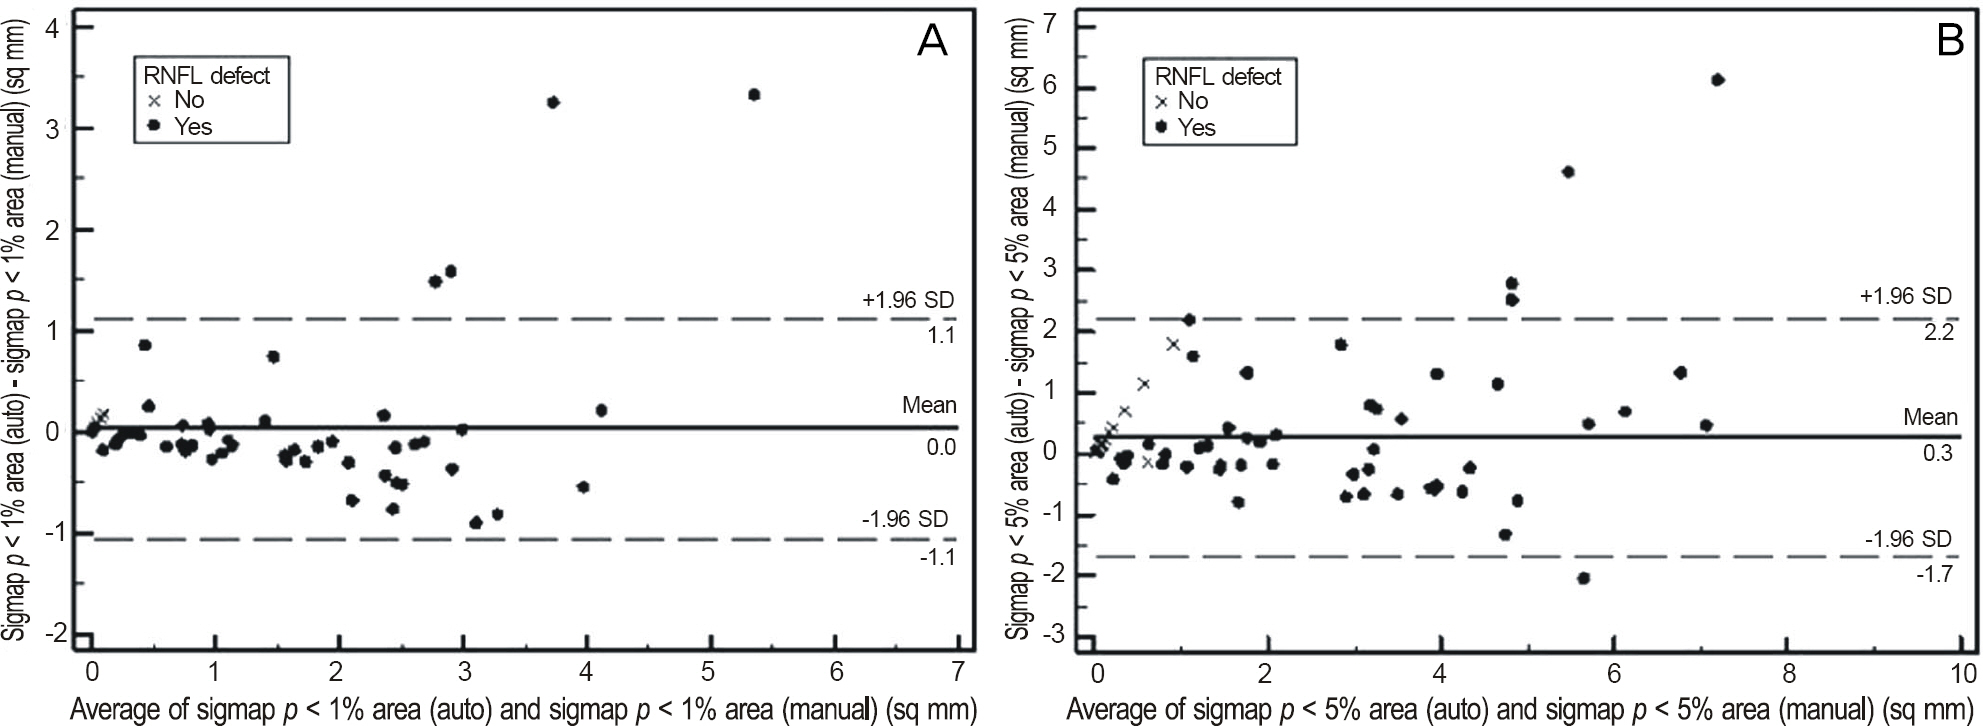
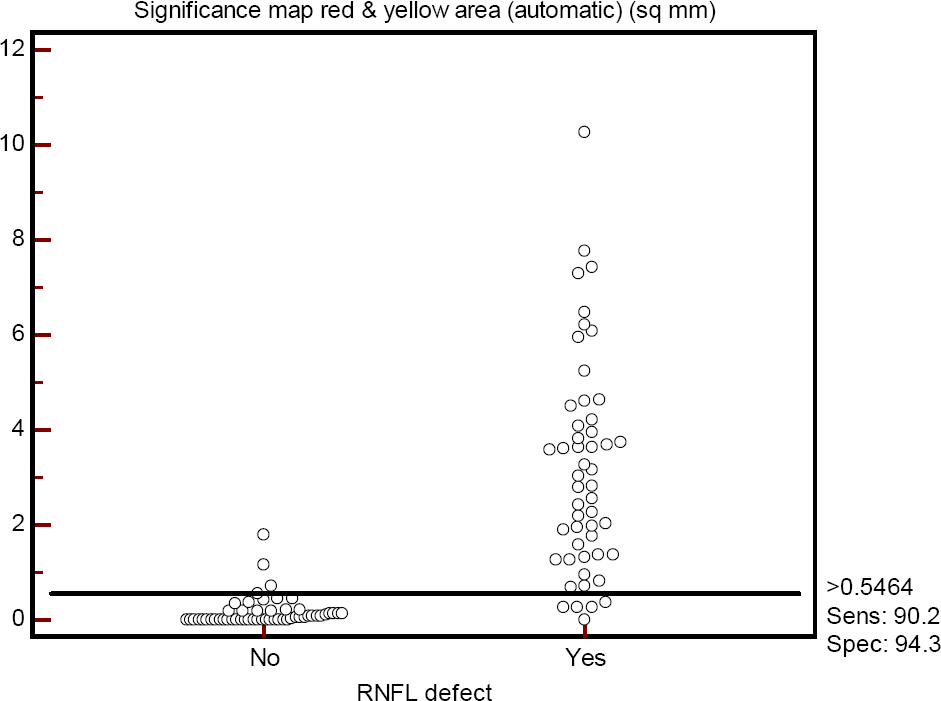
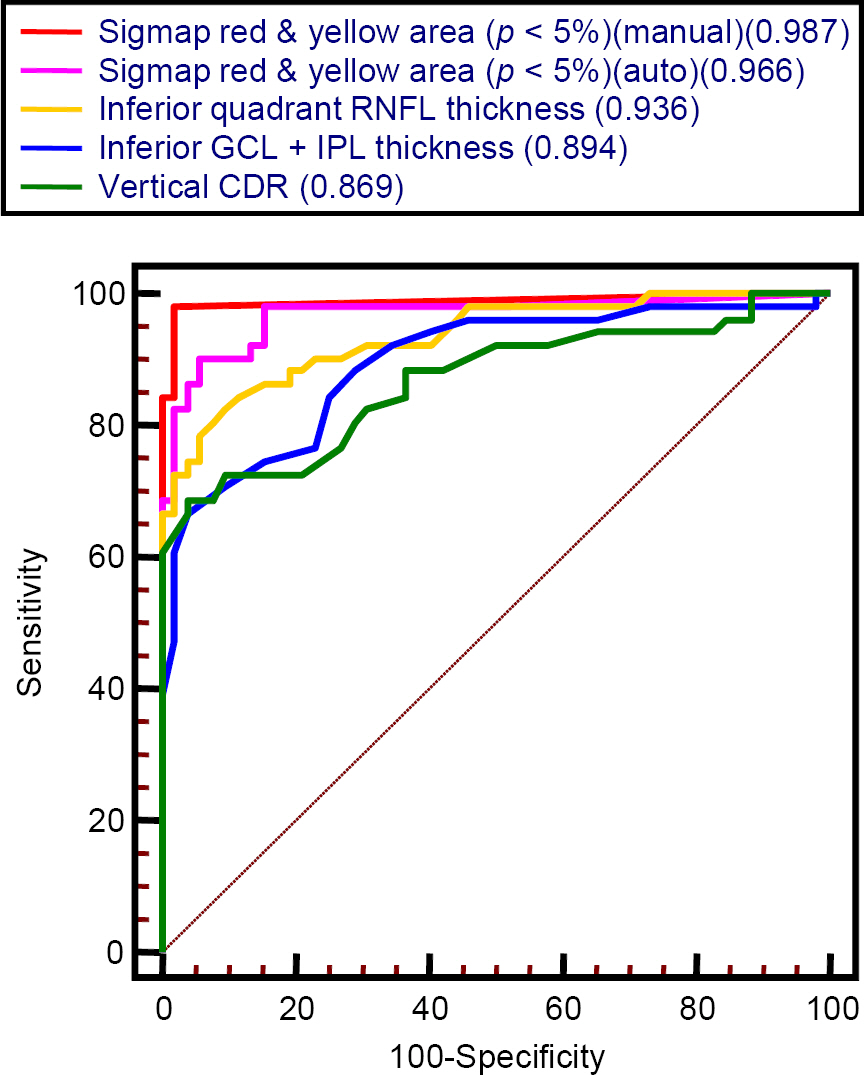
High correlation was observed between manually and automatically measured defect areas in the significance map (red area r = 0.904, red and yellow area r = 0.890). The AUC for manually and automatically measured defects area (0.987, 0.966; p < 5%, p = 0.31, respectively) in the significance map was comparable. The latter demonstrated slightly higher but insignificant difference in AUC for inferior quadrant circumpapillary RNFL thickness (0.936; p = 0.22) and was significantly higher than the inferior ganglion cell layer plus inner plexiform layer thickness (0.894) and vertical cup to disc ratio (0.869) (p = 0.018, p = 0.008, respectively).
CONCLUSIONS
The automated measurements of the RNFL defect area in the significance map performed adequately in detecting localized RNFL defects and had a better performance than macular inner retina and optic nerve parameters.
Keyword
MeSH Terms
Figure
Reference
-
References
1. Schuman JS. Spectral domain optical coherence tomography for glaucoma (an AOS thesis). Trans Am Ophthalmol Soc. 2008; 106:426–58.2. Kim NR, Lee ES, Seong GJ. . Spectral-domain optical coher-ence tomography for detection of localized retinal nerve fiber layer defects in patients with open-angle glaucoma. Arch Ophthalmol. 2010; 128:1121–8.
Article3. Leung CK, Lam S, Weinreb RN. . Retinal nerve fiber layer imaging with spectral-domain optical coherence tomography: analysis of the retinal nerve fiber layer map for glaucoma detection. Ophthalmology. 2010; 117:1684–91.4. Leung CK, Choi N, Weinreb RN. . Retinal nerve fiber layer imaging with spectral-domain optical coherence tomography: pat-tern of RNFL defects in glaucoma. Ophthalmology. 2010; 117:2337–44.5. Kang SY, Sung KR, Na JH. . Comparison between deviation map algorithm and peripapillary retinal nerve fiber layer measure-ments using Cirrus HD-OCT in the detection of localized glau-comatous visual field defects. J Glaucoma. 2012; 21:372–8.
Article6. Jeoung JW, Park KH, Kim TW. . Diagnostic ability of optical coherence tomography with a normative database to detect lo-calized retinal nerve fiber layer defects. Ophthalmology. 2005; 112:2157–63.
Article7. Yoo YC, Park KH. Comparison of optical coherence tomography and scanning laser polarimetry for detection of localized retinal nerve fiber layer defects. J Glaucoma. 2010; 19:229–36.
Article8. Yoo YC, Park KH. Influence of angular width and peripapillary position of localized retinal nerve fiber layer defects on their de-tection by time-domain optical coherence tomography. Jpn J Ophthalmol. 2011; 55:115–22.
Article9. Kang SM, Uhm KB. False negative findings of optical coherence tomography in eyes with localized nerve fiber layer defects. J Korean Ophthalmol Soc. 2011; 52:454–61.
Article10. Ye C, To E, Weinreb RN. . Comparison of retinal nerve fiber layer imaging by spectral domain optical coherence tomography and scanning laser ophthalmoscopy. Ophthalmology. 2011; 118:2196–202.
Article11. Mwanza JC, Oakley JD, Budenz DL, Anderson DR. Cirrus Optical Coherence Tomography Normative Database Study Group. Ability of cirrus HD-OCT optic nerve head parameters to discriminate nor-mal from glaucomatous eyes. Ophthalmology. 2011; 118:241–8. e1.12. Schulze A, Lamparter J, Pfeiffer N. . Diagnostic ability of reti-nal ganglion cell complex, retinal nerve fiber layer, and optic nerve head measurements by Fourier-domain optical coherence tomography. Graefes Arch Clin Exp Ophthalmol. 2011; 249:1039–45.
Article13. Seong M, Sung KR, Choi EH. . Macular and peripapillary reti-nal nerve fiber layer measurements by spectral domain optical co-herence tomography in normal-tension glaucoma. Invest Ophthalmol Vis Sci. 2010; 51:1446–52.
Article14. Tan O, Li G, Lu AT. . Mapping of macular substructures with opti-cal coherence tomography for glaucoma diagnosis. Ophthalmology. 2008; 115:949–56.
Article15. Taliantzis S, Papaconstantinou D, Koutsandrea C. . Comparative studies of RNFL thickness measured by OCT with global index of visual fields in patients with ocular hypertension and early open angle glaucoma. Clin Ophthalmol. 2009; 3:373–9.
Article16. Cvenkel B, Kontestabile AS. Correlation between nerve fibre layer thickness measured with spectral domain OCT and visual field in patients with different stages of glaucoma. Graefes Arch Clin Exp Ophthalmol. 2011; 249:575–84.
Article17. Lopez-Peña MJ, Ferreras A, Larrosa JM. . Relationship be-tween standard automated perimetry and retinal nerve fiber layer parameters obtained with optical coherence tomography. J Glaucoma. 2011; 20:422–32.
Article18. Harwerth RS, Charles F. Prentice Award Lecture 2006: a neuron doctrine for glaucoma. Optom Vis Sci. 2008; 85:436–44.19. Tan O, Chopra V, Lu AT. . Detection of macular ganglion cell loss in glaucoma by Fourier-domain optical coherence tomography. Ophthalmology. 2009; 116:2305–14. e1-2.
Article20. Mori S, Hangai M, Sakamoto A, Yoshimura N. Spectral-domain optical coherence tomography measurement of macular volume for diagnosing glaucoma. J Glaucoma. 2010; 19:528–34.
Article21. Nakatani Y, Higashide T, Ohkubo S. . Evaluation of macular thickness and peripapillary retinal nerve fiber layer thickness for detection of early glaucoma using spectral domain optical coher-ence tomography. J Glaucoma. 2011; 20:252–9.
Article22. Mwanza JC, Durbin MK, Budenz DL. . Glaucoma diagnostic accuracy of ganglion cell-inner plexiform layer thickness: compar-ison with nerve fiber layer and optic nerve head. Ophthalmology. 2012; 119:1151–8.
Article
- Full Text Links
- Actions
-
Cited
- CITED
-
- Close
- Share
- Similar articles
-
- Reproducibility of Retinal Nerve Fiber Layer Thickness Evaluation by Nerve Fiber Analyzer
- Visual Field Cluster Map Corresponding to Retinal Nerve Fiber Layer Sectors in Glaucoma
- Usefulness of Table Parameters of Stratus OCT in Detection of Localized Retinal Nerve Fiber Layer Defects
- Biometry of Retinal Nerve Fiber Layer Thickness by NFA
- The Relationship between the Capillary Nonperfusion Area and the Retinal Nerve Fiber Layer Defects in Branch Retinal Vein Occlusion Patients


