The evaluation of the correlation between histomorphometric analysis and micro-computed tomography analysis in AdBMP-2 induced bone regeneration in rat calvarial defects
- Affiliations
-
- 1Department of Periodontology, Dental Research Institute, Seoul National University School of Dentistry, Seoul, Korea. yjseol@snu.ac.kr
- 2Mediflower Clinic, Seoul, Korea.
- KMID: 1783616
- DOI: http://doi.org/10.5051/jpis.2011.41.5.218
Abstract
- PURPOSE
Micro-computed tomography (micro-CT) has been widely used in the evaluation of regenerated bone tissue but the reliability of micro-CT has not yet been established. This study evaluated the correlation between histomorphometric analysis and micro-CT analysis in performing new bone formation measurement.
METHODS
Critical-size calvarial defects were created using a 8 mm trephine bur in a total of 24 Sprague-Dawley rats, and collagen gel mixed with autogenous rat bone marrow stromal cells (BMSCs) or autogenous rat BMSCs transduced by adenovirus containing bone morphogenic protein-2 (BMP-2) genes was loaded into the defect site. In the control group, collagen gel alone was loaded into the defect. After 2 and 4 weeks, the animals were euthanized and calvaria containing defects were harvested. Micro-CT analysis and histomorphometric analysis of each sample were accomplished and the statistical evaluation about the correlation between both analyses was performed.
RESULTS
New bone formation of the BMP-2 group was greater than that of the other groups at 2 and 4 weeks in both histomorphometric analysis and micro-CT analysis (P=0.026, P=0.034). Histomorphometric analysis of representative sections showed similar results to histomorphometric analysis with a mean value of 3 sections. Measurement of new bone formation was highly correlated between histomorphometric analysis and micro-CT analysis, especially at the low lower threshold level at 2 weeks (adjusted r2=0.907, P<0.001). New bone formation of the BMP-2 group analyzed by micro-CT tended to decline sharply with an increasing lower threshold level, and it was statistically significant (P<0.001).
CONCLUSIONS
Both histomorphometric analysis and micro-CT analysis were valid methods for measurement of the new bone in rat calvarial defects and the ability to detect the new bone in micro-CT analysis was highly influenced by the threshold level in the BMP-2 group at early stage.
MeSH Terms
Figure
-

Figure 1 Representative histology of each group at 2 and 4 weeks. The bone morphogenic protein-2 (BMP-2) group showed remarkable new bone formation at both 2 and 4 weeks. The new bone had a sponge-like immature woven bone morphology at 2 weeks, while more mature new bone with lamellar bone and marrow space had formed by 4 weeks. BMSCs, bone marrow stromal cells.
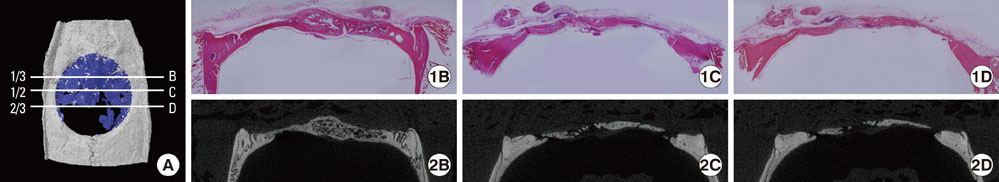
Figure 2 Illustration of the position of the additional sections (A) and corresponding histology and micro computed tomography (micro-CT) image (B-2D). The histology at different positions showed different newly formed areas. This micro-CT image was obtained from the bone morphogenic protein-2 group at 4 weeks.
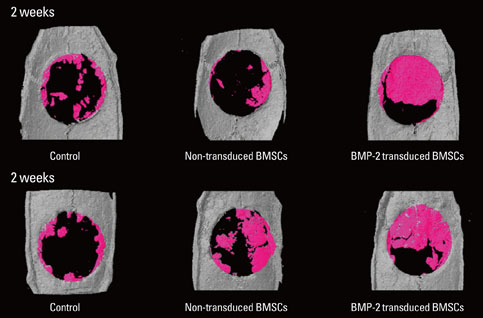
Figure 3 Micro-computed tomography images reconstructing each group 3-dimensionally at 2 and 4 weeks. These images were built with the lower threshold level of 65, the value set automatically. The bone morphogenic protein-2 (BMP-2) group showed remarkable bone fill of the defect at 2 and 4 weeks. New bone of the bone marrow stromal cell (BMSC) group was greater at 4 weeks than 2 weeks.
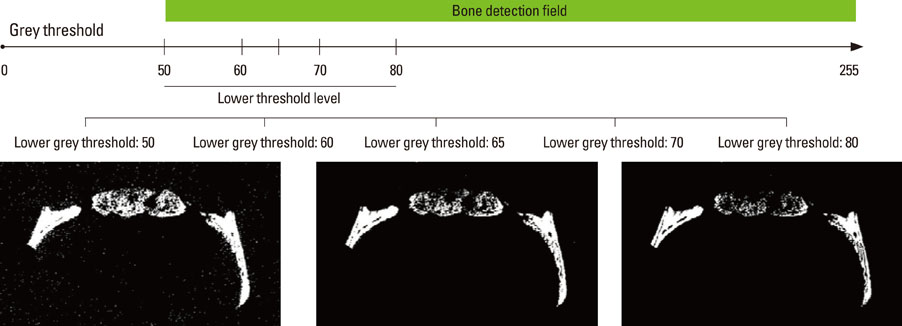
Figure 4 Illustration and micro-computed tomography images according to the lower threshold level. At a lower grey threshold level of 50, the noise on the background was more pronounced; however, more newly formed bone was detected. As the threshold level was increased, the new bone detected on the radiology decreased. The unit of the threshold level was the grayscale index.
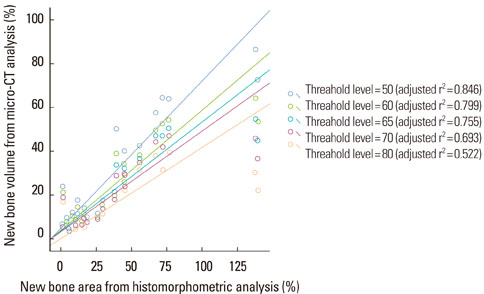
Figure 5 Scatter diagram and linear regression analysis between new bone area (%) of histomorphometric analysis of a representative section and bone volume (%) of micro computed tomography (micro-CT) analysis. The correlation between the two analyses was statistically significant (P<0.0001, all groups). As the threshold level was increased, the correlation between the two analyses decreased. At the threshold level of 50, the correlation was the most significant. The unit of the threshold level was the grayscale index.

Figure 6 Scatter diagram and linear regression analysis between new bone area (%) of histomorphometric analysis with 3 sections and bone volume (%) of micro computed tomography (micro-CT) analysis. The correlation between the two analyses was statistically significant (P<0.0001, all groups). As the threshold level was increased, the correlation between the two analyses decreased. At a threshold level of 50, the correlation was the most significant. The unit of threshold level was the grayscale index.
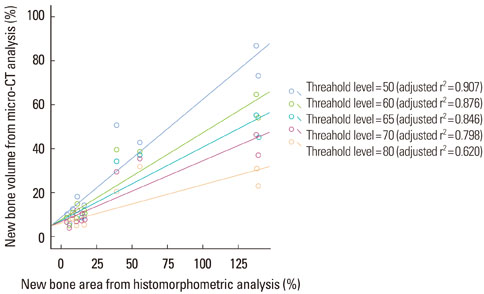
Figure 7 Scatter diagram and linear regression analysis between new bone area (%) of histomorphometric analysis of a representative section and bone volume (%) of micro computed tomography (micro-CT) analysis at 2 weeks. The correlation between the two analyses was statistically significant (P<0.0001, all groups). As the threshold level was increased, the correlation between the two analyses decreased. At a threshold level of 50, the correlation was the most significant. The unit of the threshold level was the grayscale index.
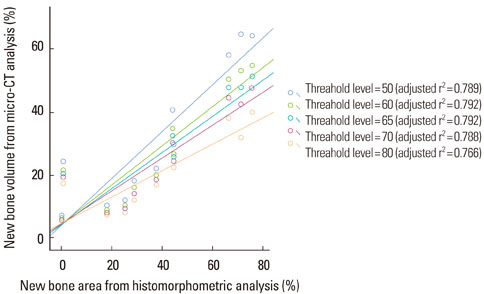
Figure 8 Scatter diagram and linear regression analysis between the new bone area (%) of histomorphometric analysis with a representative section and bone volume (%) of micro computed tomography (micro-CT) analysis at 4 weeks. The correlation between the two analyses was statistically significant (P<0.0001, all groups). The correlation between the two analyses was independent of the threshold level. The unit of the threshold level was the grayscale index.
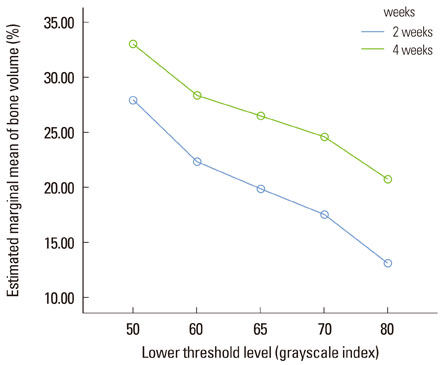
Figure 9 Illustration of the bone volume (%) measurement at 2 and 4 weeks according to the lower threshold level. The bone volume gradully decreased with the increase in the threshold level at 2 and 4 weeks and the slope at 2 weeks and 4 weeks was similar (repeated measures analysis of variance, not significant). The unit of the threshold level was the grayscale index.
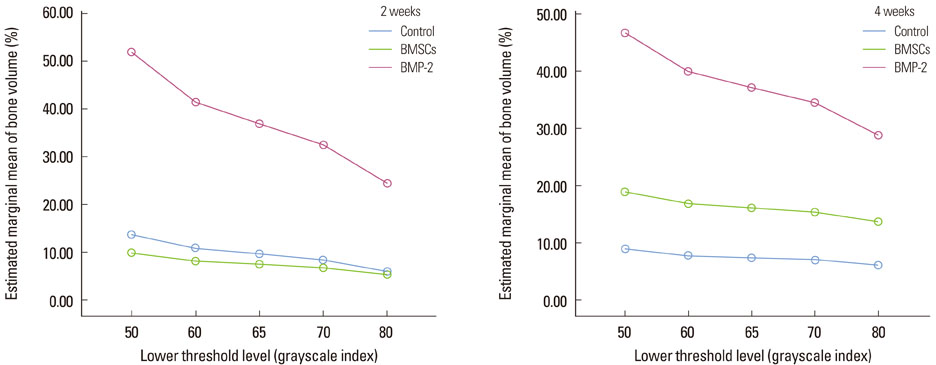
Figure 10 Illustration of the bone volume (%) measurement of each group at 2 and 4 weeks according to the lower threshold level. The bone morphogenic protein-2 (BMP-2) group showed a sharper decline as the threshold level increased at 2 weeks than the other groups, and the difference was significant (repeated measures analysis of variance [ANOVA], statistically significant, P<0.001). This pattern was similar at 4 weeks (repeated measures ANOVA, statistically significant, P<0.001). The unit of the threshold level was the grayscale index. BMSCs, bone marrow stromal cells.
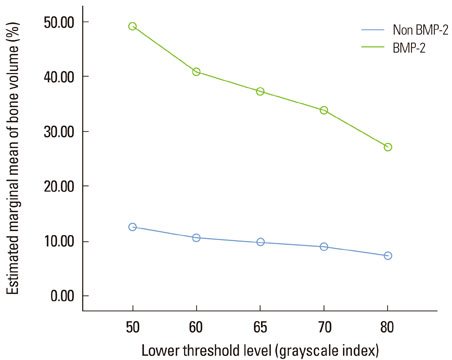
Figure 11 Illustration of the bone volume (%) measurement of the bone morphogenic protein-2 (BMP-2) group vs. the non-BMP-2 group according to the lower threshold level. The BMP-2 group showed a sharper decline than the non-BMP-2 group (repeated measures analysis of variance, statistically significant, P<0.001). The unit of the threshold level was the grayscale index.
Reference
-
1. Ryoo HM, Lee MH, Kim YJ. Critical molecular switches involved in BMP-2-induced osteogenic differentiation of mesenchymal cells. Gene. 2006. 366:51–57.
Article2. Seol YJ, Park YJ, Lee SC, Kim KH, Lee JY, Kim TI, et al. Enhanced osteogenic promotion around dental implants with synthetic binding motif mimicking bone morphogenetic protein (BMP)-2. J Biomed Mater Res A. 2006. 77:599–607.
Article3. Kofron MD, Laurencin CT. Bone tissue engineering by gene delivery. Adv Drug Deliv Rev. 2006. 58:555–576.
Article4. Lutz R, Park J, Felszeghy E, Wiltfang J, Nkenke E, Schlegel KA. Bone regeneration after topical BMP-2-gene delivery in circumferential peri-implant bone defects. Clin Oral Implants Res. 2008. 19:590–599.
Article5. Jiang XQ, Sun XJ, Lai HC, Zhao J, Wang SY, Zhang ZY. Maxillary sinus floor elevation using a tissue-engineered bone complex with beta-TCP and BMP-2 gene-modified bMSCs in rabbits. Clin Oral Implants Res. 2009. 20:1333–1340.
Article6. Evans C. Gene therapy for the regeneration of bone. Injury. 2011. 42:599–604.
Article7. Fischer J, Kolk A, Wolfart S, Pautke C, Warnke PH, Plank C, et al. Future of local bone regeneration - Protein versus gene therapy. J Craniomaxillofac Surg. 2011. 39:54–64.
Article8. Koh JT, Zhao Z, Wang Z, Lewis IS, Krebsbach PH, Franceschi RT. Combinatorial gene therapy with BMP2/7 enhances cranial bone regeneration. J Dent Res. 2008. 87:845–849.
Article9. Patterson J, Siew R, Herring SW, Lin AS, Guldberg R, Stayton PS. Hyaluronic acid hydrogels with controlled degradation properties for oriented bone regeneration. Biomaterials. 2010. 31:6772–6781.
Article10. Huang YC, Simmons C, Kaigler D, Rice KG, Mooney DJ. Bone regeneration in a rat cranial defect with delivery of PEI-condensed plasmid DNA encoding for bone morphogenetic protein-4 (BMP-4). Gene Ther. 2005. 12:418–426.
Article11. Chang PC, Seol YJ, Cirelli JA, Pellegrini G, Jin Q, Franco LM, et al. PDGF-B gene therapy accelerates bone engineering and oral implant osseointegration. Gene Ther. 2010. 17:95–104.
Article12. Young S, Patel ZS, Kretlow JD, Murphy MB, Mountziaris PM, Baggett LS, et al. Dose effect of dual delivery of vascular endothelial growth factor and bone morphogenetic protein-2 on bone regeneration in a rat critical-size defect model. Tissue Eng Part A. 2009. 15:2347–2362.
Article13. Patel ZS, Young S, Tabata Y, Jansen JA, Wong ME, Mikos AG. Dual delivery of an angiogenic and an osteogenic growth factor for bone regeneration in a critical size defect model. Bone. 2008. 43:931–940.
Article14. Chang SC, Chuang H, Chen YR, Yang LC, Chen JK, Mardini S, et al. Cranial repair using BMP-2 gene engineered bone marrow stromal cells. J Surg Res. 2004. 119:85–91.15. Park EJ, Kim ES, Weber HP, Wright RF, Mooney DJ. Improved bone healing by angiogenic factor-enriched platelet-rich plasma and its synergistic enhancement by bone morphogenetic protein-2. Int J Oral Maxillofac Implants. 2008. 23:818–826.16. Gielkens PF, Schortinghuis J, de Jong JR, Huysmans MC, Leeuwen MB, Raghoebar GM, et al. A comparison of micro-CT, microradiography and histomorphometry in bone research. Arch Oral Biol. 2008. 53:558–566.
Article17. Kochi G, Sato S, Fukuyama T, Morita C, Honda K, Arai Y, et al. Analysis on the guided bone augmentation in the rat calvarium using a microfocus computerized tomography analysis. Oral Surg Oral Med Oral Pathol Oral Radiol Endod. 2009. 107:e42–e48.
Article18. Shin JH, Kim KH, Kim SH, Koo KT, Kim TI, Seol YJ, et al. Ex vivo bone morphogenetic protein-2 gene delivery using gingival fibroblasts promotes bone regeneration in rats. J Clin Periodontol. 2010. 37:305–311.
Article19. Maréchal M, Luyten F, Nijs J, Postnov A, Schepers E, van Steenberghe D. Histomorphometry and micro-computed tomography of bone augmentation under a titanium membrane. Clin Oral Implants Res. 2005. 16:708–714.
Article20. Umoh JU, Sampaio AV, Welch I, Pitelka V, Goldberg HA, Underhill TM, et al. In vivo micro-CT analysis of bone remodeling in a rat calvarial defect model. Phys Med Biol. 2009. 54:2147–2161.
Article21. Kochi G, Sato S, Ebihara H, Hirano J, Arai Y, Ito K. A comparative study of microfocus CT and histomorphometry in the evaluation of bone augmentation in rat calvarium. J Oral Sci. 2010. 52:203–211.
Article
- Full Text Links
-
- Actions
-
Cited
- CITED
-
- Close
- Share
-
- Similar articles
-
- Bone regeneration effects of human allogenous bone substitutes: a preliminary study
- The Application of L-Serine-Incorporated Gelatin Sponge into the Calvarial Defect of the Ovariectomized Rats
- Factors Influencing Regeneration of Calvarial Defects in Rats
- Determination of the critical diabetes duration in a streptozotocin-induced diabetic rat calvarial defect model for experimentation regarding bone regeneration
- Guided Bone Regeneration Of Calvarial Bone Defects Using Bioabsorbable Membrane And Demineralized Freeze Dried Bone In Rats
