Practical Application of Iterative Decomposition of Water and Fat with Echo Asymmetry and Least-Squares Estimation (IDEAL) Imaging in Minimizing Metallic Artifacts
- Affiliations
-
- 1Department of Radiology, Soonchunhyang University Bucheon Hospital, Bucheon 420-767, Korea. mj4907@schmc.ac.kr
- KMID: 1372853
- DOI: http://doi.org/10.3348/kjr.2012.13.3.332
Abstract
- Iterative decomposition of water and fat with echo asymmetry and the least-squares estimation (IDEAL) is a recently developed method for robust separation of fat and water with very high signal-to-noise-ratio (SNR) efficiency. In contrast to conventional fat-saturation methods, IDEAL is insensitive to magnetic field (B0 and B1) inhomogeneity. The aim of this study was to illustrate the practical application of the IDEAL technique in reducing metallic artifacts in postoperative patients with metallic hardware. The IDEAL technique can help musculoskeletal radiologists make an accurate diagnosis particularly in musculoskeletal imaging by reducing metallic artifacts, enabling the use of contrast enhancement, improving SNR performance, and providing various modes of MR images with one scan parameter.
Keyword
MeSH Terms
Figure
-
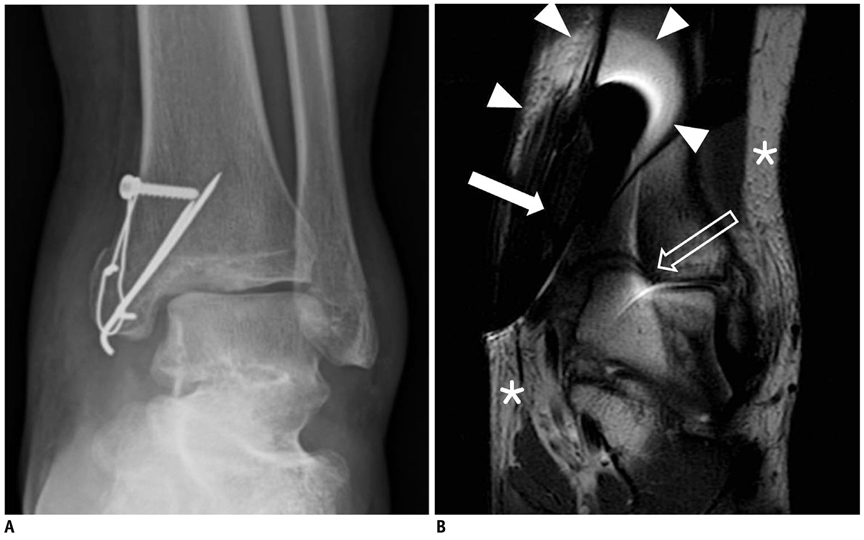
Fig. 1 Forms of metallic artifacts caused by metallic hardware in left ankle joint (3.0 T, TR/TE = 4633/75, field of view [FOV] = 14 cm, slice = 3 mm, echo train length [ETL] = 11, echo spacing = 14.1, bandwidth [BW] = 41,67 kHz, matrix = 384 × 256, acquisition time = 2 min 52 sec). A. Ankle anterior-posterior view reveals tension-band wire fixation device inserted in medial melleolus of distal tibia. B. Frequency-selected fat saturated (FSFS) T2-weighted image shows area of complete signal void (solid arrow), geographic distortion of tibiotalar joint (open arrow), peripheral high-signal lesions around metallic implant (arrowheads), and incomplete fat saturation (asterisks).
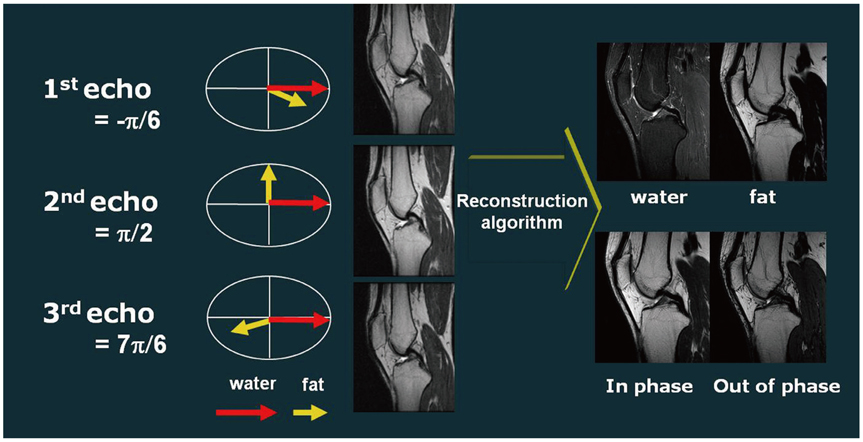
Fig. 2 Schematic showing process of obtaining three images in asymmetric manner at phase between water and fat in quadrature (i.e., perpendicular). 120° phase before and after quadrature images, serve to produce water-only, fat-only, in-phase, and out-of-phase images using recombination algorithm.
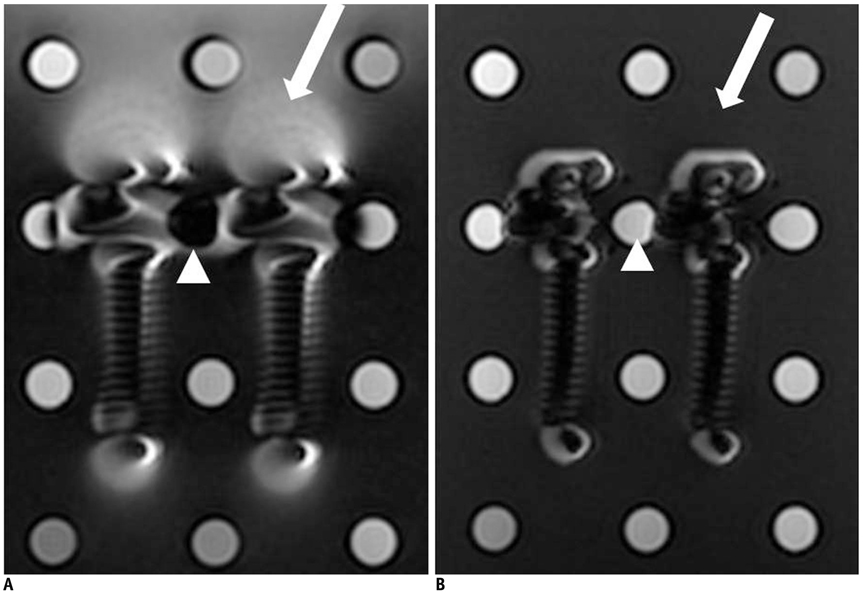
Fig. 3 MR images of spinal pedicle screws placed between test tubes filled with diluted gadolinium contrast material in phantom filled with oil. A. Fat-saturated T1-weighted (1.5 T, TR/TE = 500/15, FOV = 24 cm, slice = 2 mm, ETL = 7, echo spacing = 11.5, BW = 31.25 kHz, matrix = 256 × 256, acquisition time = 1 min 07 sec) and (B) IDEAL T1-weighted images (1.5 T, TR/TE = 500/15, FOV = 24 cm, slice = 2 mm, ETL = 8, echo spacing = 13.3, BW = 31.25 kHz, matrix = 256 × 256, acquisition time = 3 min 37 sec) show area of peripheral high-signal-intensity lesions around pedicle screws (arrow), with marked decreased in IDEAL T1-weighted images compared with fat-saturated T1-weighted images. IDEAL T1-weighted images show that signal intensity of contrast material in test tube between pedicle screws (arrowhead) is maintained against metallic artifacts, whereas fat-saturated T1-weighted images reveal complete loss of signal intensity in test tube (arrowhead).
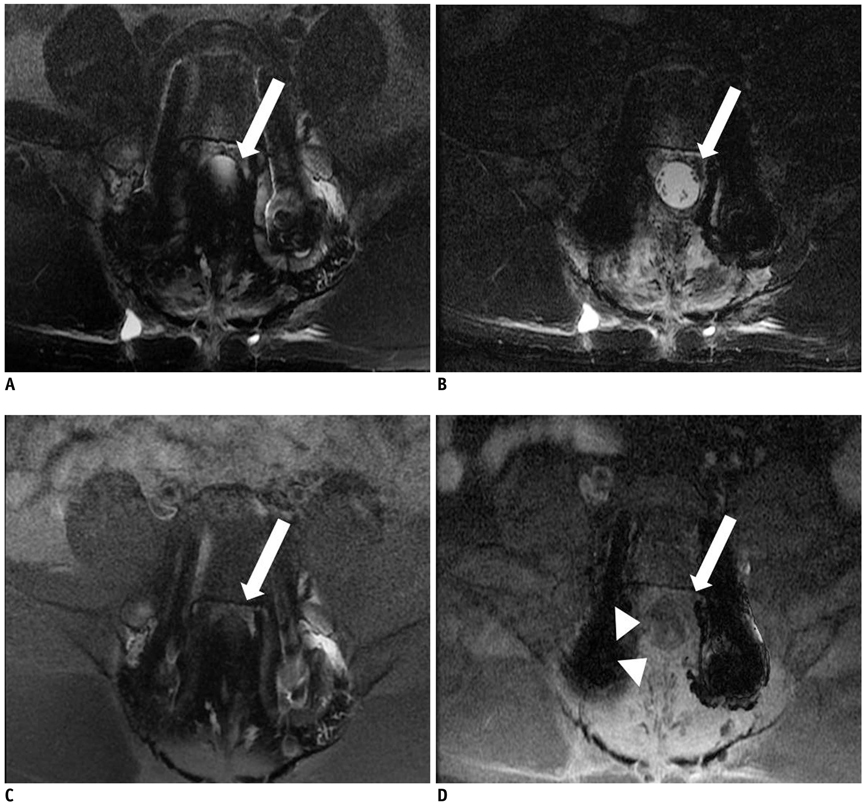
Fig. 4 41-year-old man with posterior interpedicular screw fixation in L5. Fat-saturated axial T2 (A) (1.5 T, TR/TE = 4000/102, field of view = 18 cm, slice = 4 mm, ETL = 11, echo spacing = 14.1, BW = 41.67 kHz, matrix = 320 × 224, acquisition time = 3 min 04 sec) and contrast-enhanced T1-weighted images (C) (1.5 T, TR/TE = 750/12, FOV = 18 cm, slice = 4 mm, ETL = 5, echo spacing = 9.5, BW = 41.67 kHz,matrix = 320 × 224, acquisition time = 4 min 37 sec) show that dural sac (arrow) is not visualized due to metallic artifacts caused by pedicular screws, whereas the whole area of dural sac is fully depicted on IDEAL T2- (B) (1.5 T, TR/TE = 400/102, FOV = 18 cm, slice = 4 mm, ETL = 24, echo spacing = 11.9, BW = 41.67kHz, matrix = 320 × 224, acquisition time = 7 min 12 sec) and contrast-enhanced T1-weighted images (D) (1.5 T, TR/TE = 750/12, FOV = 18 cm, slice = 4 mm, ETL = 16, echo spacing = 12.3, BW = 41.67 kHz, matrix = 320 × 224, acquisition time = 5 min 16 sec). Note that circumferential epidural enhancement along dural sac (arrowheads), which is not observed on fat saturated contrast-enhanced T1-weighted images, is clearly visualized on IDEAL T1-weighted images (D).
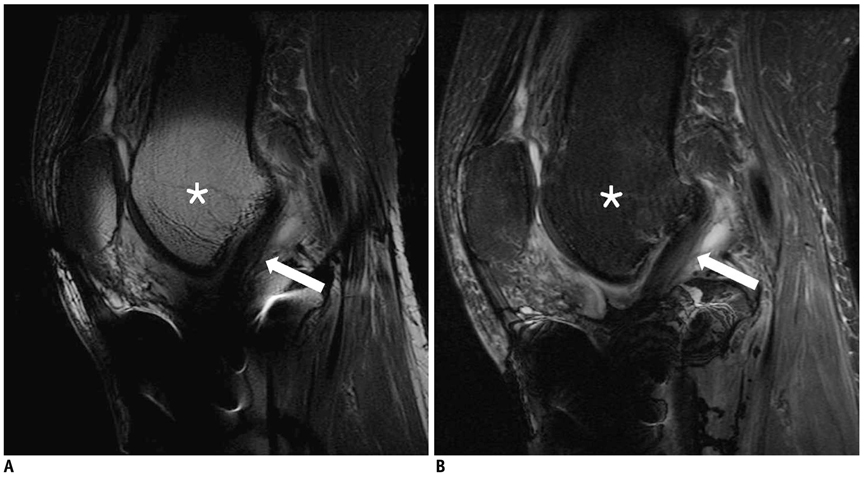
Fig. 5 34-year-old man with cancellous screw fixation in right proximal tibia. In fat-saturated T2-weighted images (A) (3.0 T, TR/TE = 4000/72, FOV = 16 cm, slice = 3.5 mm, ETL = 10, echo spacing = 14.1, BW = 41.67 kHz, matrix = 512 × 256, acquisition time = 2 min 46 sec), metallic artifact from metallic implant in proximal tibia is observed as high-signal-intensity lesion (asterisk) affecting distal femur and patella. Inferior portion of anterior cruciate ligament is obscured by signal-loss artifact from implant (arrow), and IDEAL T2-weighted images (B) (3.0 T, TR/TE = 4000/72, FOV = 16 cm, slice = 3.5 mm, ETL = 11, echo spacing = 12.2, BW = 41.67 kHz, matrix = 512 × 256, acquisition time = 5 min 36 sec) demonstrate homogeneous low signal intensity in bone marrow, providing clearer visualization of entire portion of anterior cruciate ligament (arrow).
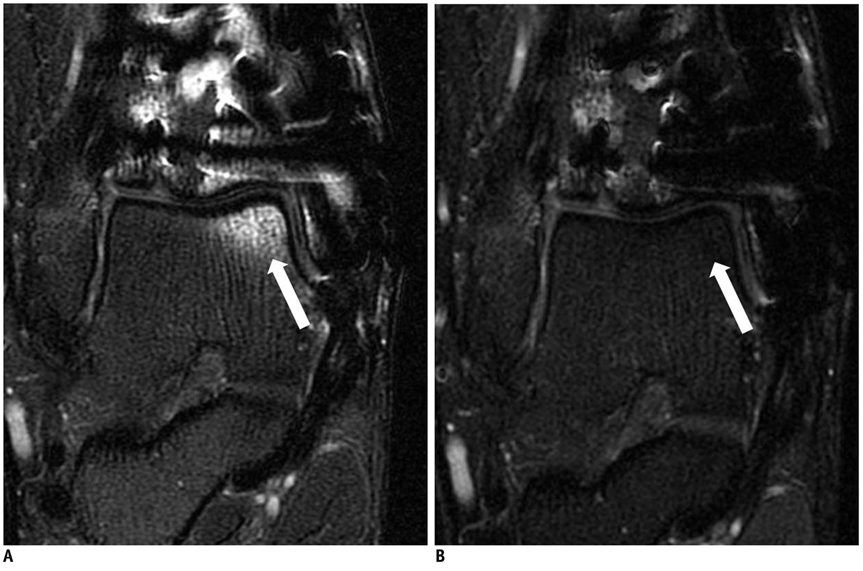
Fig. 6 29-year-old man with open reduction internal fixation in right distal tibia. Fat-saturated coronal T2-weighted images (A) (3.0 T, TR/TE = 4500/68, FOV = 14 cm, slice = 3 mm, ETL = 11, echo spacing = 13.2, BW = 41.67 kHz, matrix = 384 × 256, acquisition time = 2 min 58 sec) show high-signal-intensity lesion in subchondral area of medial talar dome (arrow), simulating osteochondral lesion, which is clearly removed on IDEAL T2-weighted images (arrow) (B) (3.0 T, TR/TE = 4500/68, FOV = 14 cm, slice = 3 mm, ETL = 11.6, echo spacing = 3,3, BW = 41.67 kHz, matrix = 384 × 256, acquisition time = 4 min 33 sec).
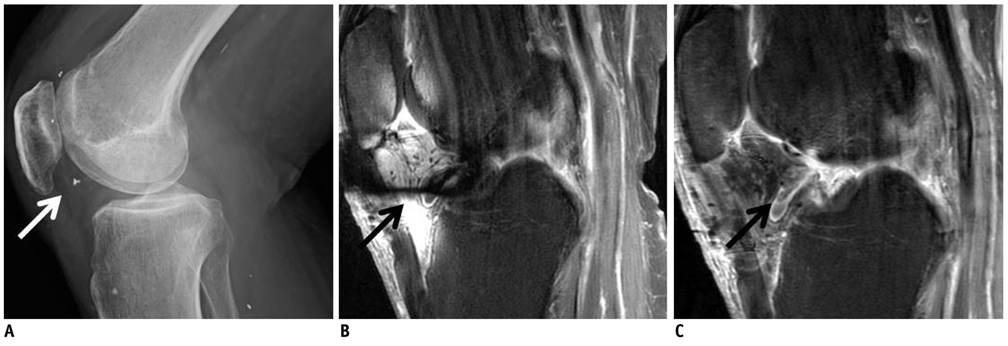
Fig. 7 66-year-old man with metallic foreign body in his right knee joint. Lateral radiography of right knee joint (A) shows tiny T-shaped fragment in patellofemoral joint. Significant metallic artifacts caused by metallic foreign body are shown in infrapatellar fat pad on contrast-enhanced sagittal T1-weighted images (B) (3.0 T, TR/TE = 800/12, FOV = 16 cm, slice = 3.5 mm, ETL = 4, echo spacing = 11.7, BW = 41.67 kHz, matrix = 384 × 256, acquisition time = 2 min 12 sec), whereas lower level of metallic artifact is observed in IDEAL contrast-enhanced T1-weighted images (C) (3.0 T, TR/TE = 700/15, FOV = 16 cm, slice = 3.5 mm, ETL = 4, echo spacing = 10.6, BW = 31.25 kHz, matrix = 384 × 256, acquisition time = 4 min 33 sec).
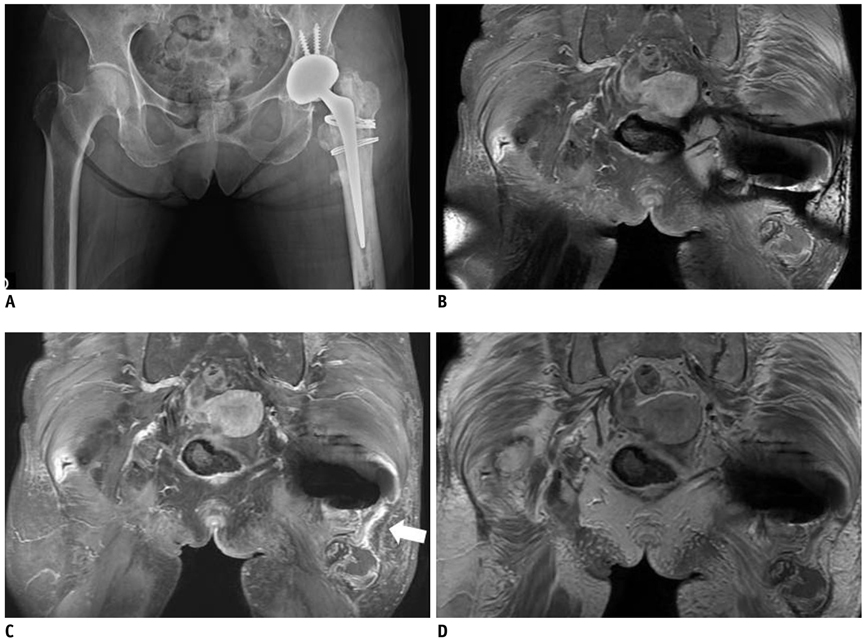
Fig. 8 79-year-old woman that underwent total hip arthroplasty in left hip joint. Anteroposterior (AP) radiography of pelvis (A) shows total hip prosthesis in left hip joint. Coronal contrast-enhanced T1-weighted images (B) (3.0 T, TR/TE = 880/15, FOV = 40 cm, slice = 4 mm, ETL = 3, echo spacing = 14.1, BW = 41.67kHz, matrix = 416 × 224, acquisition time = 4 min 21 sec) demonstrate significant susceptibility artifact around metallic implant and abscess, with marginal enhancement (arrow) located at inferior aspect of left hip joint. However, this image does not provide information about relationship between metallic implant and abscess. In contrast, IDEAL contrast-enhanced T1-weighted images (C) (3.0 T, TR/TE = 700/15, FOV = 40 cm, slice = 4 mm, ETL = 3, echo spacing = 12.9, BW = 41.67kHz, matrix = 416 × 224, acquisition time = 7 min 19 sec) and fat-water fusion images (D), which are similar to non-saturated contrast-enhanced T1-weighted images, and reveal connection between total hip prosthesis and marginal enhanced abscess (arrowheads), with marked decreased metallic artifact.
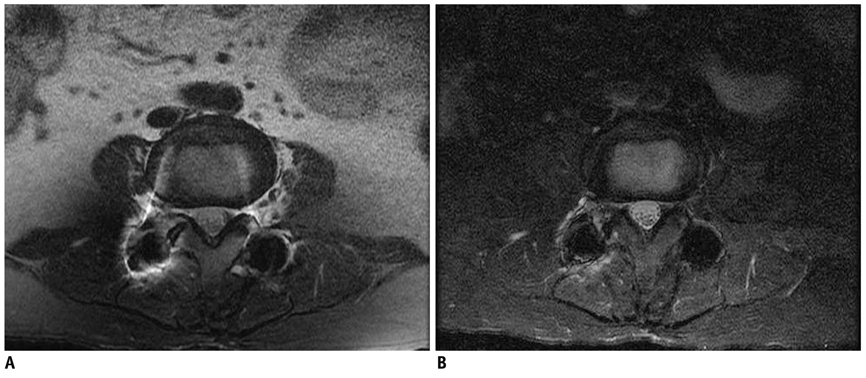
Fig. 9 64-year-old woman who underwent posterior fixation surgery at L3-L4 due to spinal stenosis. Axial fat-saturated T2-weighted images (A) (1.5 T, TR/TE = 4000/102, field of view = 18 cm, slice = 4 mm, ETL = 11, echo spacing = 13.6, BW = 41.67 kHz, matrix = 320 × 224, acquisition time = 3 min 4 sec) show incomplete fat saturation caused by metallic interpedicular screws involving areas of subcutaneous and peritoneal fat. In contrast, axial IDEAL T2-weighted image (B) (1.5 T, TR/TE = 4000/102, field of view = 18 cm, slice = 4 mm, ETL = 24, echo spacing = 11.9, BW = 41.67 kHz, matrix = 320 × 224, acquisition time = 7 min 12 sec) shows homogeneous fat saturation within field of view.
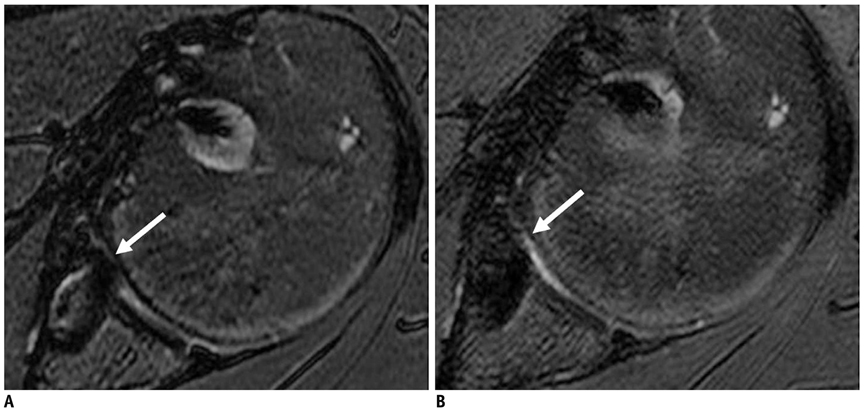
Fig. 10 56-year-old man performed with bankart repair 2 years previous. Axial fat suppressed T2-weighted MR images (A) (3.0 T, TR/TE = 4000/68, FOV = 16 cm, slice = 2 mm, ETL = 8, echo spacing = 15.3, BW = 31.25 kHz, matrix = 320 × 224, acquisition time = 3 min 50 sec) shows that metallic artifact (arrows) from suture anchors in anteroinferior glenoid quadrant which hinders evaluation of glenohumeral joint. Axial IDEAL T2-weighted MR images (B) (3.0 T, TR/TE = 4000/68, FOV = 16 cm, slice = 2 mm, ETL = 8, echo spacing = 13, BW = 31.25 kHz, matrix = 320 × 224, acquisition time = 6 min 11 s) depicts decreased artifact (arrow), rendering clear view of joint space.
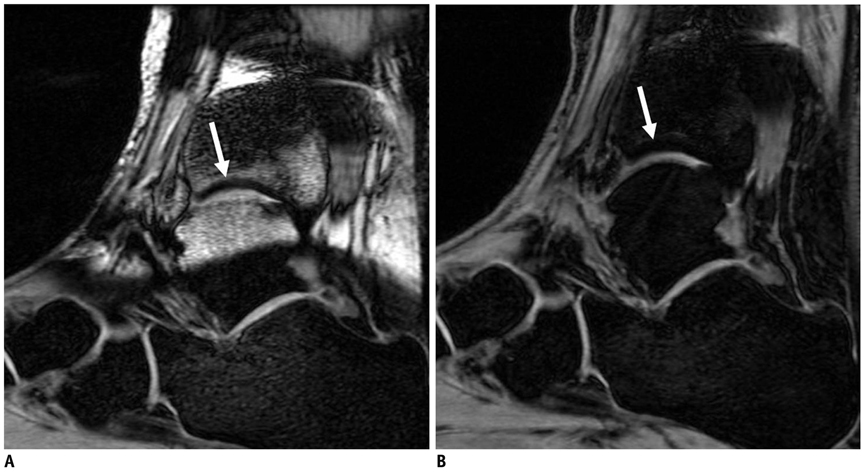
Fig. 11 43-year-old woman with open reduction internal fixation on both malleoli of left ankle joint. Sagittal fat suppressed three-dimensional spoiled gradient echo (3D SPGR) MR images (A) (3.0 T, TR/TE = 17/4, FOV = 14 cm, flip angle = 25, slice = 2 mm, echo spacing = 4.3, BW = 15.63 kHz, matrix = 320 × 224, acquisition time = 3 min 34 sec) shows that susceptibility artifact from metallic implants obscures tibiotalar joint (arrow). Sagittal IDEAL 3D SPGR MR images (B) (3.0 T, TR/TE = 14/4, FOV = 14 cm, flip angle = 25, slice = 2 mm, echo spacing = 4.6, BW = 15.63 kHz, matrix = 320 × 224, acquisition time = 8 min 26 sec) improves visualization of articular cartilage in tibiotalar joint (arrow).
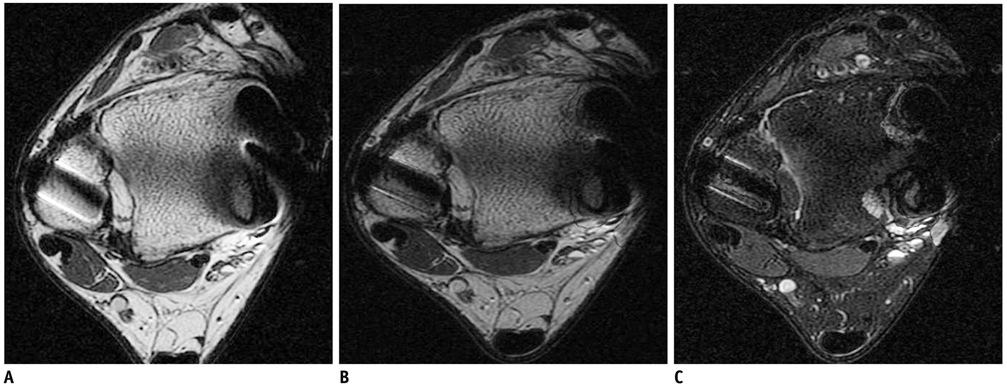
Fig. 12 33-year-old man with tension-band fixation in medial malleolus and external fixation in lateral malleolus of left ankle. Axial T2-weighted images obtained at level of tibiofibular ligament (A) (3.0 T, TR/TE = 4000/68, FOV = 14 cm, slice = 3 mm, ETL = 7, echo spacing = 13.2, BW = 41.67 kHz, matrix = 384 × 256, acquisition time = 3 min 36 sec) show susceptibility artifacts in both malleolar areas. Corresponding axial IDEAL T2-weighted recombined image (B) (3.0 T, TR/TE = 4000/68, FOV = 14 cm, slice = 3 mm, ETL = 7, echo spacing = 11.6, BW = 41.67 kHz, matrix = 384 × 256, acquisition time = 5 min 36 sec) shows image similar to T2-weighted image with decrease in metallic artifact. Note that water-only image (C) can be acquired without any additional scan time.
Reference
-
1. Lee MJ, Kim S, Lee SA, Song HT, Huh YM, Kim DH, et al. Overcoming artifacts from metallic orthopedic implants at high-field-strength MR imaging and multi-detector CT. Radiographics. 2007. 27:791–803.2. Murakami M, Mori H, Kunimatsu A, Abe O, Chikuda H, Ono T, et al. Postsurgical spinal magnetic resonance imaging with iterative decomposition of water and fat with echo asymmetry and least-squares estimation. J Comput Assist Tomogr. 2011. 35:16–20.3. Harris CA, White LM. Metal artifact reduction in musculoskeletal magnetic resonance imaging. Orthop Clin North Am. 2006. 37:349–359. vi4. Cha JG, Jin W, Lee MH, Kim DH, Park JS, Shin WH, et al. Reducing metallic artifacts in postoperative spinal imaging: usefulness of IDEAL contrast-enhanced T1- and T2-weighted MR imaging--phantom and clinical studies. Radiology. 2011. 259:885–893.5. Gerdes CM, Kijowski R, Reeder SB. IDEAL imaging of the musculoskeletal system: robust water fat separation for uniform fat suppression, marrow evaluation, and cartilage imaging. AJR Am J Roentgenol. 2007. 189:W284–W291.6. Zhuo J, Gullapalli RP. AAPM/RSNA physics tutorial for residents: MR artifacts, safety, and quality control. Radiographics. 2006. 26:275–297.7. Berquist TH. Imaging of the postoperative spine. Radiol Clin North Am. 2006. 44:407–418.8. Vandevenne JE, Vanhoenacker FM, Parizel PM, Butts Pauly K, Lang RK. Reduction of metal artefacts in musculoskeletal MR imaging. JBR-BTR. 2007. 90:345–349.9. Bydder GM, Steiner RE, Blumgart LH, Khenia S, Young IR. MR imaging of the liver using short TI inversion recovery sequences. J Comput Assist Tomogr. 1985. 9:1084–1089.10. Fuller S, Reeder S, Shimakawa A, Yu H, Johnson J, Beaulieu C, et al. Iterative decomposition of water and fat with echo asymmetry and least-squares estimation (IDEAL) fast spin-echo imaging of the ankle: initial clinical experience. AJR Am J Roentgenol. 2006. 187:1442–1447.11. Reeder SB, Pineda AR, Wen Z, Shimakawa A, Yu H, Brittain JH, et al. Iterative decomposition of water and fat with echo asymmetry and least-squares estimation (IDEAL): application with fast spin-echo imaging. Magn Reson Med. 2005. 54:636–644.12. Yu H, Reeder SB, Shimakawa A, Brittain JH, Pelc NJ. Field map estimation with a region growing scheme for iterative 3-point water-fat decomposition. Magn Reson Med. 2005. 54:1032–1039.13. Reeder SB, Wen Z, Yu H, Pineda AR, Gold GE, Markl M, et al. Multicoil Dixon chemical species separation with an iterative least-squares estimation method. Magn Reson Med. 2004. 51:35–45.14. Crema MD, Roemer FW, Marra MD, Burstein D, Gold GE, Eckstein F, et al. Articular cartilage in the knee: current MR imaging techniques and applications in clinical practice and research. Radiographics. 2011. 31:37–61.15. Leffler S, Disler DG. MR imaging of tendon, ligament, and osseous abnormalities of the ankle and hindfoot. Radiol Clin North Am. 2002. 40:1147–1170.
- Full Text Links
-
- Actions
-
Cited
- CITED
-
- Close
- Share
-
- Similar articles
-
- Improvement of Fat Suppression and Artifact Reduction Using IDEAL Technique in Head and Neck MRI at 3T
- MR Imaging of the Spine at 3.0T with T2-Weighted IDEAL Fast Recovery Fast Spin-Echo Technique
- Parameters Affecting India Ink Artifacts on Opposed-Phase MR Images
- MR imaging of metallic artifacts
- In Vivo Assessment of Neurodegeneration in Type C Niemann-Pick Disease by IDEAL-IQ
