Korean J Ophthalmol.
2010 Apr;24(2):89-95. 10.3341/kjo.2010.24.2.89.
A Clinical Applications of Photopic Negative Response (PhNR) for the Treatment of Glaucoma and Diabetic Retinopathy
- Affiliations
-
- 1Department of Ophthalmology, Soonchunhyang University College of Medicine, Bucheon, Korea. yhohn@schbc.ac.kr
- KMID: 946000
- DOI: http://doi.org/10.3341/kjo.2010.24.2.89
Abstract
- PURPOSE
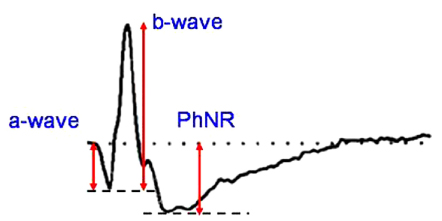
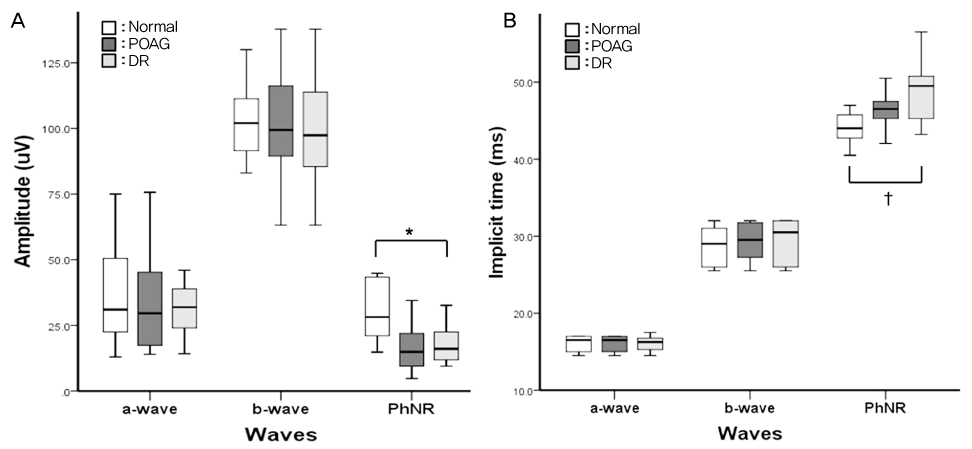
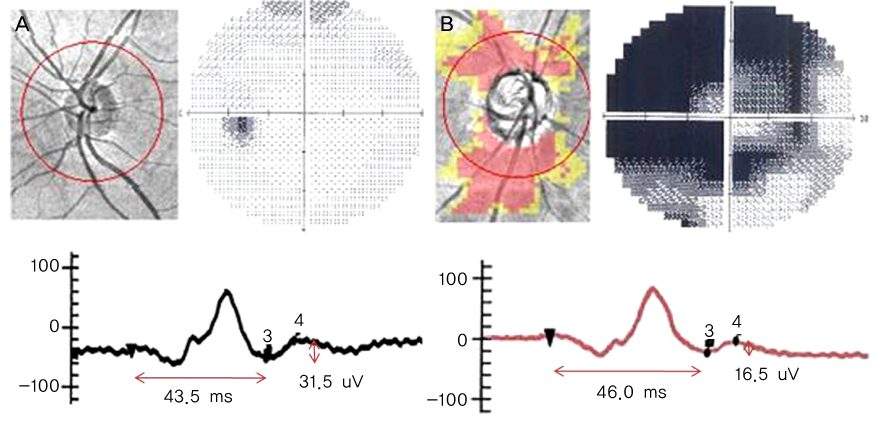
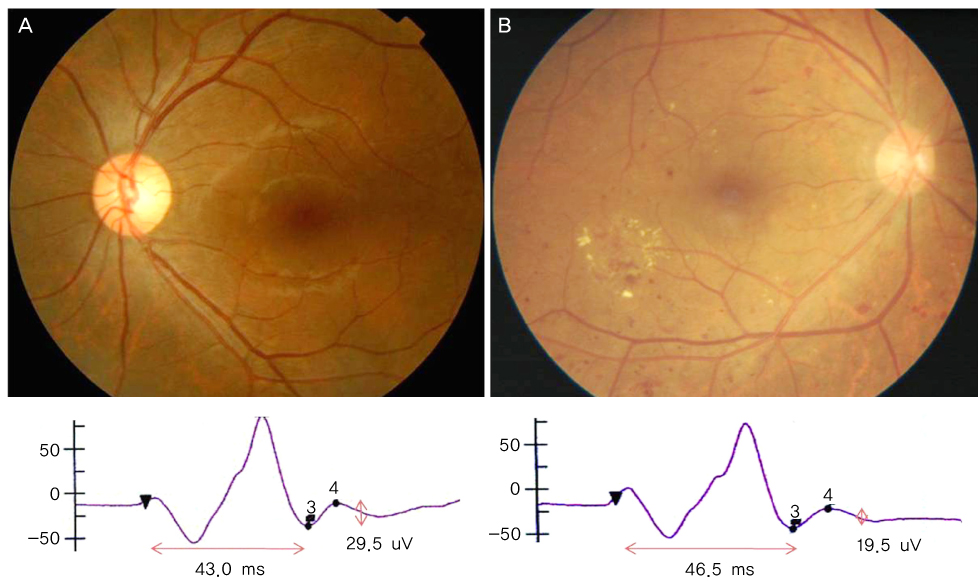
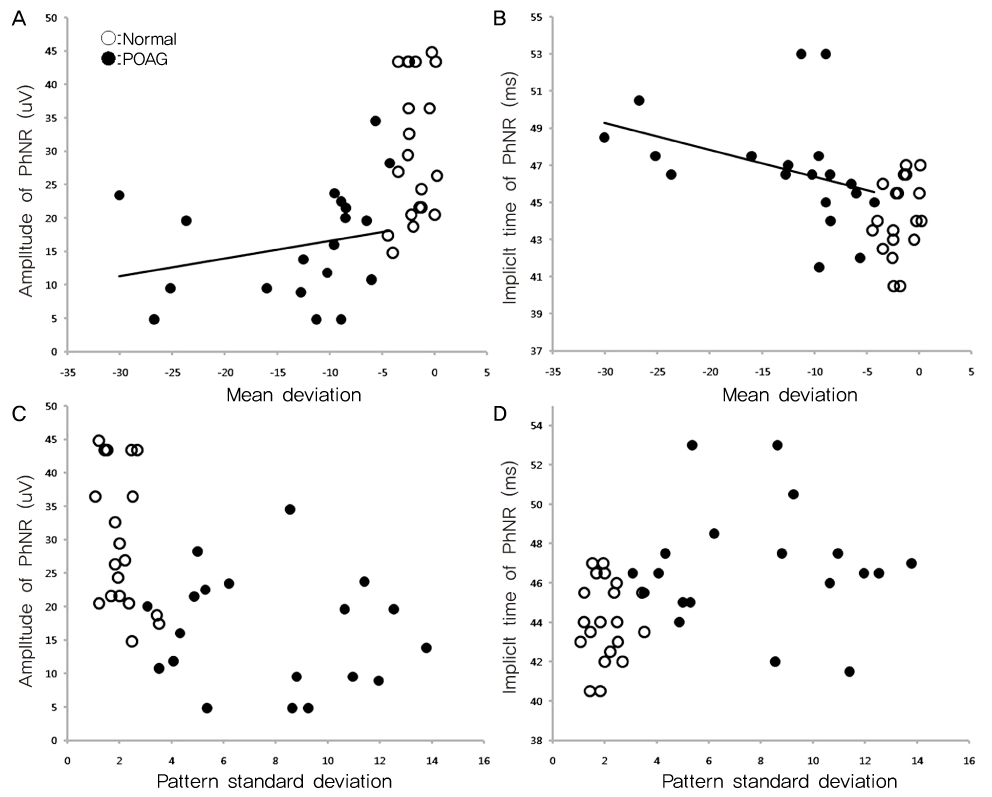
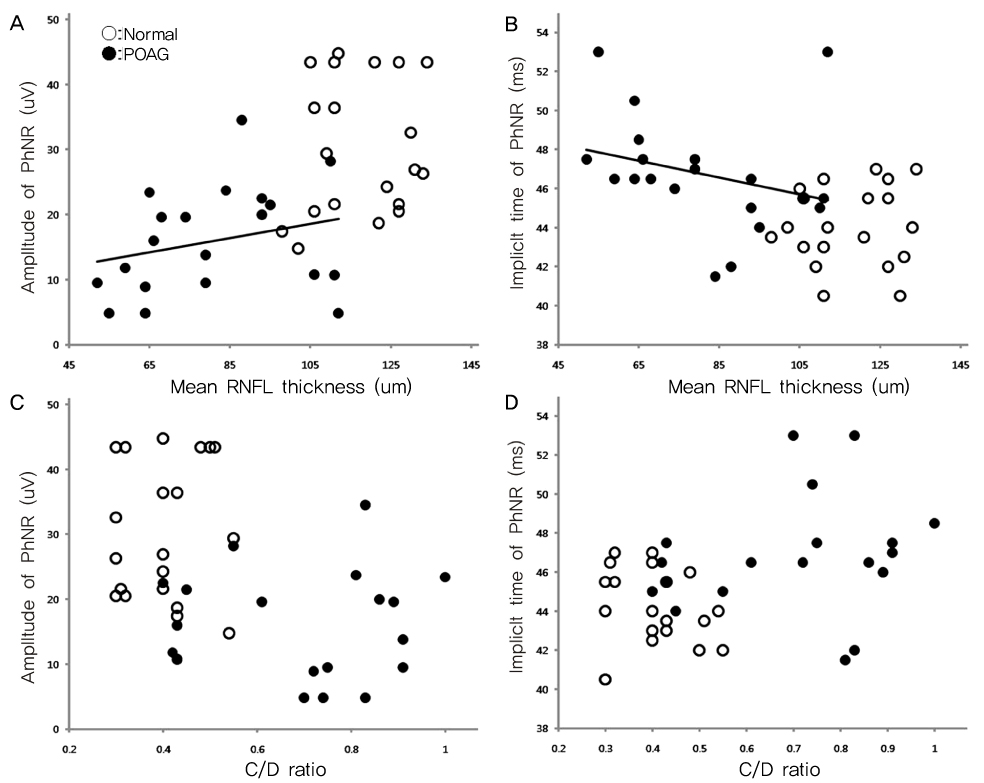
To determine the clinical utility of using photopic negative response (PhNR) by comparing the parameters for normal, primary open angle glaucoma (POAG) and diabetic retinopathy (DR). METHODS: Electroretinography (UTAS E-3000) was performed in 12 normal, 12 POAG, and 12 DR subjects. Amplitudes and implicit times for PhNR were compared among the three groups. The mean deviation (MD) and pattern standard deviation (PSD) were evaluated using standard automated perimetry (SAP). The mean retinal nerve fiber layer (RNFL) thickness and cup-disc ratio were measured using optical coherence tomography. RESULTS: The a-waves and b-waves were not different among the three groups. However, compared to normal subjects, the PhNR amplitudes were reduced, and the PhNR implicit times were prolonged in the POAG and DR patients (p<0.001, p<0.001). The MD and RNFL thickness were correlated with the amplitudes and implicit times for the PhNR. CONCLUSIONS: PhNR may be useful for the detection of inner retinal dysfunction, which is seen in patients who have glaucoma or diabetic retinopathy.
MeSH Terms
Figure
Reference
-
1. Marmor MF, Arden GB, Nisson SE, et al. Standard for clinical electroretinography. Arch Ophthalmol. 1989. 107:816–819.2. Marmor MF, Zrenner E. Standard for clinical electroretinography. Doc Ophthalmol. 1995. 89:199–210.3. Marmor MF. An updated standard for clinical electroretinography. Arch Ophthalmol. 1995. 113:1375–1376.4. Marmor MF. The ERG is alive and well. Arch Ophthalmol. 1995. 113:1371–1372.5. Drasdo N, Aldedasi YH, Chiti Z, et al. The s-cone PHNR and pattern ERG in primary open angle glaucoma. Invest Ophthalmol Vis Sci. 2001. 42:1266–1272.6. Viswanathan S, Frishman LJ, Robson JG, Walters JW. The photopic negative response of the flash electroretinogram in primary open angle glaucoma. Invest Ophthalmol Vis Sci. 2001. 42:514–522.7. Colotto A, Falsini B, Salgarello T, et al. Photopic negative response of the human ERG: losses associated with glaucomatous damage. Invest Ophthalmol Vis Sci. 2000. 41:2205–2211.8. Machida S, Gotoh Y, Tanaka M, et al. Predominant loss of the photopic negative response in central retinal artery occlusion. Am J Ophthalmol. 2004. 137:938–940.9. Korean Society for Clinical Electrophysiology of Vision (KSCEV). Korean Society for Clinical Electrophysiology of Vision. Clinical electrophysiology of vision. 2009. Seoul: Korean Society for Clinical Electrophysiology of Vision;36–45.10. Viswanathan S, Frishman LJ, Robson JG, et al. The photopic negative response of the macaque electroretinogram: reduction by experimental glaucoma. Invest Ophthalmol Vis Sci. 1999. 40:1124–1136.11. Ventura LM, Sorokac N, De Los Santos R, et al. The relationship between retinal ganglion cell function and retinal nerve fiber thickness in early glaucoma. Invest Ophthalmol Vis Sci. 2006. 47:3904–3911.12. Barkana Y, Harizman N, Gerber Y, et al. Measurements of optic disk size with HRT II, Stratus OCT, and funduscopy are not interchangeable. Am J Ophthalmol. 2006. 142:375–380.13. Jonas JB, Budde WM, Panda-Jonas S. Ophthalmoscopic evaluation of the optic nerve head. Surv Ophthalmol. 1999. 43:293–320.14. Ambati J, Chalam KV, Chawla DK, et al. Elevated gamma aminobutyric acid, glutamate and vascular endothelial growth factor levels in the vitreous of patients with proliferative diabetic retinopathy. Arch Ophthalmol. 1997. 115:1161–1166.15. Nakazawa T, Takahashi H, Nishijima K, et al. Pitavastatin prevents NMDA-induced retinal ganglion cell death by suppressing leukocyte recruitment. J Neurochem. 2007. 100:1018–1031.16. Kizawa J, Machida S, Kobayashi T, et al. Changes of oscillatory potentials and photopic negative response in patients with early diabetic retinopathy. Jpn J Ophthalmol. 2006. 50:367–373.
- Full Text Links
- Actions
-
Cited
- CITED
-
- Close
- Share
- Similar articles
-
- The Role of Electroretinography in Assessing the Progression of Diabetic Retinopathy
- ON and OFF Responses of the Electroretinogram in Patients with Glaucoma
- Photopic Flash ERG Changes in Diabetic Retinopathy: with reference to severity of diabetic retinopathy
- Photopic Negative Response (PhNR) in Normal Subjects
- Blue-on-Green Flash Induces Maximal Photopic Negative Response and Oscillatory Potential and Serves as a Diagnostic Marker for Glaucoma in Rat Retina

