The Optimization of Scan Timing for Contrast-Enhanced Magnetic Resonance Angiography
- Affiliations
-
- 1Department of Diagnostic Radiology, School of Medicine, Kyungpook National University, Taegu, South Korea. jonglee@knu.ac.kr
- KMID: 877074
- DOI: http://doi.org/10.3348/kjr.2000.1.3.142
Abstract
OBJECTIVE
To determine the optimal scan timing for contrast-enhanced magnetic resonance angiography and to evaluate a new timing method based on the arteriovenous circulation time. MATERIALS AND METHODS: Eighty-nine contrast-enhanced magnetic resonance angiographic examinations were performed mainly in the extremities. A 1.5T scanner with a 3-D turbo-FLASH sequence was used, and during each study, two consecutive arterial phases and one venous phase were acquired. Scan delay time was calculated from the time-intensity curve by the traditional (n = 48) and/or the new (n = 41) method. This latter was based on arteriovenous circulation time rather than peak arterial enhancement time, as used in the traditional method. The numbers of first-phase images showing a properly enhanced arterial phase were compared between the two methods. RESULTS: Mean scan delay time was 5.4 sec longer with the new method than with the traditional. Properly enhanced first-phase images were found in 65% of cases (31/48) using the traditional timing method, and 95% (39/41) using the new method. When cases in which there was mismatch between the target vessel and the time-intensity curve acquisition site are excluded, erroneous acquisition occurred in seven cases with the traditional method, but in none with the new method. CONCLUSION: The calculation of scan delay time on the basis of arteriovenous circulation time provides better timing for arterial phase acquisition than the traditional method.
Keyword
MeSH Terms
Figure
-

Fig. 1 Time-intensity data obtained by test-bolus study. A, B. Due to the fluctuating pattern of each curve, median values were used to measure parameters such as arterial peak enhancement time (Tp), arterial enhancement time (Tae), and venous enhancement time (Tve). After the injection of contrast medium for 0.66 sec, bolus duration was 15 secs, representing inequality between this and injection duration. These scans were obtained at the infrarenal abdominal aorta and inferior vena cava. A. The arterial curve was obtained using the traditional method of scan delay time calculation. B. The arteriovenous curve was obtained using the new method. Arteriovenous circulation time (Tav) was calculated by subtracting Tae from Tve.
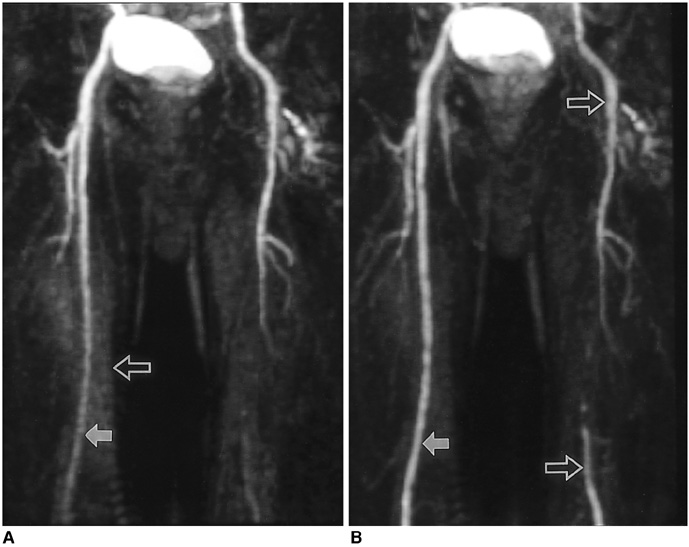
Fig. 2 Seventy-one-year-old man suffering from caludication of the left lower extremity, examined by the traditional method. A multi-phase study was performed, and the acquisition time of each phase was 15 seconds. Due to mismatched timing of the first phase (A), the second phase (B) should be used as the arterial phase image. A. The first phase image shows insufficiently enhanced femoral arteries (solid arrow). Due to the acquisition of a non-enhanced mask image before previous station angiography, background enhancement (open arrow) is noted. B. The second-phase image discloses more densely enhanced femoral artery (solid arrow) and its branches. Atherosclerosis results in abrupt cut-off of the left superficial femoral artery, with reconstituted distal run-off (open arrows).

Fig. 3 Forty-two-year-old woman suffering from shortness of breath, examined by the new scan timing method. Time intensity curves were drawn at the pulmonary trunk and left atrium. Pulmonary arteriovenous circulation time and acquisition time were 13 and 24 seconds, respectively. A, B, and C. The first phase shows dilated right cardiac chambers, pulmonary trunk and proximal pulmonary arteries (open arrows), representing chronic pulmonary hypertension. No pulmonary vein or left cardiac chambers are visualized on these images indicating the exact timing of data acquisition. The trabeculated septal border of the right ventricle (double solid arrows in B) represents the unenhanced left ventricle. In the left brachiocephalic vein, contrast medium which remained after bolus passage is noted (single solid arrows). D. The second-phase image shows systemic arteries and pulmonary veins not visualized during the first phase (solid arrow).
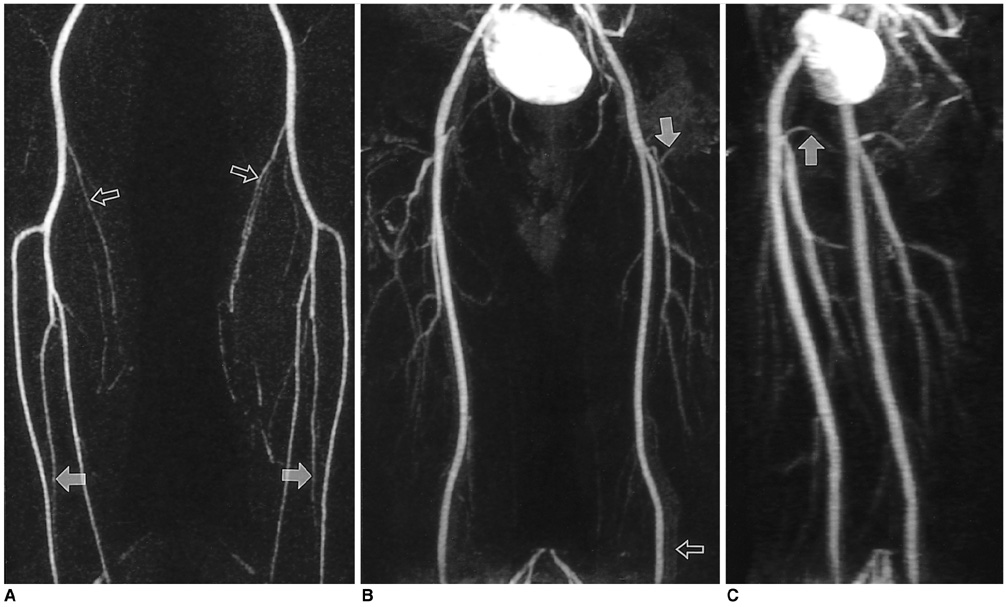
Fig. 4 Thirty-eight-year-old man examined by the new timing method for preoperative evaluation of arteries of the lower extremities. Arteriovenous circulation time and acquisition time were 24 and 25 seconds, respectively. A. The first station image obtained at the legs clearly shows popliteal and tibial arteries, along with smaller (e.g. sural) branches (open arrows). Both peroneal arteries are also clearly visualized from their origin to the level of the ankle (solid arrows). B. The second station image obtained at the thigh shows slight background enhancement and venous overprojection (open arrow). Small branches such as the femoral circumflex arteries (solid arrow) are, however, clearly visualized. C. Left anterior oblique view clearly shows proximal portions of both medial femoral circumflex arteries (solid arrow).

Fig. 5 Comparison of scan delay times obtained using new and traditional methods. The new method shows longer delay times than the traditional.
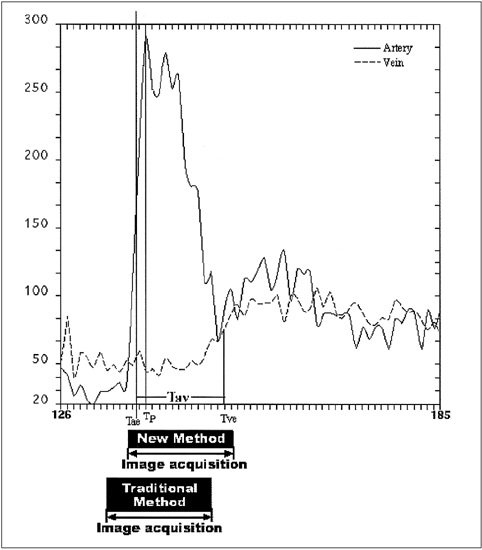
Fig. 6 Arterial and venous time-intensity curves of a test-dose study with comparison of acquisition delay times. The test-dose was 2ml and the injection rate was 3 ml/sec. Arterial enhancement time (Tae), venous enhancement time (Tve), arterial peak enhancement time (Tp), and arteriovenous circulation time (Tav) were 12, 25, 13, and 13 seconds, respectively. For the main scan, acquisition and injection times, were assumed to be 16 and 4 seconds. The acquisition periods (black boxes) positioned by each delay time indicate that the traditional timing method initiates image acquisition earlier than the new method and covers more of the unenhanced portion before arterial enhancement.
Reference
-
1. Earls JP, Rofsky NM, DeCorato DR, Krinsky GA, Winreb JC. Breath-hold single-dose gadolinium-enhanced three-dimensional MR aortography: usefulness of a timing examination and MR power injector. Radiology. 1996. 201:705–710.2. Prince MR. Gadolinium-enhanced MR aortography. Radiology. 1994. 191:155–164.3. Debatin JF, Spritzer CE, Grist TM, et al. Imaging of the renal arteries: value of MR angiography. AJR. 1991. 157:981–990.4. Prince MR, Narasimham DL, Stanley JC, et al. Breath-hold gadolinium-enhanced MR angiography of the abdominal aorta and its major branches. Radiology. 1995. 197:785–792.5. Holland GA, Dougherty L, Carpenter JP, et al. Breath-hold ultrafast three-dimensional gadolinium-enhanced MR angiography of the aorta and the renal and other visceral abdominal arteries. AJR. 1996. 166:971–981.6. Snidow JJ, Johnson MS, Harris VJ, et al. Three-dimensional gadolinium-enhanced MR angiography for aortoiliac inflow assessment plus renal artery screening in a single breath-hold. Radiology. 1996. 198:725–732.7. Leung DA, McKinnon GC, Davis CP, Pfammatter T, Krestin GP, Debatin JF. Breath-hold, contrast-enhanced, three dimensional MR angiography. Radiology. 1996. 201:569–571.8. Lin W, Haacke EM, Smith AS, Clampitt ME. Gadolinium-enhanced high-resolution MR angiography with adaptive vessel tracking: preliminary results in the intracranial circulation. J Magn Reson Imaging. 1992. 2:277–284.9. Marchal G, Bosmans H, Van Fraeyenhoven L, et al. Intracranial vascular lesions: optimization and clinical evaluation of three-dimensional time-of-flight MR angiography. Radiology. 1990. 175:443–448.10. Prince MR, Yucel EK, Kaufman JA, et al. Dynamic gadolinium-enhanced three-dimensional abdominal MR arteriography. J Magn Reson Imaging. 1993. 3:877–881.11. Pavone P, Giuliani S, Cardone G, et al. Intraarterial portography with gadopentetate dimeglumine: improved liver-to-lesion contrast in MR imaging. Radiology. 1991. 179:693–697.12. Losef SV, Rajan SS, Patt RH, et al. Gadolinium-enhanced magnitude contrast MR angiography of popliteal and tibial arteries. Radiology. 1992. 184:349–355.13. Adamis MK, Li W, Wielopolski PA, et al. Dynamic contrast-enhanced subtraction MR angiography of the lower extremities: initial evaluation with a multisection two-dimensional time-of-flight sequence. Radiology. 1995. 196:689–695.14. Kopka L, Vosshenrich R, Mueller D, Fischer U, Rodenwaldt J, Grabbe E. Results of a contrast-enhanced three-dimensional MR angiography in a single breath-hold after optimization of the contrast material bolus. Fortschr Rontgenstr. 1997. 166:15–20.15. Ho KY, Leiner T, de Haan MW, Kessels AG, Kitslaar PJ, Engelshoven JM. Peripheral vascular tree stenoses: evaluation with moving-bed infusion-tracking MR angiography. Radiology. 1998. 206:683–692.16. Foo TK, Saranathan M, Prince MR, Chenevert TL. Automated detection of bolus arrival and initiation of data acquisition in fast, three-dimensional, gadolinium-enhanced MR angiography. Radiology. 1997. 203:275–280.17. Kopka L, Vosshenrich R, Rodenwaldt J, Grabbe E. Differences in injection rates on contrast-enhanced breath-hold three-dimensional MR angiography. AJR. 1998. 170:345–348.18. Willems JL, Roelandt JR, Van de Vel HR, Joossens JV. The circulation time in the elderly. Am J Cardiol. 1971. 27:155–161.19. Pierson RN, Grieco M, Swinton N, Dubin M. Circulation time end points: a quantitative comparison of saccharin and radioiodinated albumin as indicators. Circulation. 1966. 34:997–1004.20. Selzer A, Dunlap RW, Wray HW, Russell J. A critical appraisal of the circulation time test. Arch Intern Med. 1968. 122:491–495.21. Becker GJ, Holden RW. Sodium dehydrocholate circulation times in digital subtraction angiography. AJR. 1983. 140:817–818.22. Lauzon ML, Holdsworth DW, Frayne R, Rutt BK. Effects of physiologic waveform variability in triggered MR imaging: theoretical analysis. J Magn Reson Imaging. 1994. 4:853–867.23. Mezrich R. Perspective on k space (tutorial). Radiology. 1995. 195:297–315.24. Maki JH, Prince MR, Londy FJ, Chenevert TL. The effects of time varying intravascular signal intensity and k-space acquisition order on three-dimensional MR angiography image quality. J Magn Reson Imaging. 1996. 6:642–651.
- Full Text Links
-
- Actions
-
Cited
- CITED
-
- Close
- Share
-
- Similar articles
-
- Optimal Cardiac Magnetic Resonance Contrast-Enhanced Timing Robust Angiography (CMR-CENTRA) for the Three-Dimensional Reconstruction of the Bilateral Atria in the Electroanatomic Mapping (EAM) of Atrial Fibrillation
- Contrast-Enhanced Magnetic Resonance Angiography: Dose the Test Dose Bolus Represent the Main Dose Bolus Accurately?
- Principles of Magnetic Resonance Angiography Techniques
- Assessment of Contrast-enhanced 3D Ultrafast Pulmonary MR Angiography Using Test Injection: Comparison betweenSingle Dose and Double Dose
- Image Findings in Brain Developmental Venous Anomalies
