Ann Lab Med.
2023 Jan;43(1):55-63. 10.3343/alm.2023.43.1.55.
Indirect Method for Estimation of Reference Intervals of Inflammatory Markers
- Affiliations
-
- 1Department of Laboratory Medicine, Seoul St. Mary’s Hospital, College of Medicine, The Catholic University of Korea, Seoul, Korea
- 2Department of Laboratory Medicine, Incheon St. Mary’s Hospital, College of Medicine, The Catholic University of Korea, Seoul, Korea
- 3Research and Development Institute for In Vitro Diagnostic Medical Devices, College of Medicine, The Catholic University of Korea, Seoul, Korea
- KMID: 2551586
- DOI: http://doi.org/10.3343/alm.2023.43.1.55
Abstract
- Background
The direct method for reference interval (RI) estimating is limited due to the requirement of resources, difficulties in defining a non-diseased population, or ethical problems in obtaining samples. We estimated the RI for inflammatory biomarkers using an indirect method (RII).
Methods
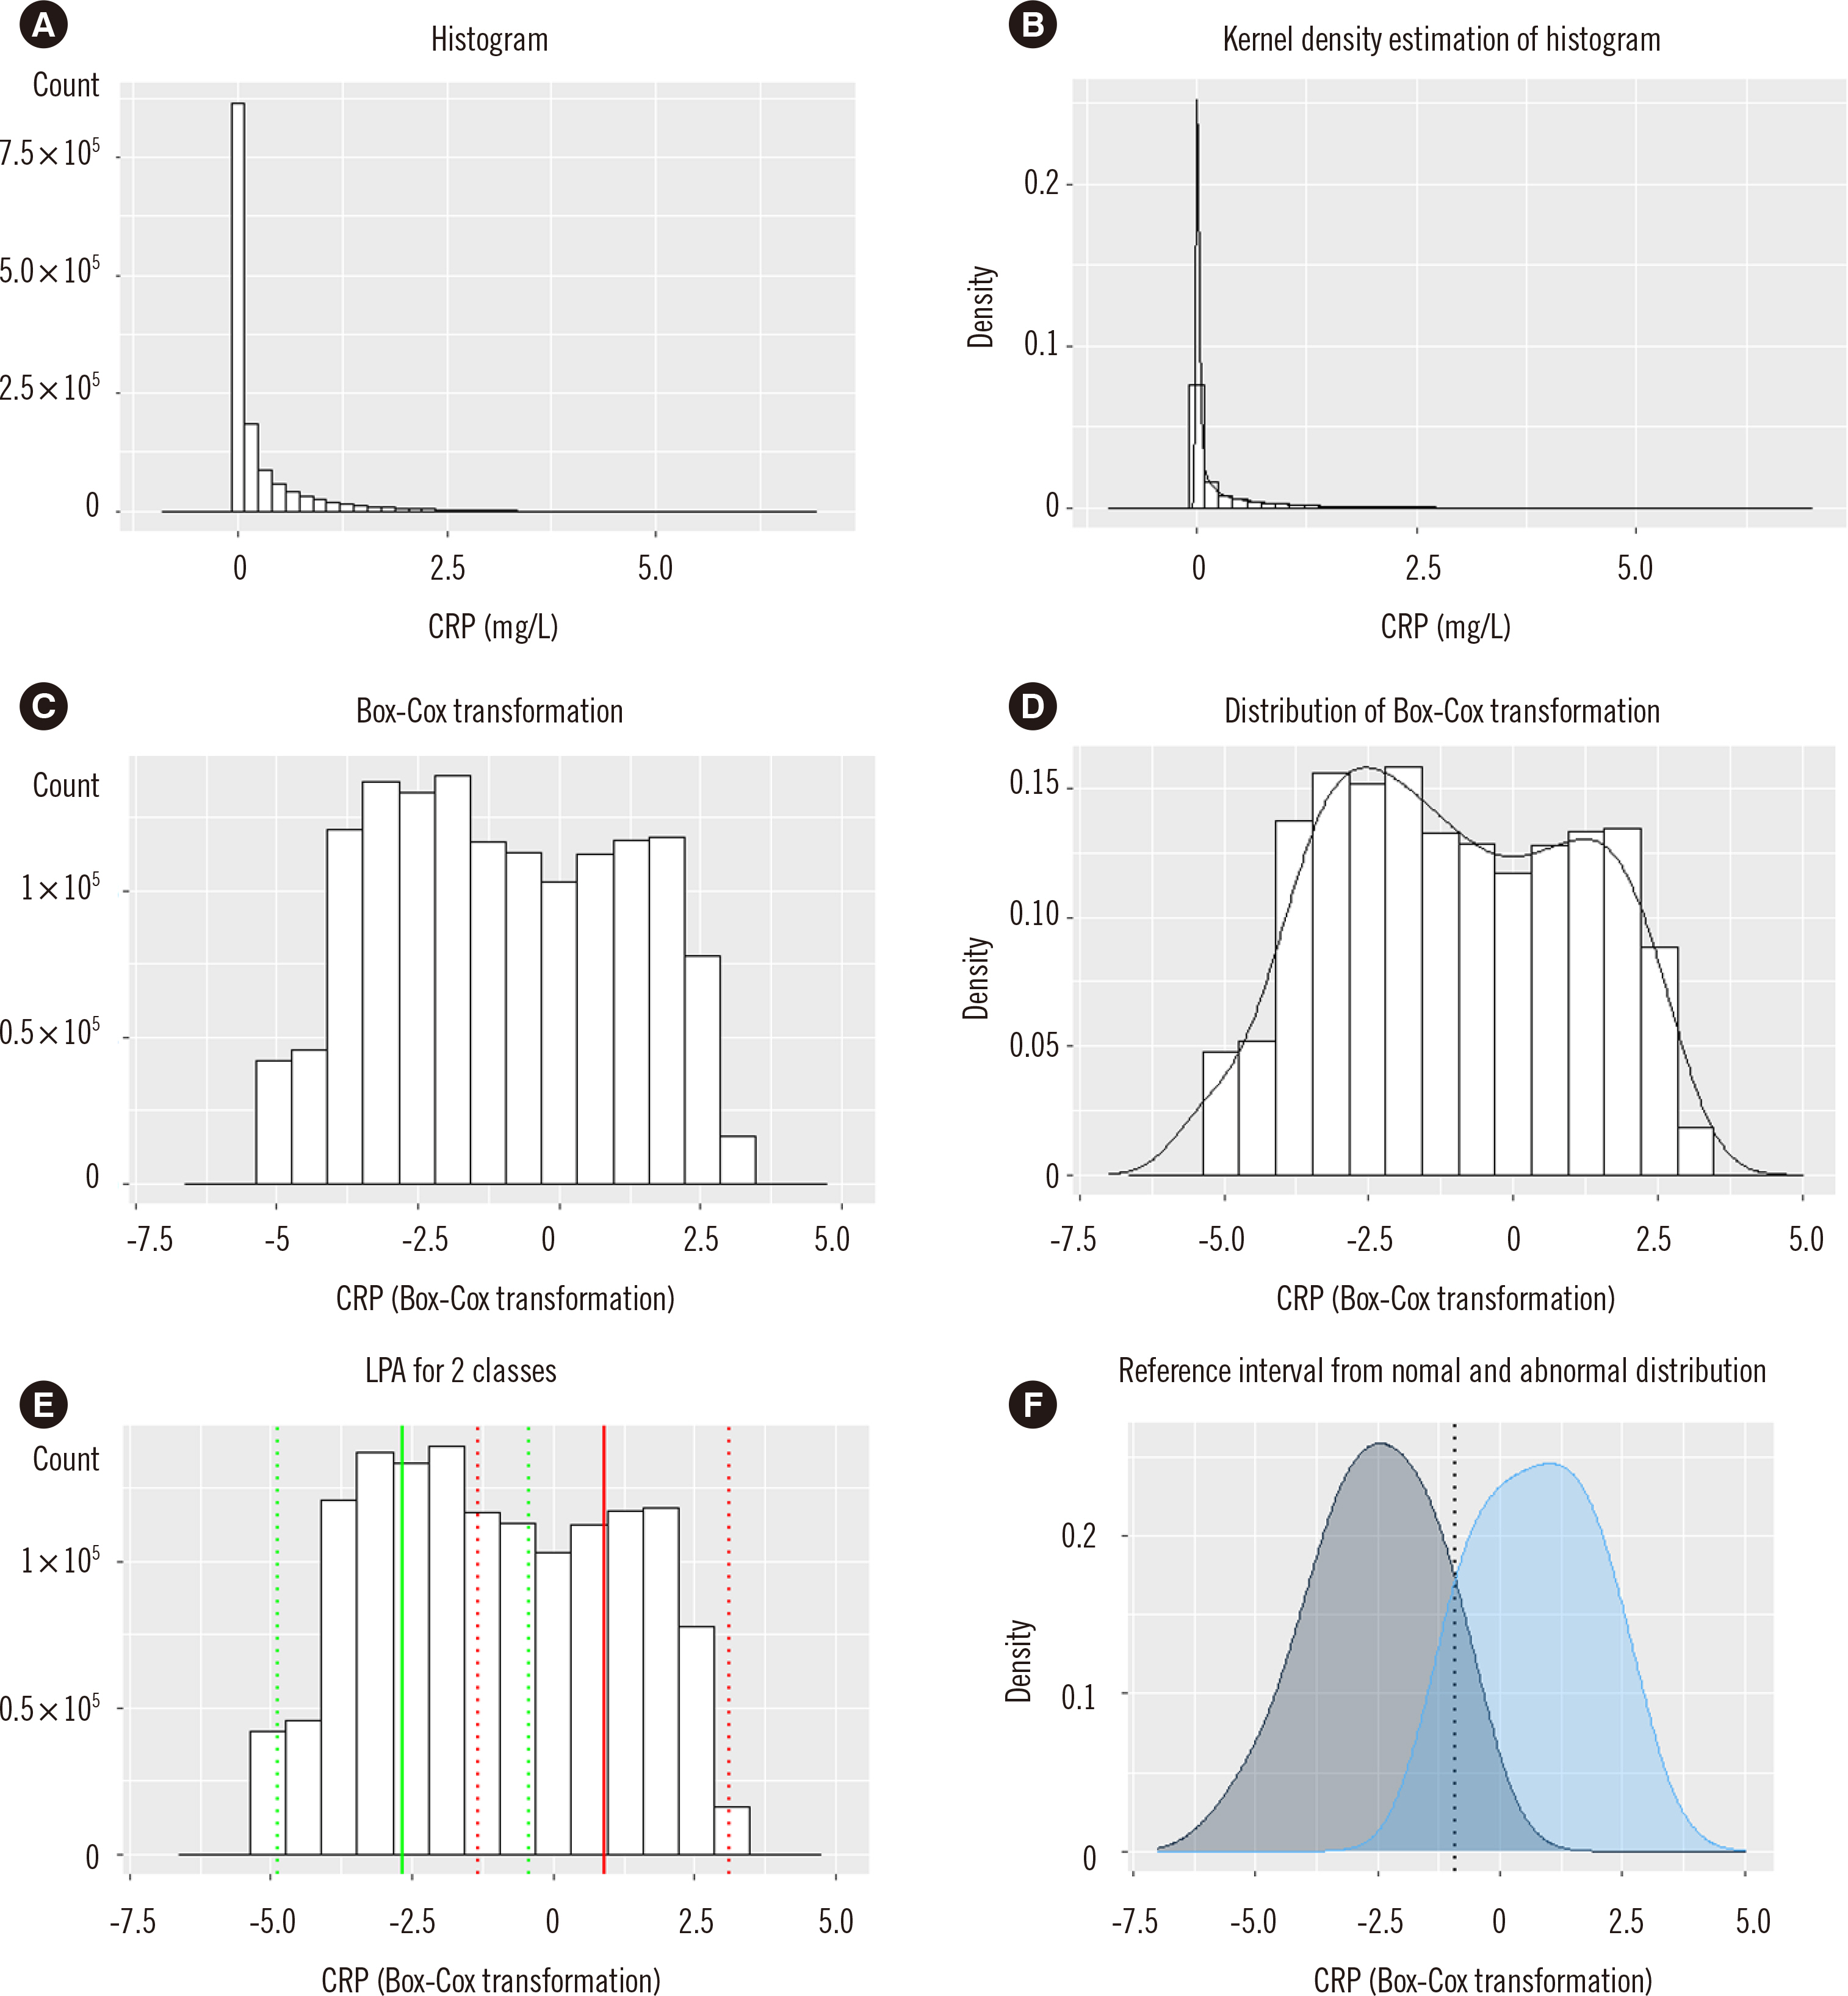
C-reactive protein (CRP), erythrocyte sedimentation rate (ESR) and presepsin (PSEP) data of patients visiting a single hospital were retrieved from April 2009 to April 2021. Right-skewed data were transformed using the Box-Cox transformation method. A mixed population of non-diseased and diseased distributions was assumed, followed by latent profile analysis for the two classes. The intersection point of the distribution curve was estimated as the RI. The influence of measurement size was evaluated as the ratio of abnormal values and adjustment (n×bandwidth) of the distribution curve.
Results
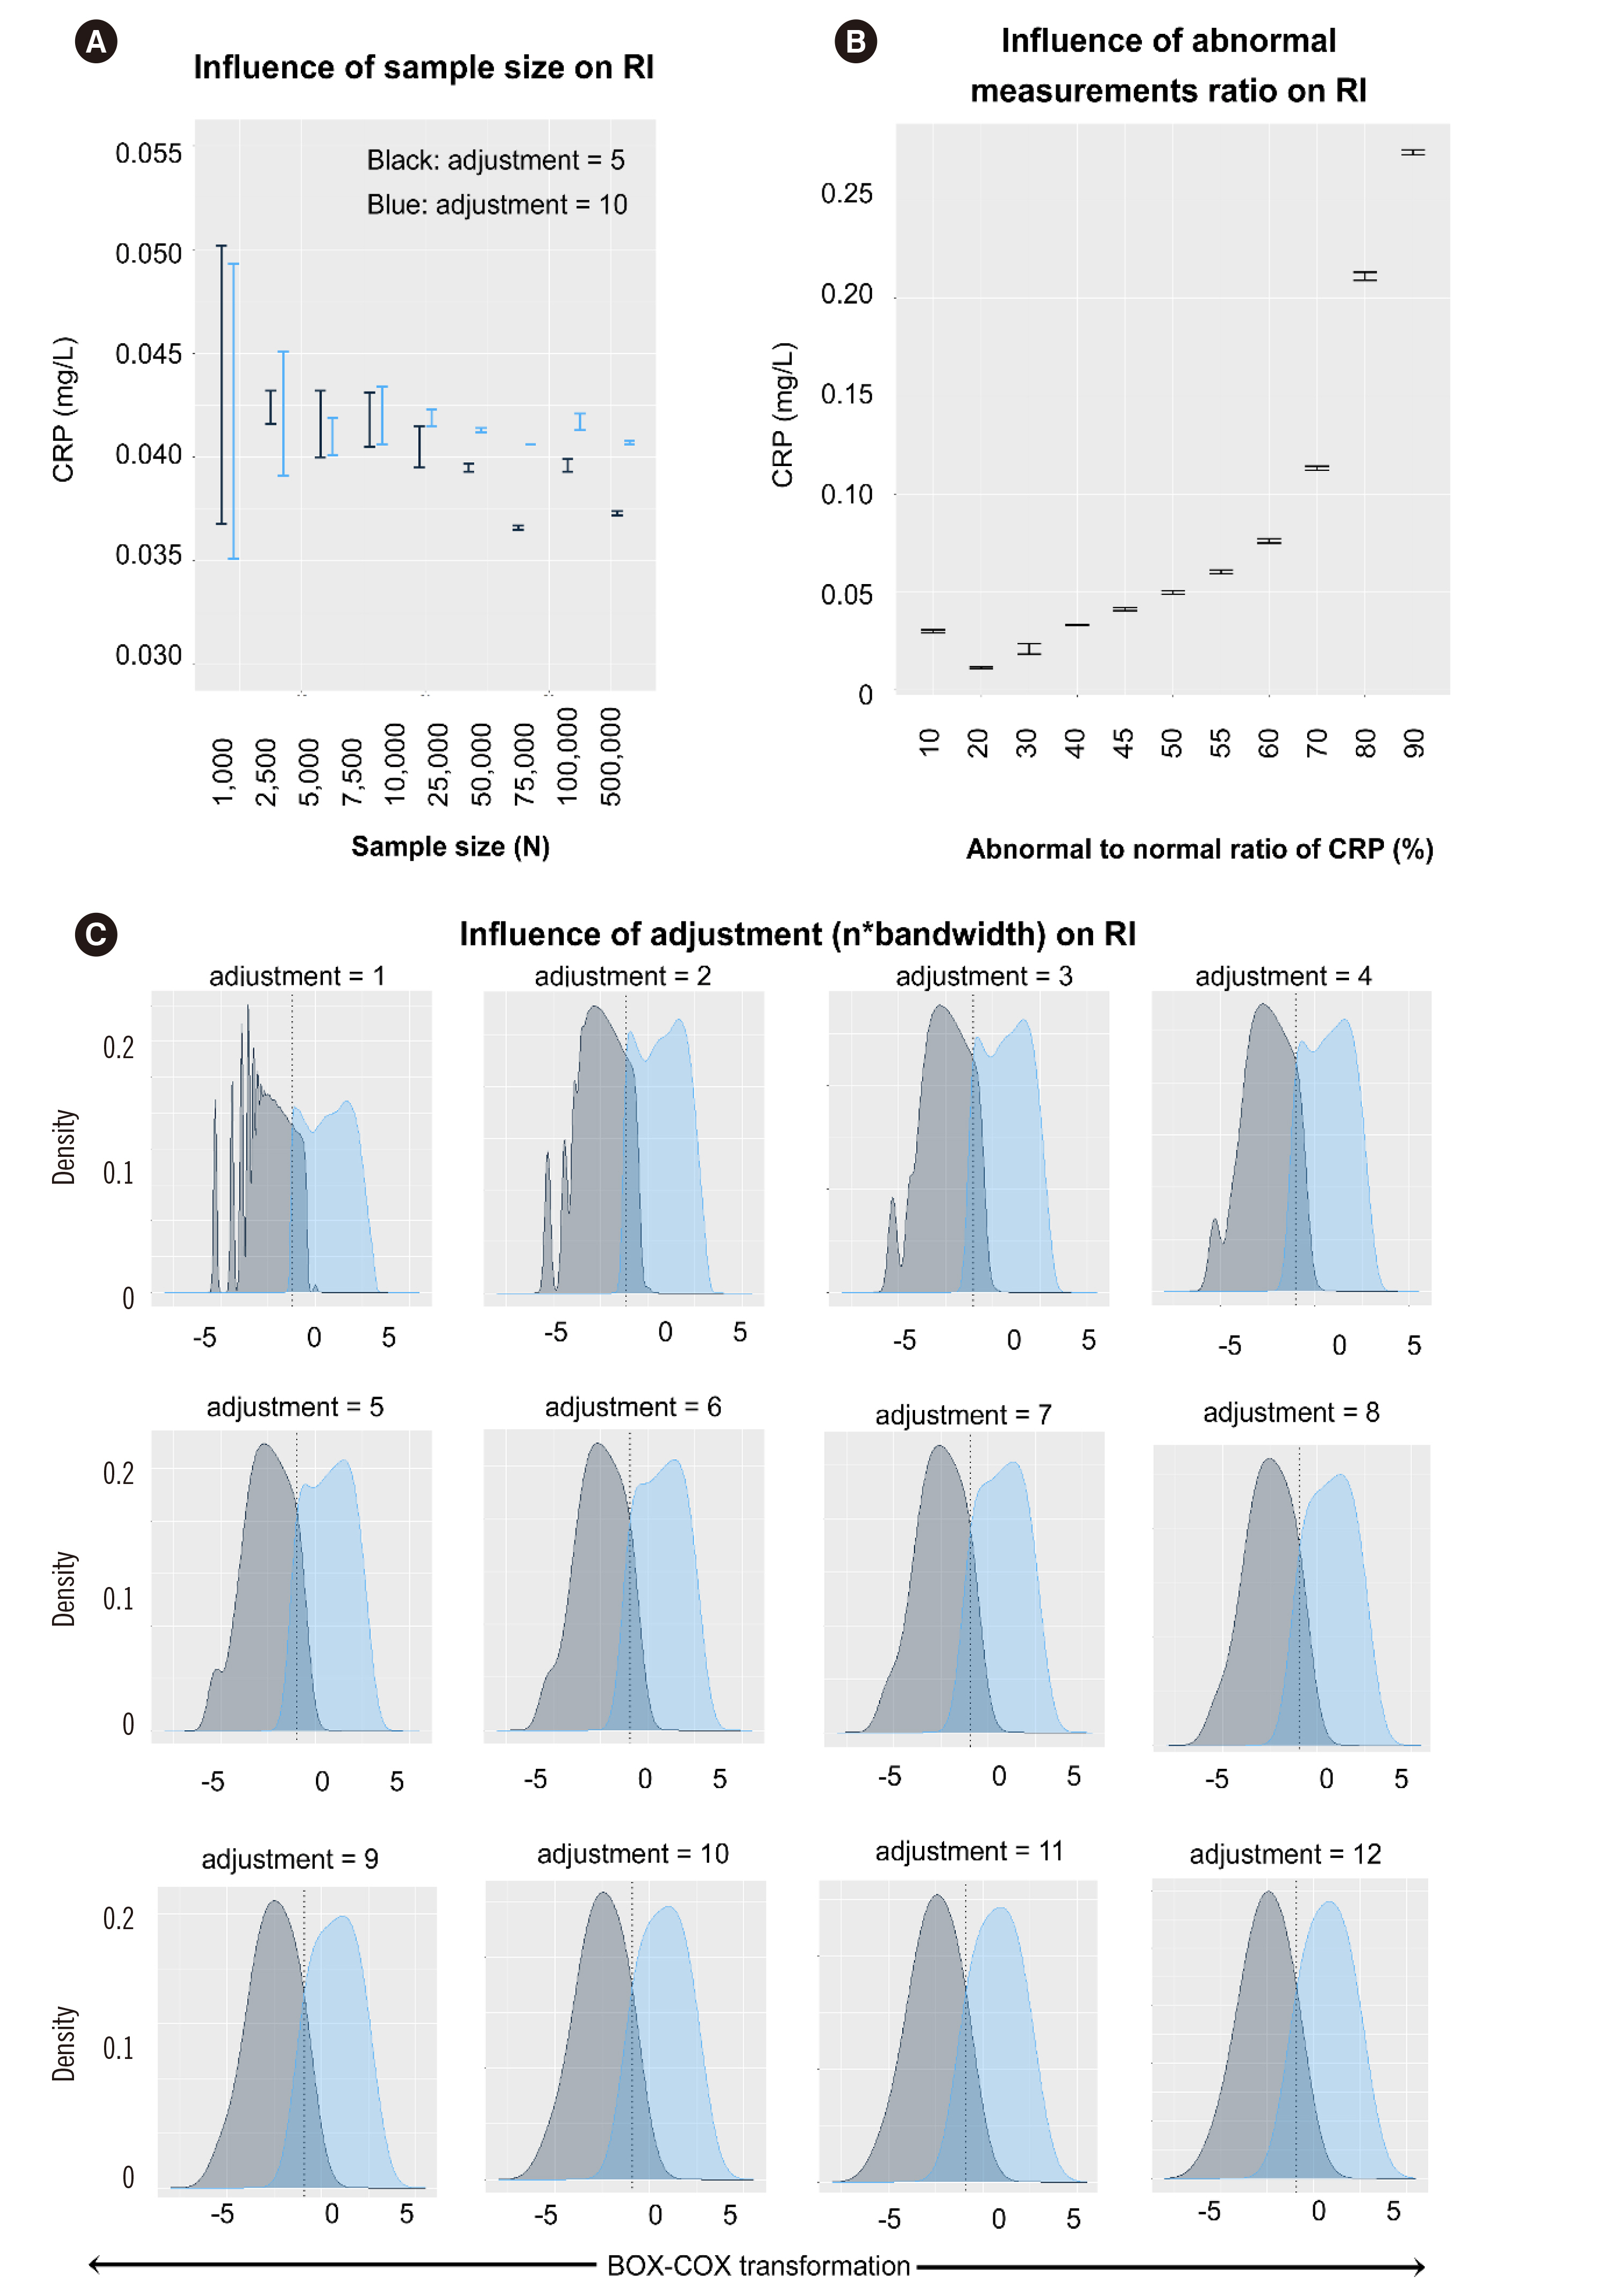
The RIs estimated by the proposed RII method (existing method) were as follows: CRP, 0–4.1 (0–4.7) mg/L; ESR, 0–10.2 (0–15) mm/hr and PSEP, 0–411 (0–300) pg/mL. Measurement sizes ≥2,500 showed stable results. An abnormal-to-normal value ratio of 0.5 showed the most accurate result for CRP. Adjustment values ≤5 or >5 were applicable for a measurement size <25,000 or ≥25,000, respectively.
Conclusions
The proposed RII method could provide additional information for RI verification or estimation with some limitations.
Keyword
Figure
Cited by 1 articles
-
Functional Reference Limits: Describing Physiological Relationships and Determination of Physiological Limits for Enhanced Interpretation of Laboratory Results
Tyng Yu Chuah, Chun Yee Lim, Rui Zhen Tan, Busadee Pratumvinit, Tze Ping Loh, Samuel Vasikaran, Corey Markus
Ann Lab Med. 2023;43(5):408-417. doi: 10.3343/alm.2023.43.5.408.
Reference
-
1. Grasbeck R, Saris NE. 1969; Establishment and use of normal values. Scand J Clin Lab Investig Suppl. 110:62–3.2. Haeckel R, Wosniok W, Arzideh F. 2007; A plea for intra-laboratory reference limits. Part 1. General considerations and concept for determination. Clin Chem Lab Med. 45:1033–42. DOI: 10.1515/CCLM.2007.249. PMID: 17867993.3. CLSI. 2008. Defining, establishing, and verifying reference intervals in the clinical laboratory. Approved guideline. 3rd ed. CLSI document c28-A3. Clinical and Laboratory Standards Institute;Wayne, PA:4. Ozarda Y, Higgins V, Adeli K. 2018; Verification of reference intervals in routine clinical laboratories: practical challenges and recommendations. Clin Chem Lab Med. 57:30–7. DOI: 10.1515/cclm-2018-0059. PMID: 29729142.
Article5. Zierk J, Arzideh F, Kapsner LA, Prokosch HU, Metzler M, Rauh M. 2020; Reference interval estimation from mixed distributions using truncation points and the Kolmogorov-Smirnov distance (kosmic). Sci Rep. 10:1704. DOI: 10.1038/s41598-020-58749-2. PMID: 32015476. PMCID: PMC6997422.
Article6. Ozarda Y, Sikaris K, Streichert T, Macri J. IFCC Committee on Reference Intervals and Decision Limits (C-RIDL). 2018; Distinguishing reference intervals and clinical decision limits-a review by the IFCC Committee on Reference Intervals and Decision Limits. Crit Rev Clin Lab Sci. 55:420–31. DOI: 10.1080/10408363.2018.1482256. PMID: 30047297.7. Martinez-Sanchez L, Marques-Garcia F, Ozarda Y, Blanco A, Brouwer N, Canalias F, et al. 2021; Big data and reference intervals: rationale, current practices, harmonization and standardization prerequisites and future perspectives of indirect determination of reference intervals using routine data. Adv Lab Med. 2:9–16. DOI: 10.1515/almed-2020-0034.
Article8. Holmes DT, Buhr KA. 2019; Widespread incorrect implementation of the Hoffmann method, the correct approach, and modern alternatives. Am J Clin Pathol. 151:328–36. DOI: 10.1093/ajcp/aqy149. PMID: 30475946.
Article9. Manrai AK, Patel CJ, Ioannidis JPA. 2018; In the era of precision medicine and big data, who is normal? JAMA. 319:1981–2. DOI: 10.1001/jama.2018.2009. PMID: 29710130. PMCID: PMC7572221.
Article10. Obstfeld AE, Patel K, Boyd JC, Drees J, Holmes DT, Ioannidis JPA, et al. 2021; Data mining approaches to reference interval studies. Clin Chem. 67:1175–81. DOI: 10.1093/clinchem/hvab137. PMID: 34402506.
Article11. Lahti A, Hyltoft Petersen P, Boyd JC. 2002; Impact of subgroup prevalences on partitioning of Gaussian-distributed reference values. Clin Chem. 48:1987–99. DOI: 10.1093/clinchem/48.11.1987. PMID: 12406985.
Article12. Arzideh F, Wosniok W, Gurr E, Hinsch W, Schumann G, Weinstock N, et al. 2007; A plea for intra-laboratory reference limits. Part 2. A bimodal retrospective concept for determining reference limits from intra-laboratory databases demonstrated by catalytic activity concentrations of enzymes. Clin Chem Lab Med. 45:1043–57. DOI: 10.1515/CCLM.2007.250. PMID: 17867994.
Article13. Jekarl DW, Kim JY, Lee S, Kim M, Kim Y, Han K, et al. 2015; Diagnosis and evaluation of severity of sepsis via the use of biomarkers and profiles of 13 cytokines: a multiplex analysis. Clin Chem Lab Med. 53:575–81. DOI: 10.1515/cclm-2014-0607. PMID: 25274957.
Article14. Jekarl DW, Kim JY, Ha JH, Lee S, Yoo J, Kim M, et al. 2019; Diagnosis and prognosis of sepsis based on use of cytokines, chemokines, and growth factors. Dis Markers. 2019:1089107. DOI: 10.1155/2019/1089107. PMID: 31583025. PMCID: PMC6754872.
Article15. Jekarl DW, Lee S, Kim M, Kim Y, Woo SH, Lee WJ. 2019; Procalcitonin as a prognostic marker for sepsis based on SEPSIS-3. J Clin Lab Anal. 33:e22996. DOI: 10.1002/jcla.22996. PMID: 31420921. PMCID: PMC6868407.
Article16. Kim KS, Jekarl DW, Yoo J, Lee S, Kim M, Kim Y. 2021; Immune gene expression networks in sepsis: a network biology approach. PLoS Oone. 16:e0247669. DOI: 10.1371/journal.pone.0247669. PMID: 33667236. PMCID: PMC7935325.
Article17. Farrell CL, Nguyen L. 2019; Indirect reference intervals: harnessing the power of stored laboratory data. Clin Biochem Rev. 40:99–111. DOI: 10.33176/AACB-19-00022. PMID: 31205377. PMCID: PMC6544248.
Article18. Zeileis A, Leisch F, Hornik K, Kleiber C. 2002; strucchange: an R package for testing for structural change in linear regression models. J Stat Softw. 7:1–38. DOI: 10.18637/jss.v007.i02.19. Moss J, Tveten M. 2019; kdensity: an R package for kernel density estimation with parametric starts and asymmetric kernels. J Open Source Softw. 4:1566–9. DOI: 10.21105/joss.01566.
Article20. Ripley B, Venables B, Bates D, Hornik K, Gebhardt A, Firth D. 2002. Modern applied statistics with S. 4th ed. Springer;Switzerland: DOI: 10.1007/978-0-387-21706-2.21. Bauer DJ, Curran PJ. 2004; The integration of continuous and discrete latent variable models: potential problems and promising opportunities. Psychol Methods. 9:3–29. DOI: 10.1037/1082-989X.9.1.3. PMID: 15053717.
Article22. Ekblom-Bak E, Stenling A, Eriksson SJ, Hemmingsson E, Kallings LV, Andersson G, et al. 2020; Latent profile analysis pattern of exercise, sitting and fitness in adults-association with metabolic risk factors, perceived health, and perceived symptoms. PLoS One. 15:e0232210. DOI: 10.1371/journal.pone.0232210. PMID: 32330191. PMCID: PMC7182226.23. Rosenberg JM, Beymer PN, Anderson DJ, van Lissa CJ, Schmidt JA. 2018; tidyLPA: an R package to easily carry out latent profile analysis (LPA) using open-source or commercial software. J Open Source Softw. 3:978–81. DOI: 10.21105/joss.00978.
Article24. Morgan GB, Hodge KJ, Baggett AR. 2016; Latent profile analysis with nonnormal mixtures: a Monte Carlo examination of model selection using fit indices. Comput Stat Data Anal. 93:146–61. DOI: 10.1016/j.csda.2015.02.019.
Article25. Tein JY, Coxe S, Cham H. 2013; Statistical power to detect the correct number of classes in latent profile analysis. Struct Equ Modeling. 20:640–57. DOI: 10.1080/10705511.2013.824781. PMID: 24489457. PMCID: PMC3904803.
Article26. Robertson J, Kaptein M. 2016. Modern statistical methods for HCL. Springer;Switzerland: DOI: 10.1007/978-3-319-26633-6.27. Spurk D, Hirschi A, Wang M, Valero D, Kauffeld S. 2020; Latent profile analysis: a review and "how to" guide of its application within vocational behavior research. J Vocat Behav. 120:103455. DOI: 10.1016/j.jvb.2020.103445.
Article28. Hyohdoh Y, Hatakeyama Y, Okuhara Y. 2021; A simple method to identify real-world clinical decision intervals of laboratory tests from clinical data. Inform Med Unlocked. 23:100512. DOI: 10.1016/j.imu.2021.100512.
Article29. Kang T, Yoo J, Choi H, Lee S, Jekarl DW, Kim Y. Performance evaluation of presepsin using a Sysmex HISCL-5000 analyzer and determination of reference interval. J Clin Lab Anal. 2022; e24618. DOI: 10.1002/jcla.24618. PMID: 35870180.30. Jekarl DW, Lee SY, Lee J, Park YJ, Kim Y, Park JH, et al. 2013; Procalcitonin as a diagnostic marker and IL-6 as a prognostic marker for sepsis. Diagn Microbiol Infect Dis. 75:342–7. DOI: 10.1016/j.diagmicrobio.2012.12.011. PMID: 23391607.
Article31. Sung JY, Seo JD, Ko DH, Park M, Hwang SM, Oh S, et al. 2021; Establishment of pediatric reference intervals for routine laboratory tests in Korean population: a retrospective multicenter analysis. Ann Lab Med. 41:155–70. DOI: 10.3343/alm.2021.41.2.155. PMID: 33063677. PMCID: PMC7591287.
Article32. Jones GRD, Haeckel R, Loh TP, Sikaris K, Streichert T, Katayev A, et al. 2018; Indirect methods for reference interval determination- review and recommendations. Clin Chem Lab Med. 57:20–9. DOI: 10.1515/cclm-2018-0073. PMID: 29672266.33. Kim CH, Kim EY. 2021; Prediction of postoperative sepsis based on changes in presepsin levels of critically ill patients with acute kidney injury after abdominal surgery. Diagnostics. 11:2321. DOI: 10.3390/diagnostics11122321. PMID: 34943556. PMCID: PMC8700401.
Article
- Full Text Links
- Actions
-
Cited
- CITED
-
- Close
- Share
- Similar articles
-
- Establishment of Reference Intervals of Tumor Markers in Korean Adults
- Establishment of Pediatric Reference Intervals for Routine Laboratory Tests in Korean Population: A Retrospective Multicenter Analysis
- Likelihood interval for nonlinear regression
- An Improved Auto-Generation System to Obtain Reference Intervals for Laboratory Medicine
- Confidence intervals for the COVID-19 neutralizing antibody retention rate in the Korean population


