Korean J Orthod.
2023 Nov;53(6):358-364. 10.4041/kjod22.187.
Three-dimensional evaluation of the pharyngeal airway space in patients with anterior open bite
- Affiliations
-
- 1Department of Orthodontics, Dental Research Institute, and Dental and Life Science Institute, School of Dentistry, Pusan National University, Yangsan, Korea
- KMID: 2548480
- DOI: http://doi.org/10.4041/kjod22.187
Abstract
Objective
This study aimed to three-dimensionally evaluate the pharyngeal airway space (PAS) of patients with anterior open bite (AOB) by using conebeam computed tomography (CBCT) and compare the findings with those obtained in individuals with normal occlusion.
Methods
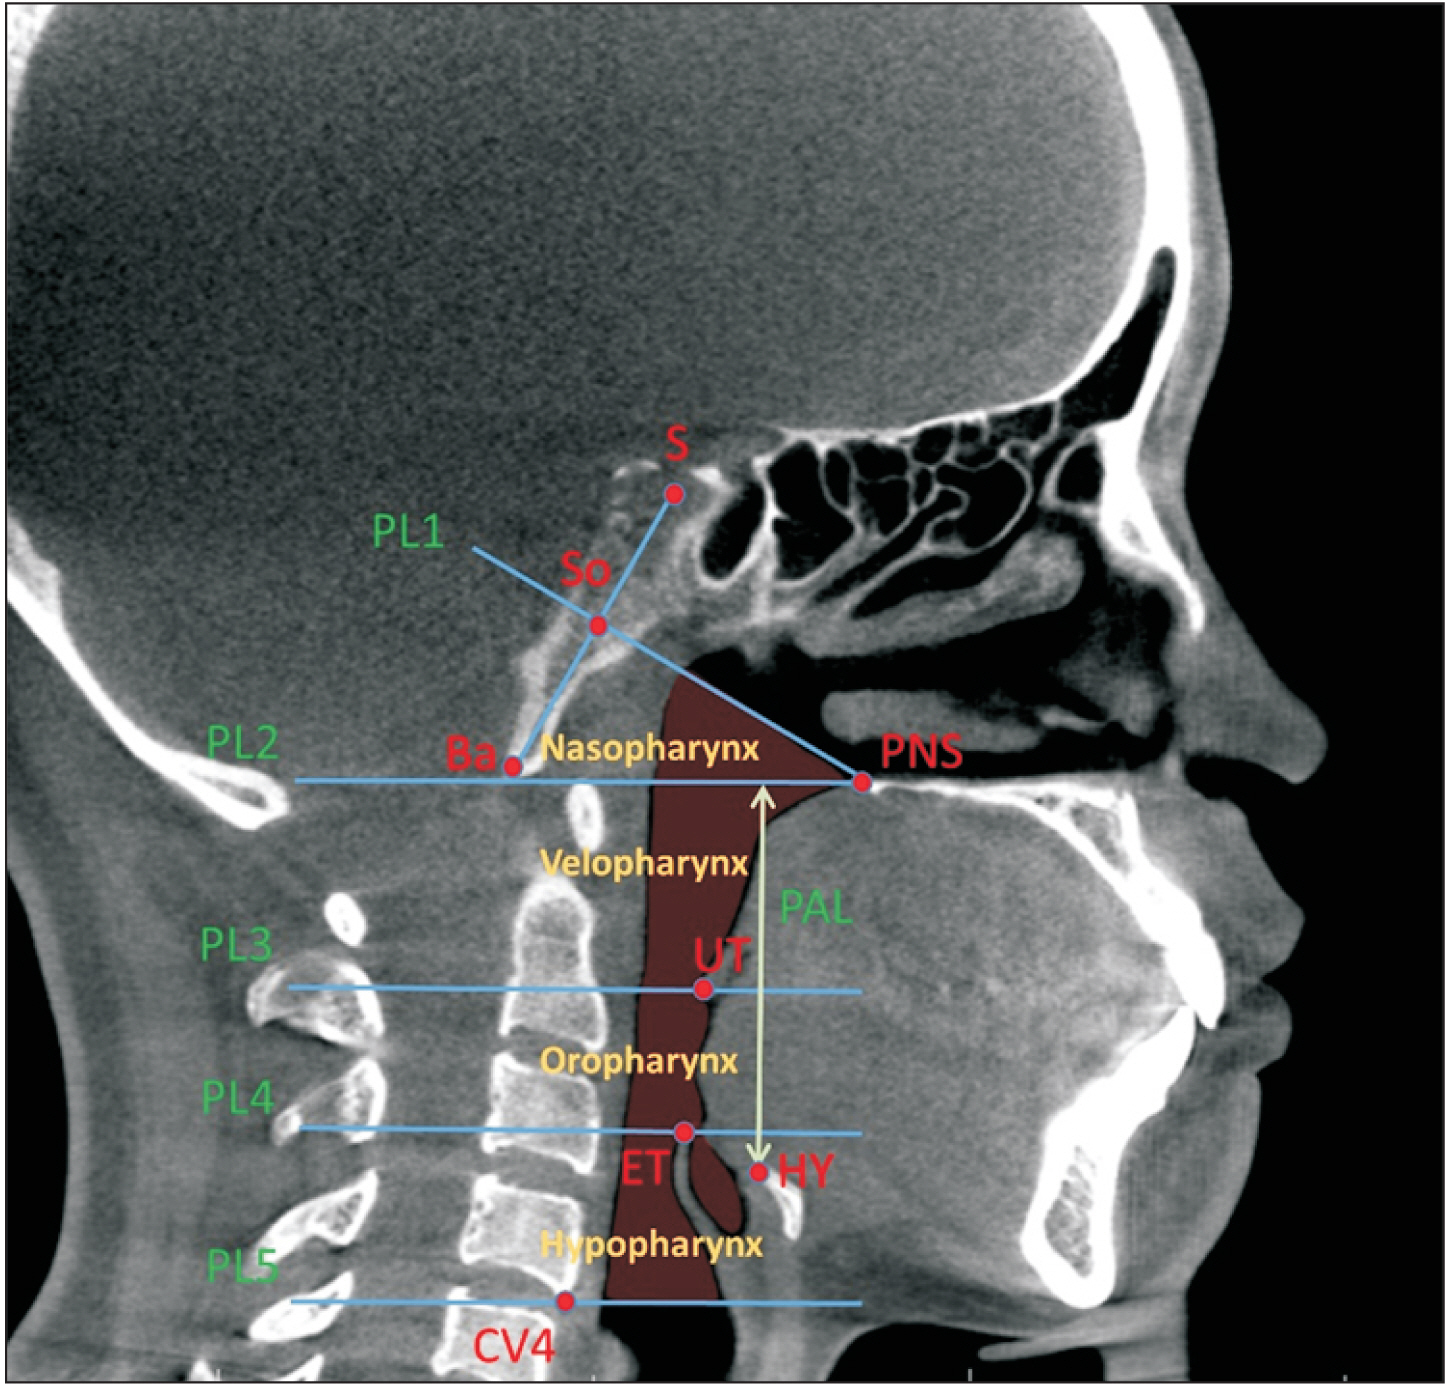
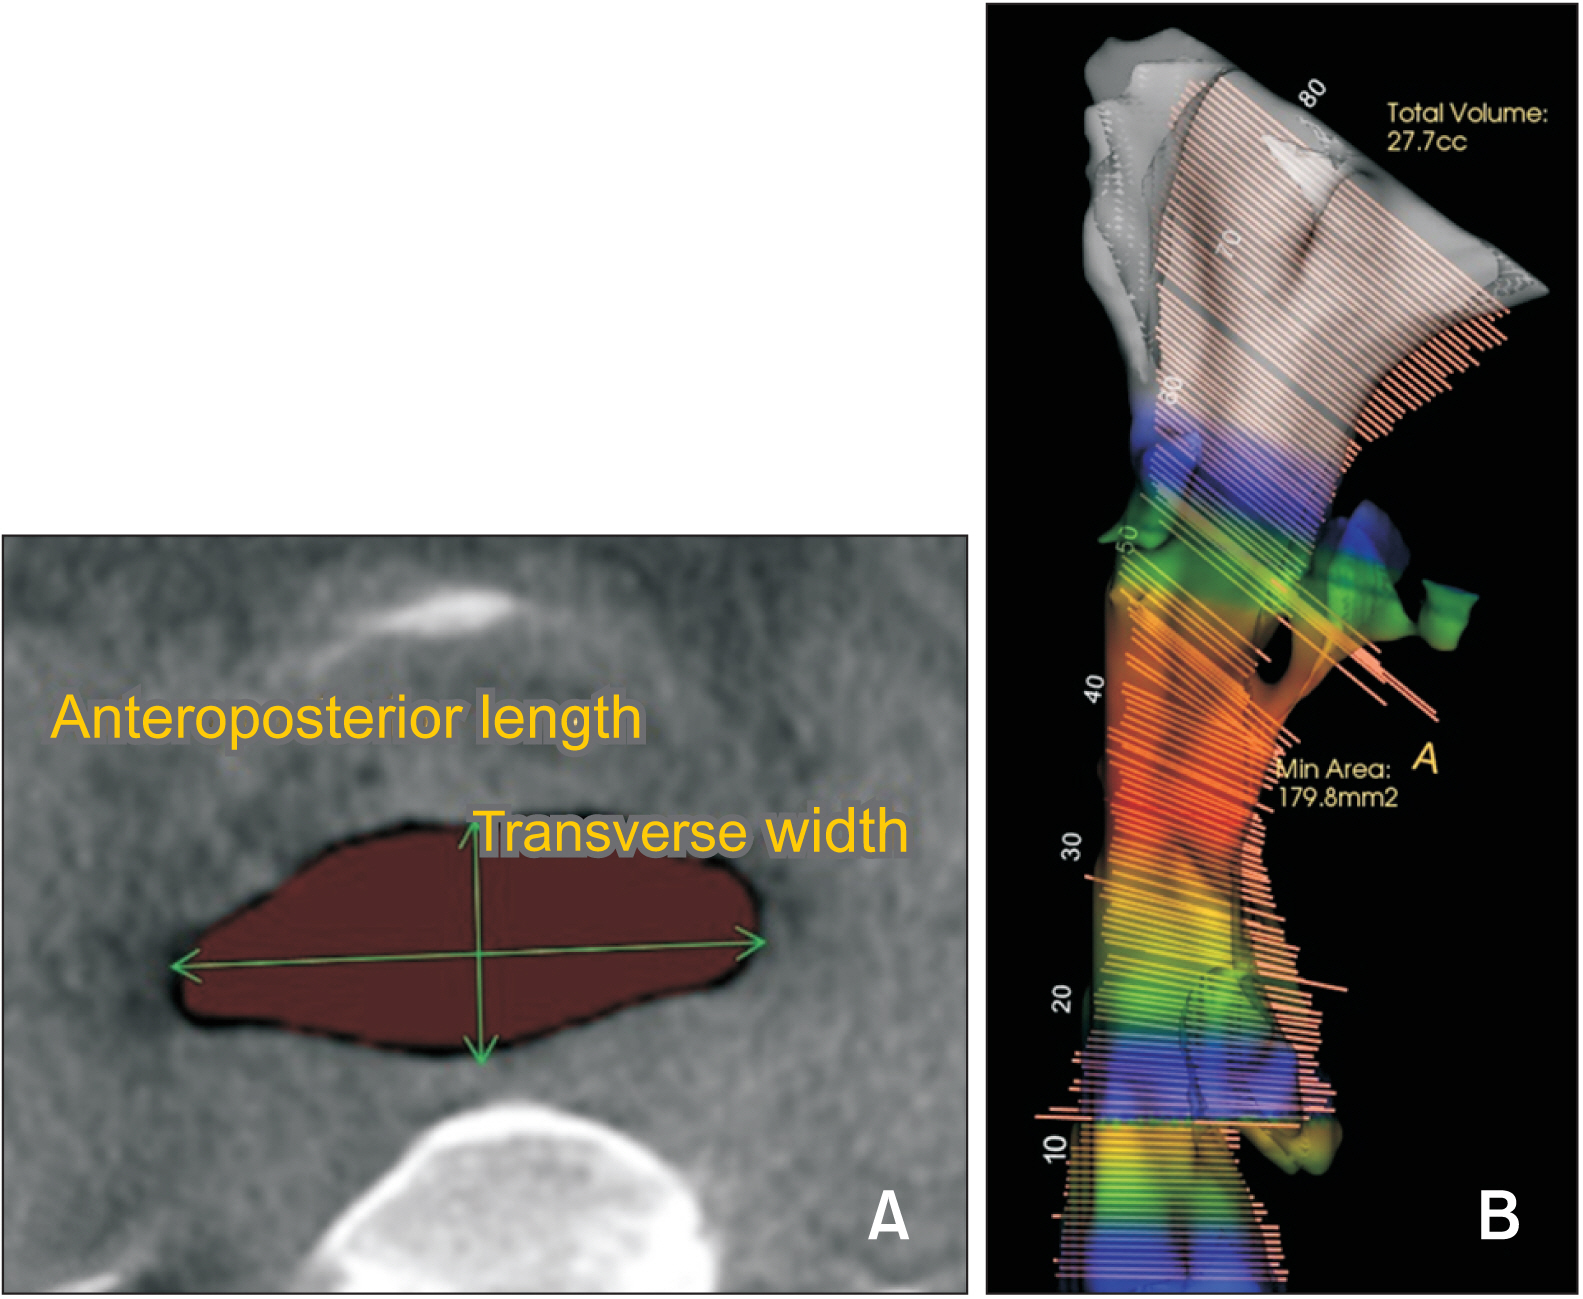
The open bite group (OBG, n = 25) consisted of patients with an anterior overbite of –3 mm or less, while the control group (n = 25) consisted of age- and sex-matched individuals with an anterior overbite of 1–3 mm, Angle Class I malocclusion (1° ≤ point A-nasion-point B angle ≤ 4°), and a normodivergent profile (22° ≤ Frankfort mandibular plane angle ≤ 28°). After the CBCT data were reconstructed into a three-dimensional image, the PAS was segmented into four parts, and the volume of each part was measured. Pharyngeal airway length (PAL) and the area and transverse width of the part showing minimal constriction were also measured. Pearson’s correlation analysis was used to evaluate the correlation between changes in the PAS and the amount of anterior overbite.
Results
The OBG showed a significantly narrower airway space in the nasopharyngeal, hypopharyngeal, and total airway volumes. The OBG also showed a significantly smaller area and transverse width of the part with minimal constriction. The OBG showed a significantly longer PAL, but there was no correlation between the amount of anterior overbite and the changes in PAS.
Conclusions
The PAS was associated with AOB. Patients with AOB had a narrower PAS and a smaller part showing minimal constriction.
Keyword
Figure
Reference
-
1. McNamara JA. 1981; Influence of respiratory pattern on craniofacial growth. Angle Orthod. 51:269–300. https://pubmed.ncbi.nlm.nih.gov/6947703/. DOI: 10.1043/0003-3219(1981)051<0269:IORPOC>2.0.CO;2. PMID: 6947703.
Article2. Rubin RM. 1980; Mode of respiration and facial growth. Am J Orthod. 78:504–10. https://doi.org/10.1016/0002-9416(80)90301-2. DOI: 10.1016/0002-9416(80)90301-2. PMID: 6933857.
Article3. Subtelny JD, Sakuda M. 1964; Open-bite: diagnosis and treatment. Am J Orthod. 50:337–58. https://doi.org/10.1016/0002-9416(64)90175-7. DOI: 10.1016/0002-9416(64)90175-7.
Article4. Gershater MM. 1972; The proper perspective of open bite. Angle Orthod. 42:263–72. https://pubmed.ncbi.nlm.nih.gov/4504544/. DOI: 10.1043/0003-3219(1972)042<0263:TPPOOB>2.0.CO;2. PMID: 4504544.5. Góis EG, Vale MP, Paiva SM, Abreu MH, Serra-Negra JM, Pordeus IA. 2012; Incidence of malocclusion between primary and mixed dentitions among Brazilian children. A 5-year longitudinal study. Angle Orthod. 82:495–500. https://doi.org/10.2319/033011-230.1. DOI: 10.2319/033011-230.1. PMID: 21981755. PMCID: PMC8865814.6. Greenlee GM, Huang GJ, Chen SS, Chen J, Koepsell T, Hujoel P. 2011; Stability of treatment for anterior open-bite malocclusion: a meta-analysis. Am J Orthod Dentofacial Orthop. 139:154–69. https://doi.org/10.1016/j.ajodo.2010.10.019. DOI: 10.1016/j.ajodo.2010.10.019. PMID: 21300243.
Article7. Leavy KM, Cisneros GJ, LeBlanc EM. 2016; Malocclusion and its relationship to speech sound production: redefining the effect of malocclusal traits on sound production. Am J Orthod Dentofacial Orthop. 150:116–23. https://doi.org/10.1016/j.ajodo.2015.12.015. DOI: 10.1016/j.ajodo.2015.12.015. PMID: 27364213.
Article8. Laganà G, Di Fazio V, Paoloni V, Franchi L, Cozza P, Lione R. 2019; Geometric morphometric analysis of the palatal morphology in growing subjects with skeletal open bite. Eur J Orthod. 41:258–63. https://doi.org/10.1093/ejo/cjy055. DOI: 10.1093/ejo/cjy055. PMID: 30102344.
Article9. Cozza P, Baccetti T, Franchi L, Mucedero M, Polimeni A. 2005; Sucking habits and facial hyperdivergency as risk factors for anterior open bite in the mixed dentition. Am J Orthod Dentofacial Orthop. 128:517–9. https://doi.org/10.1016/j.ajodo.2005.04.032. DOI: 10.1016/j.ajodo.2005.04.032. PMID: 16214636.
Article10. Laranjo F, Pinho T. 2014; Cephalometric study of the upper airways and dentoalveolar height in open bite patients. Int Orthod. 12:467–82. https://doi.org/10.1016/j.ortho.2014.10.005. DOI: 10.1016/j.ortho.2014.10.005. PMID: 25457718.
Article11. Lagravère MO, Carey J, Toogood RW, Major PW. 2008; Three-dimensional accuracy of measurements made with software on cone-beam computed tomography images. Am J Orthod Dentofacial Orthop. 134:112–6. https://doi.org/10.1016/j.ajodo.2006.08.024. DOI: 10.1016/j.ajodo.2006.08.024. PMID: 18617110.
Article12. Muto T, Takeda S, Kanazawa M, Yamazaki A, Fujiwara Y, Mizoguchi I. 2002; The effect of head posture on the pharyngeal airway space (PAS). Int J Oral Maxillofac Surg. 31:579–83. https://doi.org/10.1054/ijom.2002.0279. DOI: 10.1054/ijom.2002.0279. PMID: 12521311.
Article13. Schendel SA, Jacobson R, Khalessi S. 2012; Airway growth and development: a computerized 3-dimensional analysis. J Oral Maxillofac Surg. 70:2174–83. https://doi.org/10.1016/j.joms.2011.10.013. DOI: 10.1016/j.joms.2011.10.013. PMID: 22326177.
Article14. Pandis N. 2012; Sample calculations for comparison of 2 means. Am J Orthod Dentofacial Orthop. 141:519–21. https://doi.org/10.1016/j.ajodo.2011.12.010. DOI: 10.1016/j.ajodo.2011.12.010. PMID: 22464536.
Article15. Claudino LV, Mattos CT, Ruellas AC, Sant' Anna EF. 2013; Pharyngeal airway characterization in adolescents related to facial skeletal pattern: a preliminary study. Am J Orthod Dentofacial Orthop. 143:799–809. https://doi.org/10.1016/j.ajodo.2013.01.015. DOI: 10.1016/j.ajodo.2013.01.015. PMID: 23726330.
Article16. Weissheimer A, Menezes LM, Sameshima GT, Enciso R, Pham J, Grauer D. 2012; Imaging software accuracy for 3-dimensional analysis of the upper airway. Am J Orthod Dentofacial Orthop. 142:801–13. https://doi.org/10.1016/j.ajodo.2012.07.015. DOI: 10.1016/j.ajodo.2012.07.015. PMID: 23195366.
Article17. Shintani T, Asakura K, Kataura A. 1997; Evaluation of the role of adenotonsillar hypertrophy and facial morphology in children with obstructive sleep apnea. ORL J Otorhinolaryngol Relat Spec. 59:286–91. https://doi.org/10.1159/000276955. DOI: 10.1159/000276955. PMID: 9279869.
Article18. Venetikidou A. 1993; Incidence of malocclusion in asthmatic children. J Clin Pediatr Dent. 17:89–94. https://pubmed.ncbi.nlm.nih.gov/8466846/. PMID: 8466846.19. Mayer P, Pépin JL, Bettega G, Veale D, Ferretti G, Deschaux C, et al. 1996; Relationship between body mass index, age and upper airway measurements in snorers and sleep apnoea patients. Eur Respir J. 9:1801–9. https://doi.org/10.1183/09031936.96.09091801. DOI: 10.1183/09031936.96.09091801. PMID: 8880094.
Article20. Brasil DM, Kurita LM, Groppo FC, Haiter-Neto F. 2016; Relationship of craniofacial morphology in 3-dimensional analysis of the pharynx. Am J Orthod Dentofacial Orthop. 149:683–91.e1. https://doi.org/10.1016/j.ajodo.2015.11.021. DOI: 10.1016/j.ajodo.2015.11.021. PMID: 27131250.
Article21. Alves PV, Zhao L, O'Gara M, Patel PK, Bolognese AM. 2008; Three-dimensional cephalometric study of upper airway space in skeletal class II and III healthy patients. J Craniofac Surg. 19:1497–507. https://doi.org/10.1097/SCS.0b013e31818972ef. DOI: 10.1097/SCS.0b013e31818972ef. PMID: 19098539.
Article22. Ucar FI, Uysal T. 2011; Orofacial airway dimensions in subjects with Class I malocclusion and different growth patterns. Angle Orthod. 81:460–8. https://doi.org/10.2319/091910-545.1. DOI: 10.2319/091910-545.1. PMID: 21299381. PMCID: PMC8923554.
Article23. Torres HM, Evangelista K, Torres ÉM, Estrela C, Figueiredo PTS, Valladares-Neto J, et al. 2019; Comparison of dimensions of the nasopharynx and oropharynx using different anatomical references: is there equivalence? J Oral Maxillofac Surg. 77:2545–54. https://doi.org/10.1016/j.joms.2019.07.008. DOI: 10.1016/j.joms.2019.07.008. PMID: 31449764.
Article24. Aboudara C, Nielsen I, Huang JC, Maki K, Miller AJ, Hatcher D. 2009; Comparison of airway space with conventional lateral headfilms and 3-dimensional reconstruction from cone-beam computed tomography. Am J Orthod Dentofacial Orthop. 135:468–79. https://doi.org/10.1016/j.ajodo.2007.04.043. DOI: 10.1016/j.ajodo.2007.04.043. PMID: 19361733.
Article25. ElShebiny T, Morcos S, El H, Palomo JM. 2022; Comparing different software packages for measuring the oropharynx and minimum cross-sectional area. Am J Orthod Dentofacial Orthop. 161:228–37.e32. https://doi.org/10.1016/j.ajodo.2021.04.024. DOI: 10.1016/j.ajodo.2021.04.024. PMID: 34563428.
Article26. Zimmerman JN, Lee J, Pliska BT. 2017; Reliability of upper pharyngeal airway assessment using dental CBCT: a systematic review. Eur J Orthod. 39:489–96. https://doi.org/10.1093/ejo/cjw079. DOI: 10.1093/ejo/cjw079. PMID: 27999121.
Article
- Full Text Links
- Actions
-
Cited
- CITED
-
- Close
- Share
- Similar articles
-
- The structural change in the hyoid bone and upper airway after orthognathic surgery for skeletal class III anterior open bite patients using 3-dimensional computed tomography
- A study of upper airway dimensional change according to maxillary superior movement after orthognathic surgery
- Clinical investigation on anterior open-bite
- Change of the upper airway after mandibular setback surgery in patients with mandibular prognathism and anterior open bite
- Root surface areas of maxillary permanent teeth in anterior normal overbite and anterior open bite assessed using cone-beam computed tomography


