Korean J Orthod.
2020 Mar;50(2):108-119. 10.4041/kjod.2020.50.2.108.
Sex-, growth pattern-, and growth status-related variability in maxillary and mandibular buccal cortical thickness and density
- Affiliations
-
- 1Department of Orthodontics, University of Texas Health Science Center at Houston, Houston, TX, USA.
- 2Division of Orthodontics, University of Connecticut Health, Farmington, CT, USA. syadav@uchc.edu
- 3Department of Orthodontics, Brodie Laboratory for Craniofacial Genetics, University of Illinois at Chicago, Chicago, IL, USA.
- 4Division of Oral and Maxillofacial Radiology, University of Connecticut Health, Farmington, CT, USA.
- KMID: 2471871
- DOI: http://doi.org/10.4041/kjod.2020.50.2.108
Abstract
OBJECTIVE
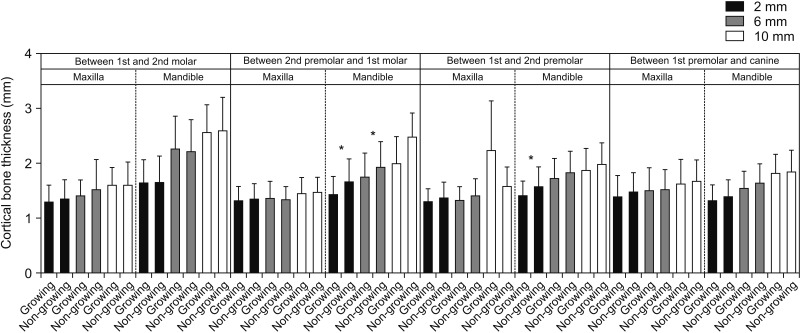
The primary objective of this study was to quantitatively analyze the bone parameters (thickness and density) at four different interdental areas from the distal region of the canine to the mesial region of the second molar in the maxilla and the mandible. The secondary aim was to compare and contrast the bone parameters at these specific locations in terms of sex, growth status, and facial type.
METHODS
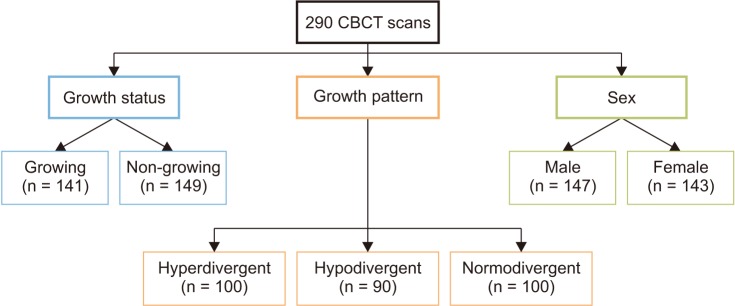
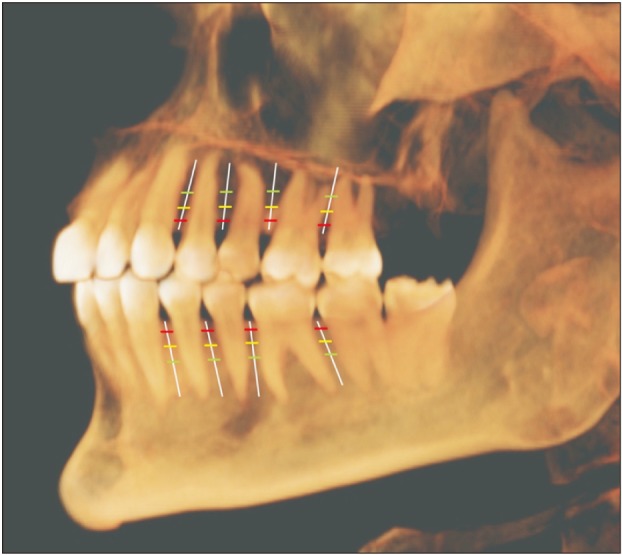
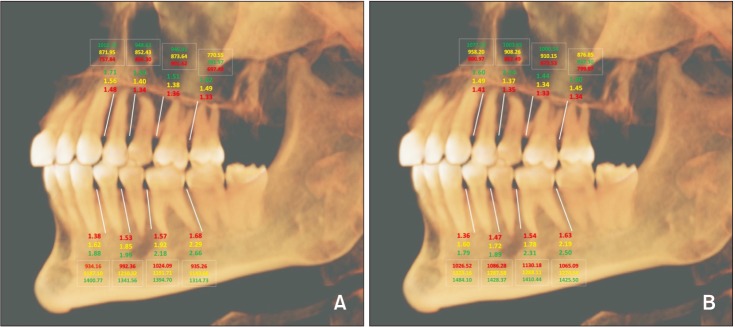
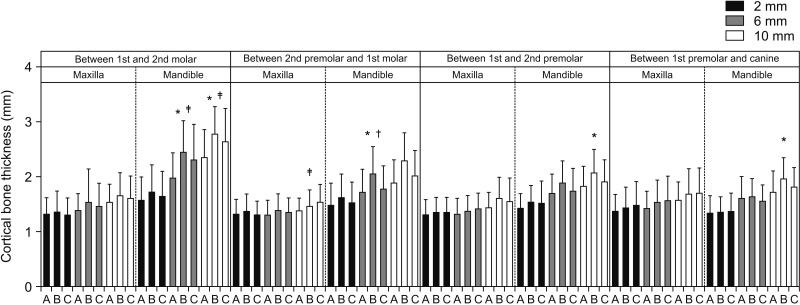
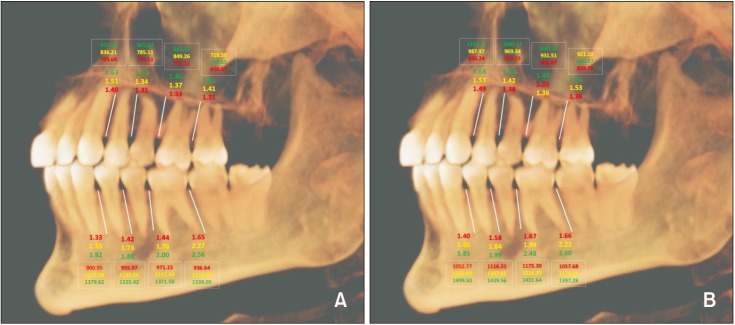
This retrospective cone-beam computed tomography (CBCT) study reviewed 290 CBCT images of patients seeking orthodontic treatment. Cortical bone thickness in millimeters (mm) and density in pixel intensity value were measured for the regions (1) between the canine and first premolar, (2) between the first and second premolars, (3) between the second premolar and first molar, and (4) between the first and second molars. At each location, the bone thickness and density were measured at distances of 2, 6, and 10 mm from the alveolar crest.
RESULTS
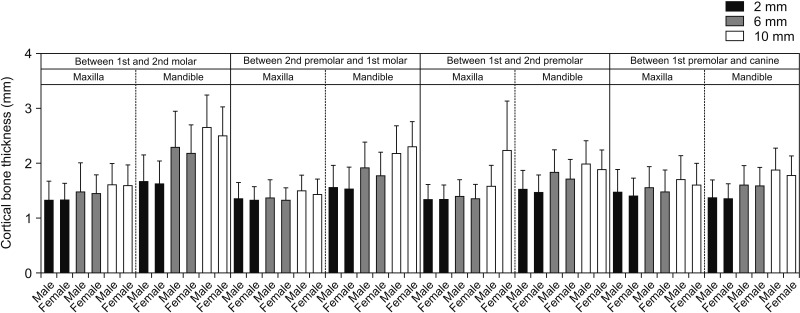
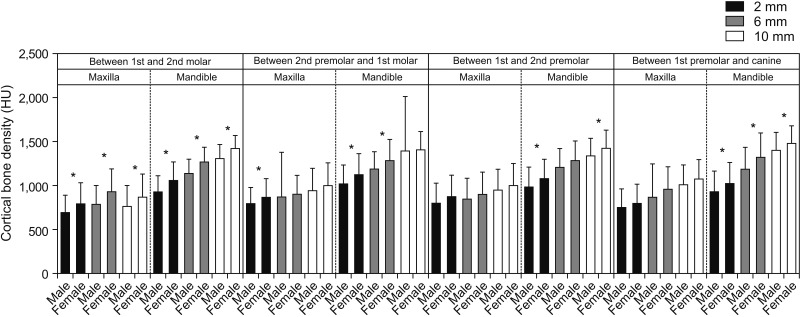
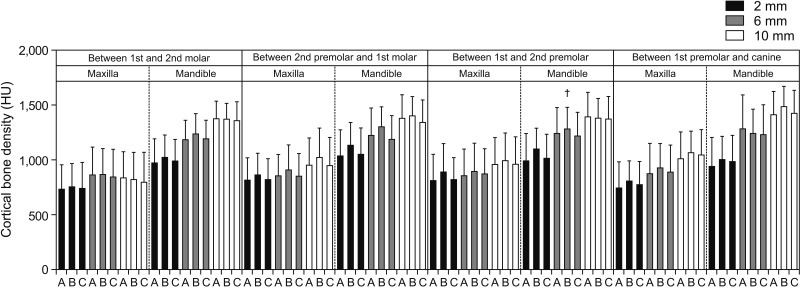
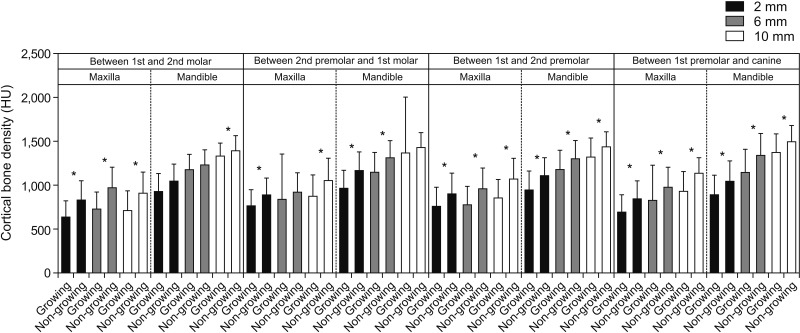
The sex comparison (male vs. female) in cortical bone thickness showed no significant difference (p > 0.001). The bone density in growing subjects was significantly (p < 0.001) lower than that in non-growing subjects for most locations. There was no significant difference (p > 0.001) in bone parameters in relation to facial pattern in the maxilla and mandible for most sites.
CONCLUSIONS
There was no significant sex-related difference in cortical bone thickness. The buccal cortical bone density was higher in females than in males. Bone parameters were similar for subjects with hyperdivergent, hypodivergent, and normodivergent facial patterns.
MeSH Terms
Figure
Reference
-
1. Fortini A, Cacciafesta V, Sfondrini MF, Cambi S, Lupoli M. Clinical applications and efficacy of miniscrews for extra-dental anchorage. Orthod. 2004; 1:87–98.2. Papadopoulos MA, Tarawneh F. The use of miniscrew implants for temporary skeletal anchorage in orthodontics: a comprehensive review. Oral Surg Oral Med Oral Pathol Oral Radiol Endod. 2007; 103:e6–e15.
Article3. Alharbi F, Almuzian M, Bearn D. Miniscrews failure rate in orthodontics: systematic review and meta-analysis. Eur J Orthod. 2018; 40:519–530. PMID: 29315365.
Article4. Papageorgiou SN, Zogakis IP, Papadopoulos MA. Failure rates and associated risk factors of orthodontic miniscrew implants: a meta-analysis. Am J Orthod Dentofacial Orthop. 2012; 142:577–595.e7. PMID: 23116500.
Article5. Kravitz ND, Kusnoto B. Risks and complications of orthodontic miniscrews. Am J Orthod Dentofacial Orthop. 2007; 131(4 Suppl):S43–S51. PMID: 17448385.
Article6. Melsen B, Verna C. Miniscrew implants: the Aarhus anchorage system. Semin Orthod. 2005; 11:24–31.
Article7. Horn AJ. Facial height index. Am J Orthod Dentofacial Orthop. 1992; 102:180–186. PMID: 1636636.
Article8. Steiner CC. Cephalometrics in clinical practice. Angle Orthod. 1959; 29:8–29.9. McNamara JA Jr. A method of cephalometric evaluation. Am J Orthod. 1984; 86:449–469. PMID: 6594933.
Article10. Tseng YC, Wu JH, Chen HS, Chen CM, Ting CC. Effects of gripping volume in the mechanical strengths of orthodontic mini-implant. Kaohsiung J Med Sci. 2017; 33:578–583. PMID: 29050676.
Article11. Motoyoshi M, Hirabayashi M, Uemura M, Shimizu N. Recommended placement torque when tightening an orthodontic mini-implant. Clin Oral Implants Res. 2006; 17:109–114. PMID: 16441792.
Article12. Baumgaertel S, Hans MG. Buccal cortical bone thickness for mini-implant placement. Am J Orthod Dentofacial Orthop. 2009; 136:230–235. PMID: 19651353.
Article13. Marquezan M, Mattos CT, Sant'Anna EF, de Souza MM, Maia LC. Does cortical thickness influence the primary stability of miniscrews?: a systematic review and meta-analysis. Angle Orthod. 2014; 84:1093–1103. PMID: 24694015.
Article14. Motoyoshi M, Yoshida T, Ono A, Shimizu N. Effect of cortical bone thickness and implant placement torque on stability of orthodontic mini-implants. Int J Oral Maxillofac Implants. 2007; 22:779–784. PMID: 17974113.15. Cha JY, Kil JK, Yoon TM, Hwang CJ. Miniscrew stability evaluated with computerized tomography scanning. Am J Orthod Dentofacial Orthop. 2010; 137:73–79. PMID: 20122434.
Article16. Iijima M, Takano M, Yasuda Y, Muguruma T, Nakagaki S, Sakakura Y, et al. Effect of the quantity and quality of cortical bone on the failure force of a miniscrew implant. Eur J Orthod. 2013; 35:583–589. PMID: 23041933.
Article17. Holm L, Cunningham SJ, Petrie A, Cousley RR. An in vitro study of factors affecting the primary stability of orthodontic mini-implants. Angle Orthod. 2012; 82:1022–1028. PMID: 22578282.
Article18. Farnsworth D, Rossouw PE, Ceen RF, Buschang PH. Cortical bone thickness at common miniscrew implant placement sites. Am J Orthod Dentofacial Orthop. 2011; 139:495–503. PMID: 21457860.
Article19. Chun YS, Lim WH. Bone density at interradicular sites: implications for orthodontic mini-implant placement. Orthod Craniofac Res. 2009; 12:25–32. PMID: 19154272.
Article20. Ono A, Motoyoshi M, Shimizu N. Cortical bone thickness in the buccal posterior region for orthodontic mini-implants. Int J Oral Maxillofac Surg. 2008; 37:334–340. PMID: 18295454.
Article21. Cassetta M, Sofan AA, Altieri F, Barbato E. Evaluation of alveolar cortical bone thickness and density for orthodontic mini-implant placement. J Clin Exp Dent. 2013; 5:e245–e252. PMID: 24455090.
Article22. Fadhil RM, Al-Khatib AR. Assessment of cortical bone density for orthodontic implants placement: computerized tomography study. Al-Rafidain Dent J. 2015; 15:393–398.
Article23. Hiasa K, Abe Y, Okazaki Y, Nogami K, Mizumachi W, Akagawa Y. Preoperative computed tomography-derived bone densities in hounsfield units at implant sites acquired primary stability. ISRN Dent. 2011; 2011:678729. PMID: 22203910.
Article24. Sathapana S, Forrest A, Monsour P, Naser-ud-Din S. Age-related changes in maxillary and mandibular cortical bone thickness in relation to temporary anchorage device placement. Aust Dent J. 2013; 58:67–74. PMID: 23441794.
Article25. Sadek MM, Sabet NE, Hassan IT. Three-dimensional mapping of cortical bone thickness in subjects with different vertical facial dimensions. Prog Orthod. 2016; 17:32. PMID: 27667817.
Article
- Full Text Links
- Actions
-
Cited
- CITED
-
- Close
- Share
- Similar articles
-
- Quantitative evaluation of alveolar cortical bone density in adults with different vertical facial types using cone-beam computed tomography
- Evaluation of mandibular cortical bone thickness for placement of temporary anchorage devices (TADs)
- Anatomical position of the mandibular canal in relation to the buccal cortical bone: relevance to sagittal split osteotomy
- CBCT study of mandibular first molars with a distolingual root in Koreans
- Differences in mandibular anterior alveolar bone thickness according to age in a normal skeletal group

