Transl Clin Pharmacol.
2019 Dec;27(4):141-148. 10.12793/tcp.2019.27.4.141.
Performance of a mixture model by the degree of a missing categorical covariate when estimating clearance in NONMEM
- Affiliations
-
- 1Department of Clinical Pharmacology and Therapeutics, Asan Medical Center, University of Ulsan, Seoul 05505, Republic of Korea. mdhslim@gmail.com
- KMID: 2467968
- DOI: http://doi.org/10.12793/tcp.2019.27.4.141
Abstract
- The accuracy and predictability of mixture models in NONMEM® may change depending on the relative size of inter-individual differences and the size of the differences in the parameters between subpopulations. This study explored the accuracy of mixture models when dealing with missing a categorical covariate under various situations that may occur in reality. We generated simulation data under various scenarios where genotypes representing extensive metabolizers (EM) and poor metabolizers (PM) of drug-metabolizing enzymes affect the clearance of a drug by different degrees, and the inter-individual variations in clearance are different for each scenario. From each simulated datum, a specific proportion of the covariate (genotype information) was randomly removed. Based on these simulation data, the proportion of each individual subpopulation and the clearance were estimated using a mixture model. Overall, the clearance estimate was more accurate when the difference in clearance between subpopulations was large, and the inter-individual variations were small. In some scenarios that showed higher ETA or epsilon shrinkage, the clearance estimates were significantly biased. The mixture model made better predictions for individuals in the EM subpopulation than for individuals in the PM subpopulation. However, the estimated values were not significantly affected by the tested ratio, if the sample size was secured to some extent. The current simulation study suggests that when the coefficient of variation of inter-individual variations of clearance exceeds 40%, the mixture model should be used carefully, and it should be taken into account that shrinkage can bias the results.
Keyword
MeSH Terms
Figure
-
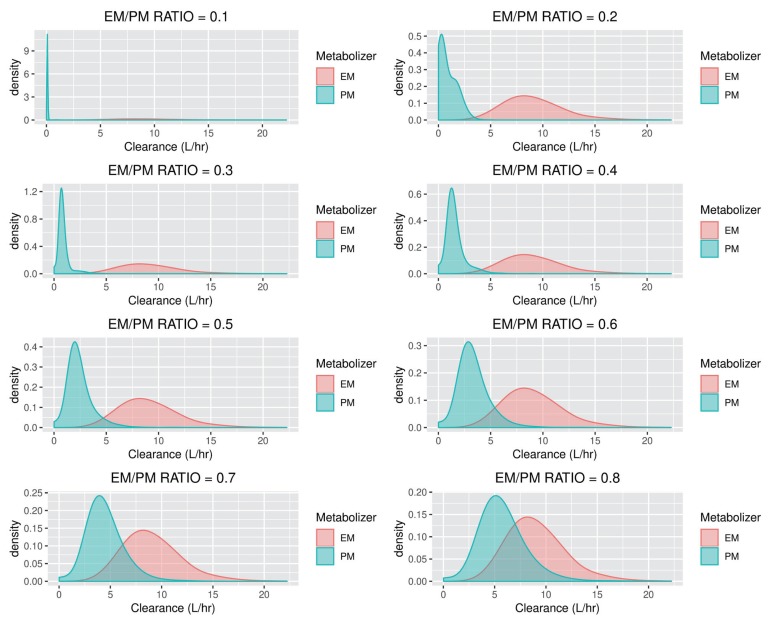
Figure 1 CL probability density plots for each EM/PM ratio of CL (30% CV).
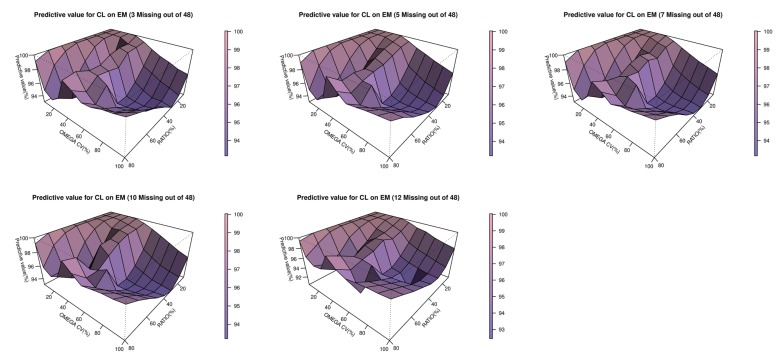
Figure 2 3-dimensional plot of the predictability of EM versus interindividual variabilities for CL and the clearance ratio (EM/PM) in the EM subpopulation.
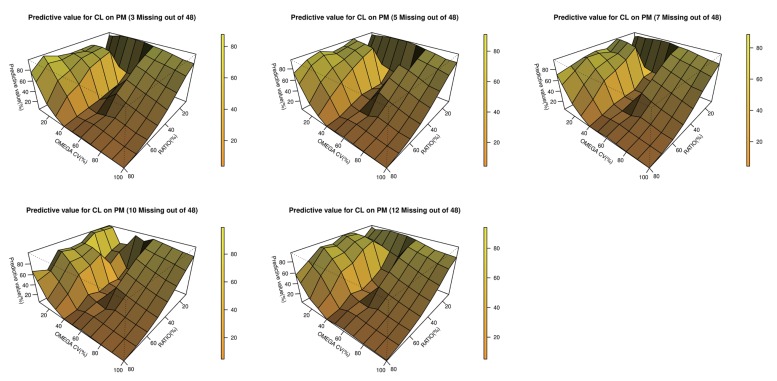
Figure 3 3-dimensional plot of the predictability versus interindividual variabilities for CL and the clearance ratio (EM/PM) in both the PM subpopulations.
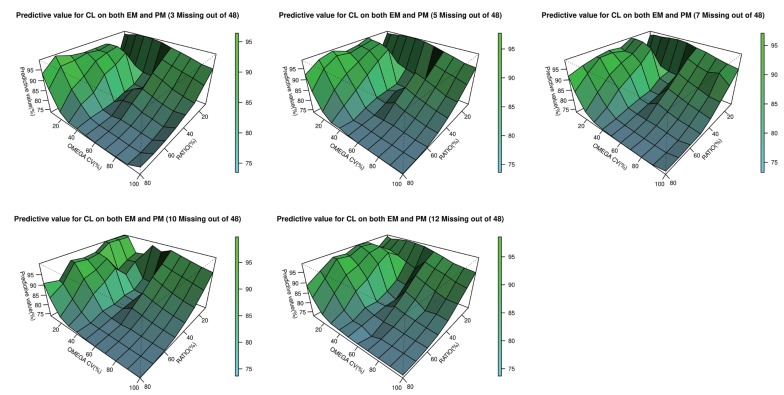
Figure 4 3-dimensional plot of the predictability versus interindividual variabilities for CL and the clearance ratio (EM/PM) in both the PM and EM subpopulation.
Reference
-
1. Blake CM, Kharasch ED, Schwab M, Nagele P. A Meta-Analysis of CYP2D6 Metabolizer Phenotype and Metoprolol Pharmacokinetics. Clin Pharmacol Ther. 2013; 94:394–399. DOI: 10.1038/clpt.2013.96. PMID: 23665868.
Article2. Noetzli M, Guidi M, Ebbing K, Eyer S, Wilhelm L, Michon A, et al. Population pharmacokinetic approach to evaluate the effect of CYP2D6, CYP3A, ABCB1, POR, and NR1I2 genotypes on donepezil clearance. Br J Clin Pharmacol. 2014; 78:135–144. DOI: 10.1111/bcp.12325. PMID: 24433464.3. Savic RM, Karlsson MO. Importance of Shrinkage in Empirical Bayes Estimates for Diagnostics: Problems and Solutions. AAPS J. 2009; 11:558–569. DOI: 10.1208/s12248-009-9133-0. PMID: 19649712.
Article
- Full Text Links
-
- Actions
-
Cited
- CITED
-
- Close
- Share
-
- Similar articles
-
- Assessment of statistical power for covariate effects in data from phase I clinical trials
- Relationship between body weight and postmenstrual age in a Korean pediatric population
- Standard Error of Empirical Bayes Estimate in NONMEM(R) VI
- Serum Cystatin C Is a Major Predictor of Vancomycin Clearance in a Population Pharmacokinetic Analysis of Patients with Normal Serum Creatinine Concentrations
- Pharmacometric models simulation using NONMEM, Berkeley Madonna and R
