Diagnosis of Sarcopenia in Head and Neck Computed Tomography: Cervical Muscle Mass as a Strong Indicator of Sarcopenia
- Affiliations
-
- 1Department of Radiology, Pamukkale University Faculty of Medicine, Denizli, Turkey. furkan.ufuk@hotmail.com
- 2Department of Nuclear Medicine, Pamukkale University Faculty of Medicine, Denizli, Turkey.
- KMID: 2455374
- DOI: http://doi.org/10.21053/ceo.2018.01613
Abstract
OBJECTIVES
Patients with head and neck cancer (HNC) have a high risk of sarcopenia, which is associated with poor prognosis. Skeletal-muscle area and index at the third lumbar (L3) vertebra level (L3MA and L3MI) are recommended for the detection of sarcopenia. However, L3 level is not included in many imaging protocols and there are no data for optimal levels and cutoffs for the diagnosis of sarcopenia in head and neck computed tomography (HNCT) scans. Our aim was to assess the relationship between cervical paravertebral muscle values and L3MI and to investigate optimal level to diagnose sarcopenia on HNCTs.
METHODS
Patients with HNC (n=159) who underwent positron emission tomography-CT for tumor staging were retrospectively analyzed. On CT images, paravertebral and sternocleidomastoid muscle areas at second (C2), third (C3), and fourth (C4) cervical vertebrae levels (C2MA, C3MA, C4MA, SCMA) and L3MA were measured. Cross-sectional areas were normalized for stature (muscle area/height square) and muscle index (C2MI, C3MI, C4MI, SCMI, L3MI) values were obtained. Spearman correlation and linear regression analyses were used for assessing correlations. To calculate the diagnostic performance of SCMI, C2MI, C3MI, and C4MI for the diagnosis of sarcopenia with respect to the cutoffs of L3MI, receiver operating characteristic (ROC) analysis was used.
RESULTS
Males had significantly higher muscle areas than females. Although C2MI, C3MI, C4MI, and SCMI values all showed very strong and significant correlation with L3MI (P<0.001). According to the ROC analysis, the best discriminative for sarcopenia was C3MI in males (area under curve [AUC], 0.967) and SCMI in females (AUC, 0.898).
CONCLUSION
C2MI, C3MI, C4MI, and SCMI values can be used as alternatives for the diagnosis of sarcopenia in routine HNCT examinations.
Keyword
MeSH Terms
Figure
-
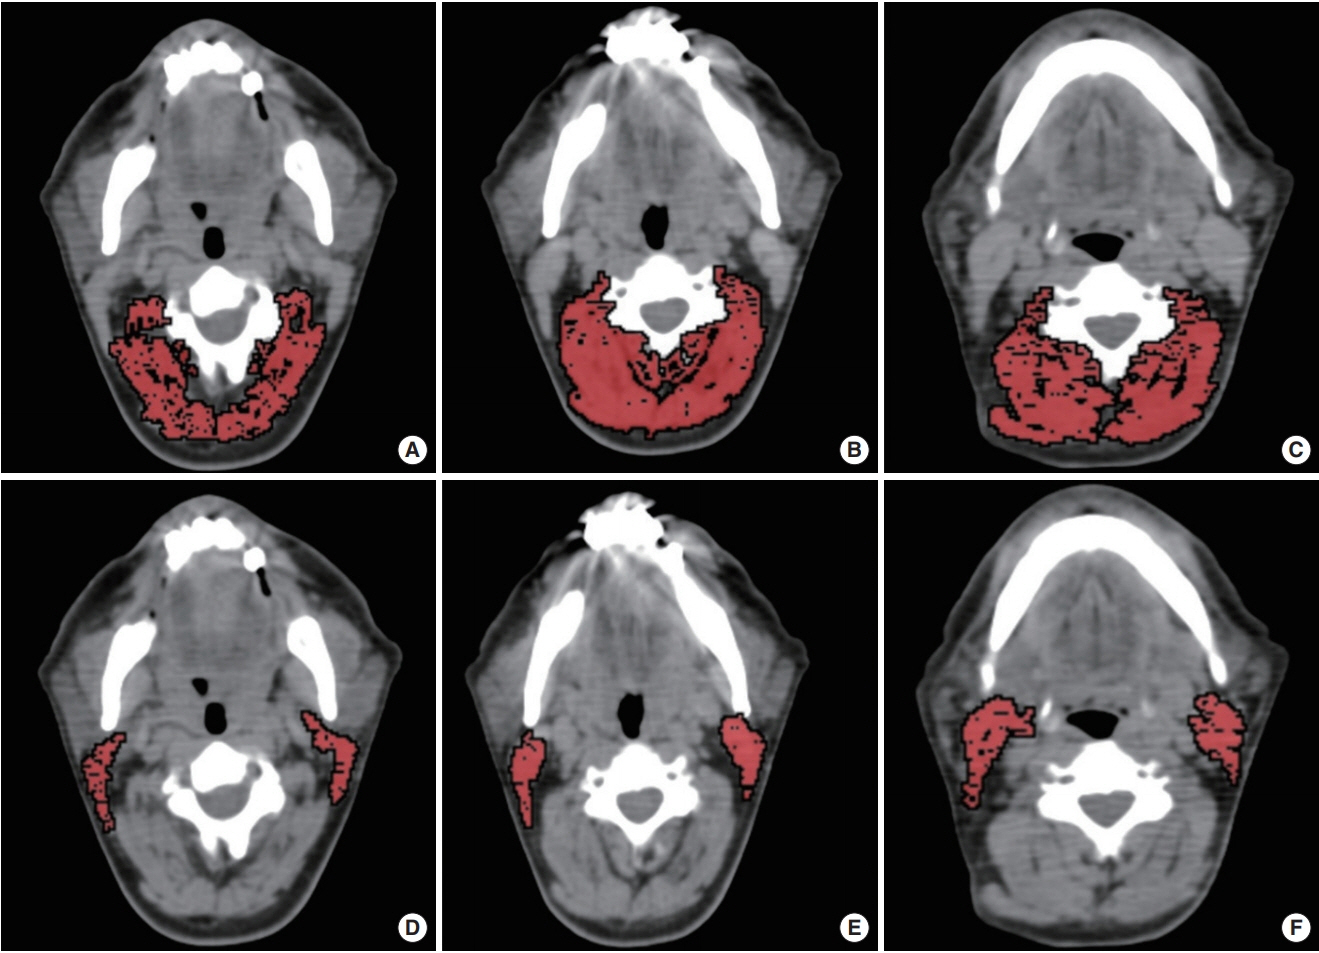
Fig. 1. Paravertebral and sternocleidomastoid muscle areas measurements. The paravertebral muscle area measurements at second (C2, A), third (C3, B), and fourth (C4, C) cervical vertebrae levels. The sternocleidomastoid muscle area measurements at C2 (D), C3 (E), and C4 (F) levels.
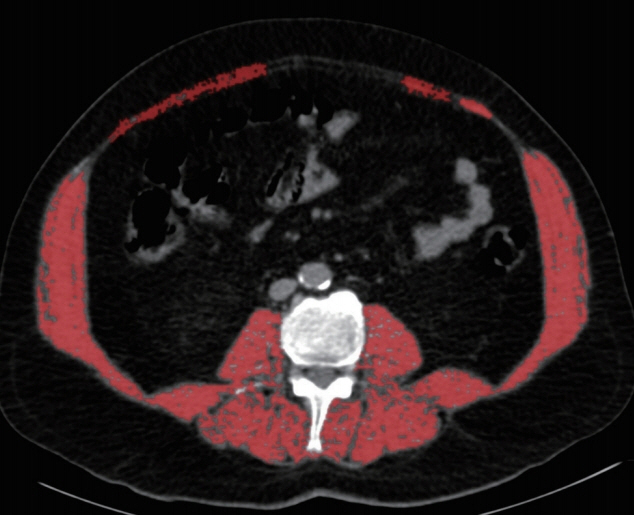
Fig. 2. Example of skeletal muscle area measurement at the lower part of the third lumbar vertebrae (L3) level.
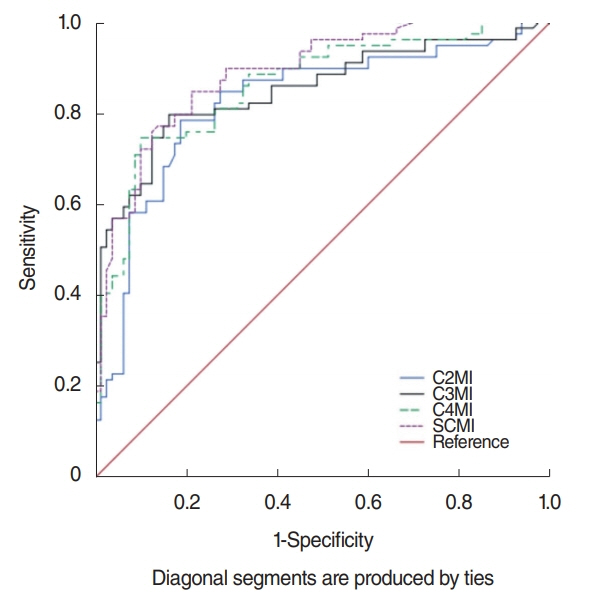
Fig. 3. Receiver operation characteristic curve for prediction of sarcopenia for the assessment of C2MI, C3MI, C4MI, and SCMI in the study total population (males and females). C2MI–C4MI, normalized paravertebral skeletal muscle areas at the level of C2–C4 vertebrae values for stature; SCMI, normalized sum of the bilateral sternocleidomastoid muscle areas at the levels of C2, C3, and C4 vertebrae values for stature.
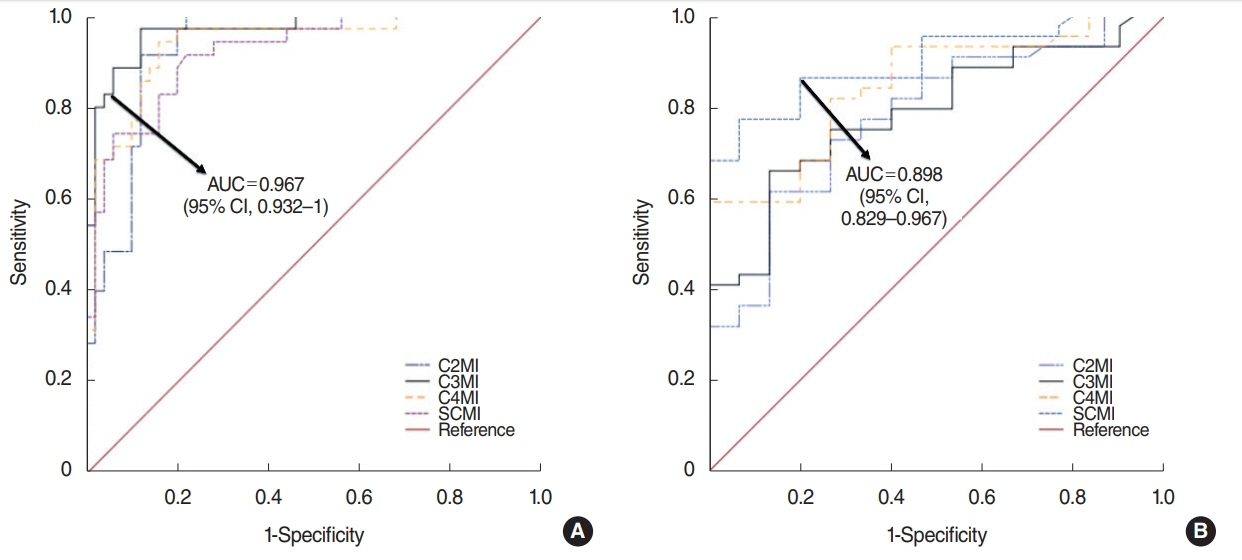
Fig. 4. Receiver operation characteristic curve for prediction of sarcopenia for the assessment of C3MI in males (A) and C4MI in females (B). AUC, area under the curve; CI, confidence interval; C2MI–C4MI, normalized paravertebral skeletal muscle areas at the level of C2–C4 vertebrae values for stature; SCMI, normalized sum of the bilateral sternocleidomastoid muscle areas at the levels of C2, C3, and C4 vertebrae values for stature.
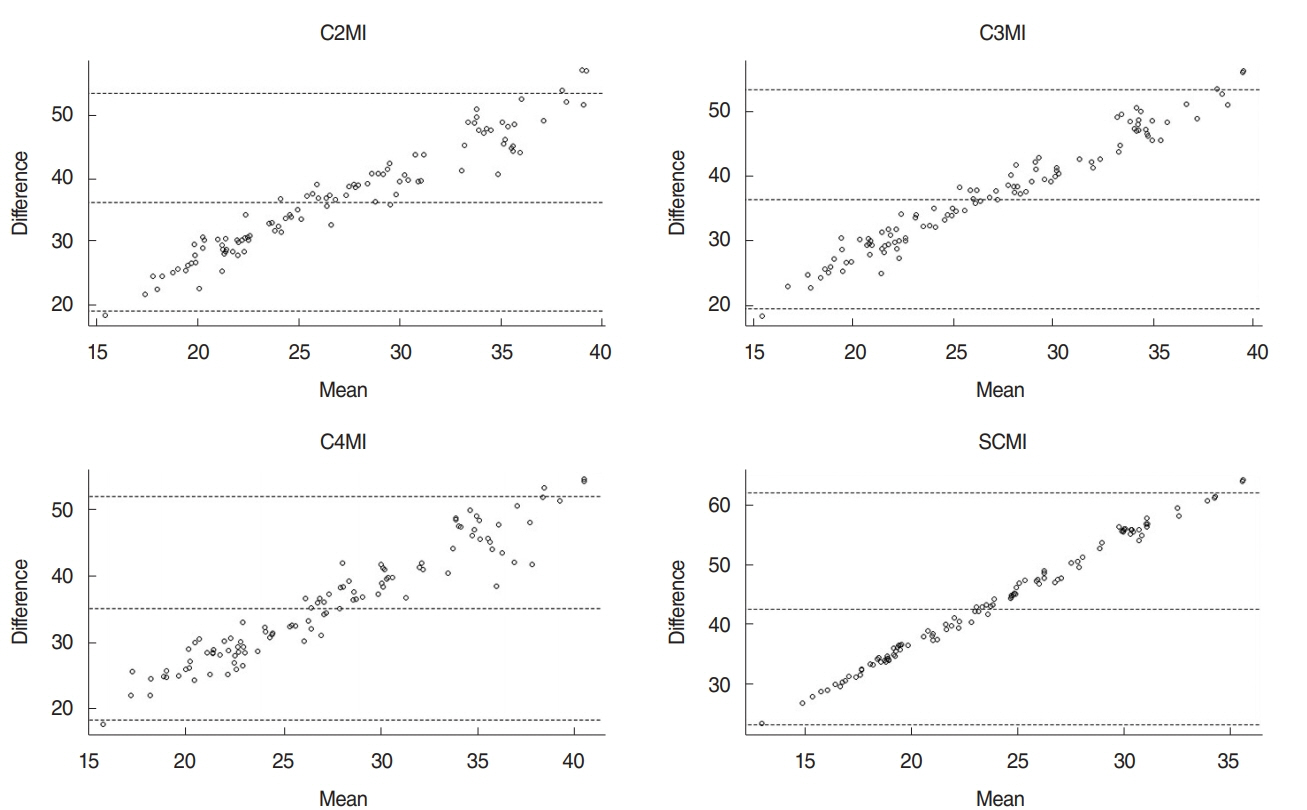
Fig. 5. Bland-Altman plots show the agreement of the L3MI and cervical paravertebral muscle indexes (C2MI, C3MI, C4MI, and SCMI) measurements. C2MI–C4MI, normalized paravertebral skeletal muscle areas at the levels of second (C2), third (C3), and fourth (C4) cervical vertebrae values for stature; SCMI, normalized sum of the bilateral sternocleidomastoid muscle areas at the levels of C2, C3, and C4 vertebrae values for stature; L3MI, normalized sum of the all skeletal muscle area at the lower part of L3 level value for stature.
Reference
-
1. Pressoir M, Desne S, Berchery D, Rossignol G, Poiree B, Meslier M, et al. Prevalence, risk factors and clinical implications of malnutrition in French Comprehensive Cancer Centres. Br J Cancer. 2010; Mar. 102(6):966–71.
Article2. Nishikawa D, Hanai N, Suzuki H, Koide Y, Beppu S, Hasegawa Y. The impact of skeletal muscle depletion on head and neck squamous cell carcinoma. ORL J Otorhinolaryngol Relat Spec. 2018; May. 80(1):1–9.
Article3. Martin L, Birdsell L, Macdonald N, Reiman T, Clandinin MT, McCargar LJ, et al. Cancer cachexia in the age of obesity: skeletal muscle depletion is a powerful prognostic factor, independent of body mass index. J Clin Oncol. 2013; Apr. 31(12):1539–47.
Article4. O’Brien S, Twomey M, Moloney F, Kavanagh RG, Carey BW, Power D, et al. Sarcopeni and post-operative morbidity and mortality in patients with gastric cancer. J Gastric Cancer. 2018; Sep. 18(3):242–52.5. Shirai H, Kaido T, Hamaguchi Y, Yao S, Kobayashi A, Okumura S, et al. Preoperative low muscle mass has a strong negative effect on pulmonary function in patients undergoing living donor liver transplantation. Nutrition. 2018; Jan. 45:1–10.
Article6. Ebadi M, Wang CW, Lai JC, Dasarathy S, Kappus MR, Dunn MA, et al. Poor performance of psoas muscle index for identification of patients with higher waitlist mortality risk in cirrhosis. J Cachexia Sarcopenia Muscle. 2018; Dec. 9(6):1053–62.
Article7. Weijs PJ, Looijaard WG, Dekker IM, Stapel SN, Girbes AR, Oudemans-van Straaten HM, et al. Low skeletal muscle area is a risk factor for mortality in mechanically ventilated critically ill patients. Crit Care. 2014; Jan. 18(2):R12.
Article8. Cruz-Jentoft AJ, Baeyens JP, Bauer JM, Boirie Y, Cederholm T, Landi F, et al. Sarcopenia: European consensus on definition and diagnosis: report of the European Working Group on Sarcopenia in Older People. Age Ageing. 2010; Jul. 39(4):412–23.
Article9. Prado CM, Lieffers JR, McCargar LJ, Reiman T, Sawyer MB, Martin L, et al. Prevalence and clinical implications of sarcopenic obesity in patients with solid tumours of the respiratory and gastrointestinal tracts: a population-based study. Lancet Oncol. 2008; Jul. 9(7):629–35.
Article10. Cooper C, Fielding R, Visser M, van Loon LJ, Rolland Y, Orwoll E, et al. Tools in the assessment of sarcopenia. Calcif Tissue Int. 2013; Sep. 93(3):201–10.
Article11. Mourtzakis M, Prado CM, Lieffers JR, Reiman T, McCargar LJ, Baracos VE. A practical and precise approach to quantification of body composition in cancer patients using computed tomography images acquired during routine care. Appl Physiol Nutr Metab. 2008; Oct. 33(5):997–1006.
Article12. Fearon K, Strasser F, Anker SD, Bosaeus I, Bruera E, Fainsinger RL, et al. Definition and classification of cancer cachexia: an international consensus. Lancet Oncol. 2011; May. 12(5):489–95.
Article13. Derstine BA, Holcombe SA, Goulson RL, Ross BE, Wang NC, Sullivan JA, et al. Quantifying sarcopenia reference values using lumbar and thoracic muscle areas in a healthy population. J Nutr Health Aging. 2018; Jan. 22(1):180–5.
Article14. Nemec U, Heidinger B, Sokas C, Chu L, Eisenberg RL. Diagnosing sarcopenia on thoracic computed tomography: quantitative assessment of skeletal muscle mass in patients undergoing transcatheter aortic valve replacement. Acad Radiol. 2017; Sep. 24(9):1154–61.15. Kim EY, Kim YS, Park I, Ahn HK, Cho EK, Jeong YM, et al. Evaluation of sarcopenia in small-cell lung cancer patients by routine chest CT. Support Care Cancer. 2016; Nov. 24(11):4721–6.
Article16. Derstine BA, Holcombe SA, Ross BE, Wang NC, Su GL, Wang SC. Skeletal muscle cutoff values for sarcopenia diagnosis using T10 to L5 measurements in a healthy US population. Sci Rep. 2018; Jul. 8(1):11369.
Article17. Shen W, Punyanitya M, Wang Z, Gallagher D, St-Onge MP, Albu J, et al. Total body skeletal muscle and adipose tissue volumes: estimation from a single abdominal cross-sectional image. J Appl Physiol. 2004; Dec. 97(6):2333–8.
Article18. Swartz JE, Pothen AJ, Wegner I, Smid EJ, Swart KM, de Bree R, et al. Feasibility of using head and neck CT imaging to assess skeletal muscle mass in head and neck cancer patients. Oral Oncol. 2016; Nov. 62:28–33.
Article19. Oken MM, Creech RH, Tormey DC, Horton J, Davis TE, McFadden ET, et al. Toxicity and response criteria of the Eastern Cooperative Oncology Group. Am J Clin Oncol. 1982; Dec. 5(6):649–55.
Article20. Wendrich AW, Swartz JE, Bril SI, Wegner I, de Graeff A, Smid EJ, et al. Low skeletal muscle mass is a predictive factor for chemotherapy dose-limiting toxicity in patients with locally advanced head and neck cancer. Oral Oncol. 2017; Aug. 71:26–33.
Article21. Sanderson RJ, Ironside JA. Squamous cell carcinomas of the head and neck. BMJ. 2002; Oct. 325(7368):822–7.
