Effects of Omega-3 Supplementation on Adipocytokines in Prediabetes and Type 2 Diabetes Mellitus: Systematic Review and Meta-Analysis of Randomized Controlled Trials
- Affiliations
-
- 1Department of Pharmacology and Toxicology, Faculty of Life Sciences, University of Vienna, Vienna, Austria. tarikbecix@gmail.com
- KMID: 2418702
- DOI: http://doi.org/10.4093/dmj.2018.42.2.101
Abstract
- BACKGROUND
The objective of this systematic review and meta-analysis was to determine the effects of omega-3 supplementation on adipocytokine levels in adult prediabetic and diabetic individuals.
METHODS
We searched PubMed, Medline, EMBASE, Scopus, Web of Science, Google Scholar, Cochrane Trial Register, World Health Organization Clinical Trial Registry Platform, and Clinicaltrial.gov Registry from inception to August 1, 2017 for randomized controlled trials. Pooled effects of interventions were assessed as mean difference using random effects model. We conducted a sensitivity, publication bias and subgroup analysis.
RESULTS
Fourteen studies individuals (n = 685) were included in the meta-analysis. Omega-3 supplementation increased levels of adiponectin (0.48 µg/mL; 95% confidence interval [CI], 0.27 to 0.68; P < 0.00001, n = 10 trials), but effects disappeared after sensitivity analysis. Tumor necrosis factor α (TNF-α) levels were reduced (−1.71; 95% CI, −3.38 to −0.14; P = 0.03, n = 8 trials). Treatment duration shorter than 12 weeks was associated with greater reduction than longer treatment duration. Levels of other adipocytokines were not significantly affected. Publication bias could generally not be excluded.
CONCLUSION
Eicosapentaenoic acid and docosahexaenoic acid supplementation may increase adiponectin and reduce TNF-α levels in this population group. However, due to overall study heterogeneity and potential publication bias, a cautious interpretation is needed.
Keyword
MeSH Terms
-
Adipokines*
Adiponectin
Adult
Diabetes Mellitus
Diabetes Mellitus, Type 2*
Eicosapentaenoic Acid
Fatty Acids, Omega-3
Humans
Population Characteristics
Population Groups
Prediabetic State*
Publication Bias
Tumor Necrosis Factor-alpha
World Health Organization
Adipokines
Adiponectin
Eicosapentaenoic Acid
Fatty Acids, Omega-3
Tumor Necrosis Factor-alpha
Figure
-

Fig. 1 Flow diagram.
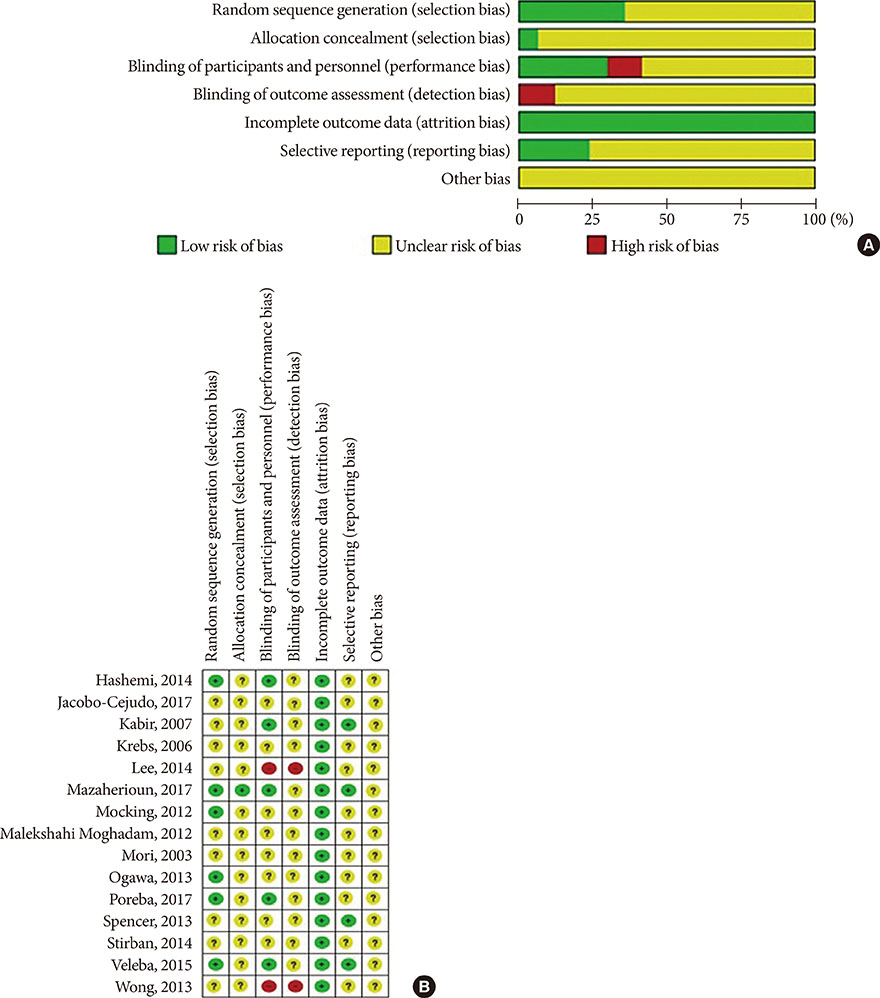
Fig. 2 Risk of bias assessment tool. (A) Summary of risk of bias of across the trials included in the systematic review. Information for every study characteristic was pooled from every trial (green: low risk of bias; yellow: unclear risk of bias; red: high risk of bias), combined and overall results expressed in percentages. (B) Overview of risk of bias across individual trials according to study characteristics. Each bias domain was evaluated carefully from every trial and decided whether the information provided reflected a low risk of bias (green), high risk of bias (red), or if insufficient information was provided and the risk of bias was therefore unclear (yellow).
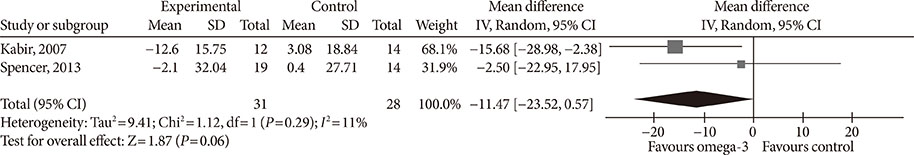
Fig. 3 Influence of omega-3 fatty acids supplementation on plasminogen-activator inhibitor 1 levels (ng/mL). Forest plot shows pooled mean differences with 95% confidence intervals (CIs) for two randomized controlled trials. The green colored square represents the point estimate of the effect of the intervention for each trial. The horizontal line joins the upper and lower limits of the 95% CI of the effects. The square area represents the relative weight of the trial in the meta-analysis. The black colored diamond at the bottom represents the pooled mean difference with 95% CI for all study groups. SD, standard deviation; IV, interval variable.
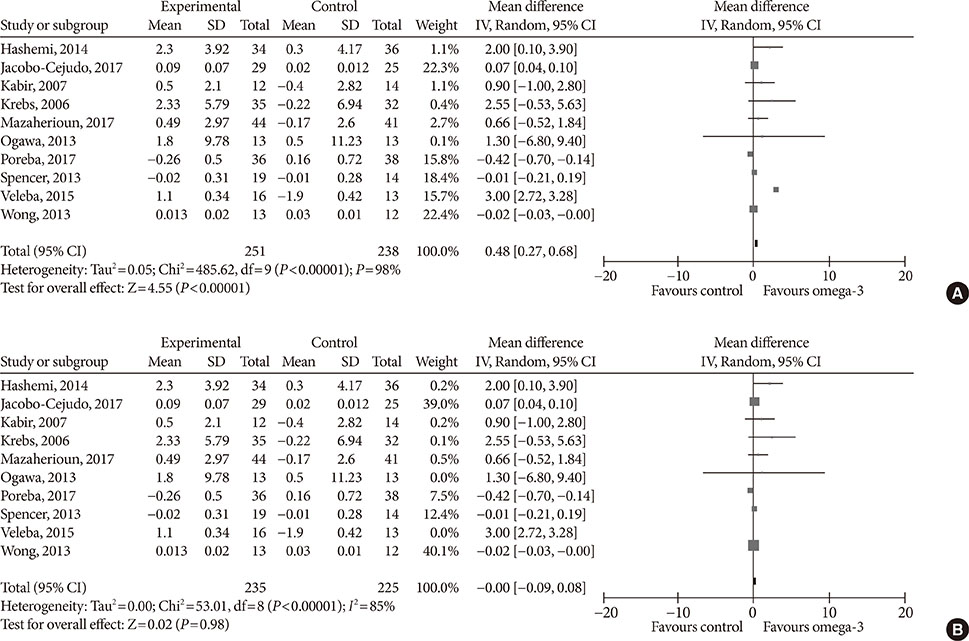
Fig. 4 Influence of omega-3 fatty acids supplementation on adiponectin levels (µg/mL). (A) Forest plot shows pooled mean differences with 95% confidence intervals (CIs) for 10 randomized controlled trials. The green colored square represents the point estimate of the effect of the intervention for each trial. The horizontal line joins the upper and lower limits of the 95% CI of the effects. The square area represents the relative weight of the trial in the meta-analysis. The black colored diamond at the bottom represents the pooled mean difference with 95% CI for all study groups. As opposed to graphs for all other outcome parameters, the labels of the X-axis are different, because an increase in adiponectin levels is seen as favorable. (B) Meta-analysis after eliminating Veleba et al. [43] as part of the leave-one-out sensitivity analysis (the trial was given a relative weight of 0.0%). SD, standard deviation; IV, interval variable.
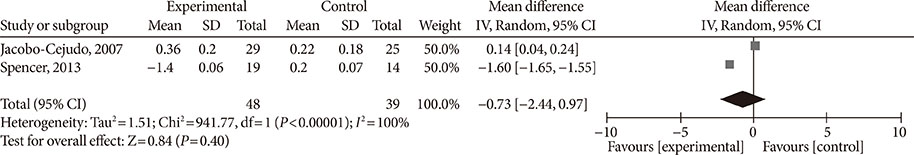
Fig. 5 Influence of omega-3 fatty acids supplementation on resisting levels (ng/mL). Forest plot shows pooled mean differences with 95% confidence intervals (CIs) for two randomized controlled trials. The green colored square represents the point estimate of the effect of the intervention for each trial. The horizontal line joins the upper and lower limits of the 95% CI of the effects. The square area represents the relative weight of the trial in the meta-analysis. The black colored diamond at the bottom represents the pooled mean difference with 95% CI for all study groups. SD, standard deviation; IV, interval variable.
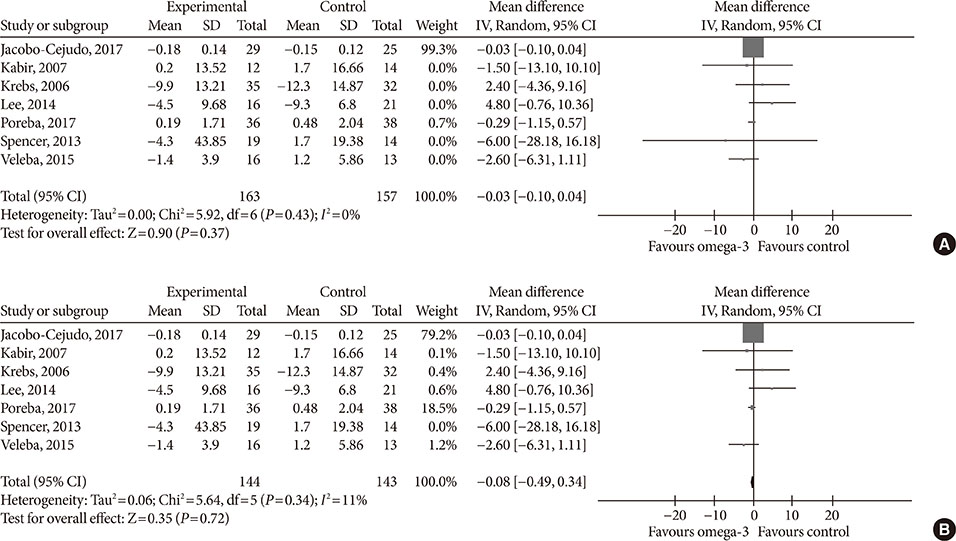
Fig. 6 Influence of omega-3 fatty acids supplementation on leptin levels (ng/mL). (A) Forest plot shows pooled mean differences with 95% confidence intervals (CIs) for seven randomized controlled trials. The green colored square represents the point estimate of the effect of the intervention for each trial. The horizontal line joins the upper and lower limits of the 95% CI of the effects. The square area represents the relative weight of the trial in the meta-analysis. Notice the absence of the black colored diamond at the bottom as in other graphs because of the magnitude of the pooled mean difference with 95% CI for all study groups. (B) Meta-analysis after eliminating Spencer et al. [41] as part of the leave-one-out sensitivity analysis (the trial was given a relative weight of 0.0%). SD, standard deviation; IV, interval variable.
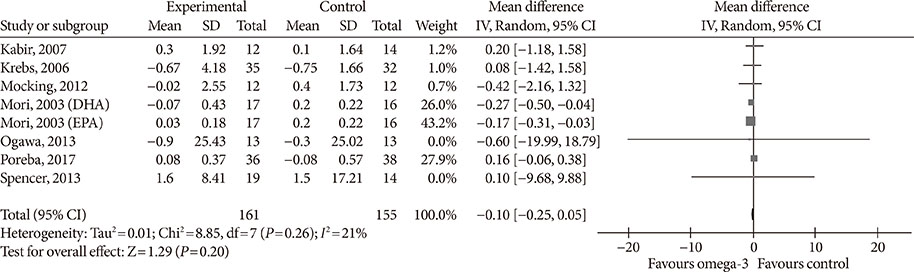
Fig. 7 Influence of omega-3 fatty acids supplementation on interleukin 6 levels (pg/mL). Forest plot shows pooled mean differences with 95% confidence intervals (CIs) for eight intervention effects pooled from seven randomized controlled trials (two separate effects were pooled for docosahexaenoic acid [DHA] and eicosapentaenoic acid [EPA] treatment arms from Mori et al. [38]). The green colored square represents the point estimate of the effect of the intervention for each intervention. The horizontal line joins the upper and lower limits of the 95% CI of the effects. The square area represents the relative weight of the interventions in the meta-analysis. SD, standard deviation; IV, interval variable.

Fig. 8 Influence of omega-3 fatty acids supplementation on tumor necrosis factor α levels (pg/mL). (A) Forest plot shows pooled mean differences with 95% confidence intervals (CIs) for nine intervention effects pooled from eight randomized controlled trials (two separate effects were pooled for docosahexaenoic acid [DHA] and eicosapentaenoic acid [EPA] treatment arms from Mori et al. [38]). The green colored square represents the point estimate of the effect of the intervention for each intervention. The horizontal line joins the upper and lower limits of the 95% CI of the effects. The square area represents the relative weight of the interventions in the meta-analysis. (B) Meta-analysis after eliminating Spencer et al. [41] as part of the leave-one-out sensitivity analysis (the trial was given a relative weight of 0.0%). SD, standard deviation; IV, interval variable.
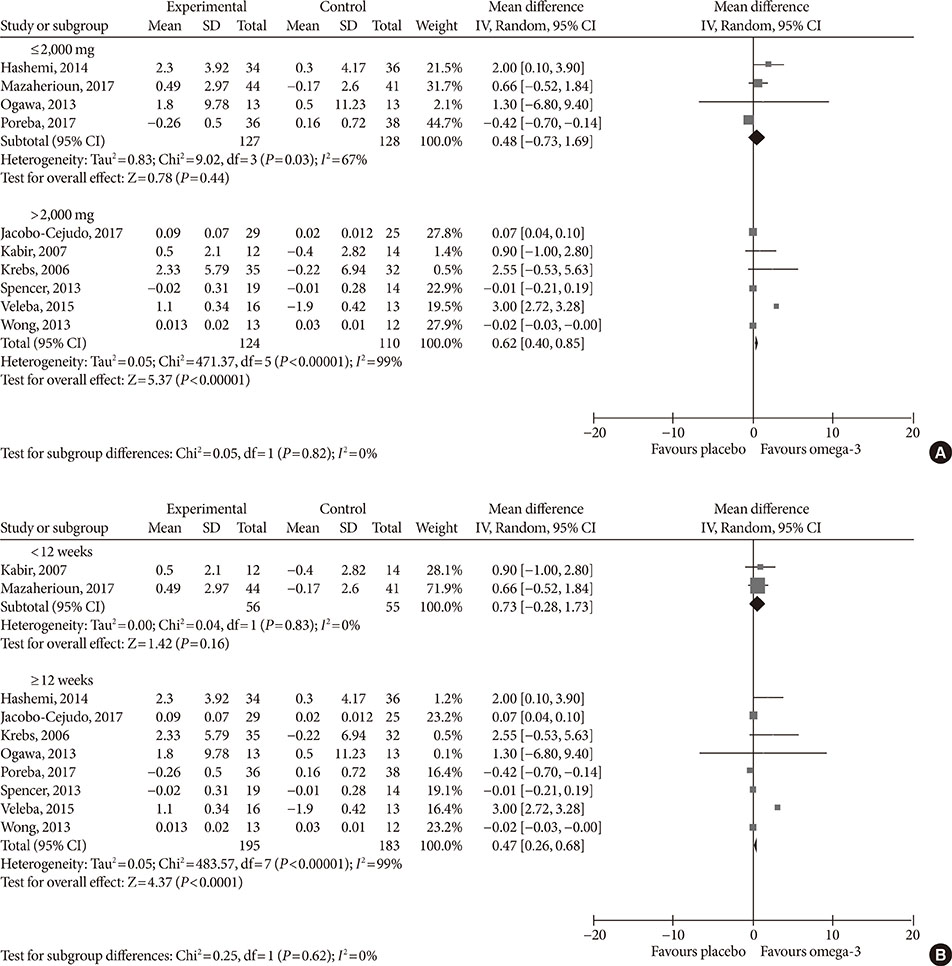
Fig. 9 Subgroup analysis on the influence of omega-3 fatty acids supplementation according to (A) omega-3 dose and (B) treatment duration for adiponectin (µg/mL). Forest plot shows pooled mean differences with 95% confidence intervals (CIs). The green colored square represents the point estimate of the effect of the intervention for each trial. The horizontal line joins the upper and lower limits of the 95% CI of the effects. The square area represents the relative weight of the trial in the meta-analysis. The black colored diamond at the bottom represents the pooled mean difference with 95% CI for all study groups. SD, standard deviation; IV, interval variable.
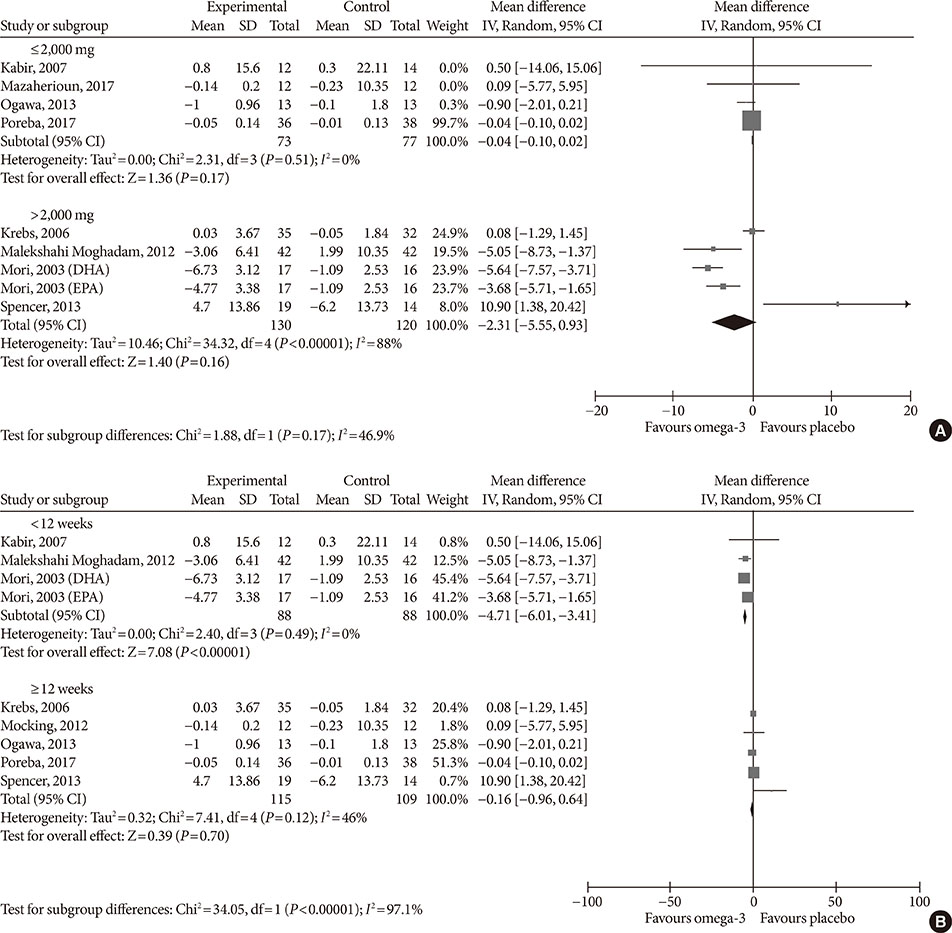
Fig. 10 Subgroup analysis on the influence of omega-3 fatty acids supplementation according to (A) omega-3 dose and (B) treatment duration for tumor necrosis factor α (pg/mL). Forest plot shows pooled mean differences with 95% confidence intervals (CIs). The green colored square represents the point estimate of the effect of the intervention for each trial. The horizontal line joins the upper and lower limits of the 95% CI of the effects. The square area represents the relative weight of the trial in the meta-analysis. The black colored diamond at the bottom represents the pooled mean difference with 95% CI for all study groups. SD, standard deviation; IV, interval variable; DHA, docosahexaenoic acid; EPA, eicosapentaenoic acid.
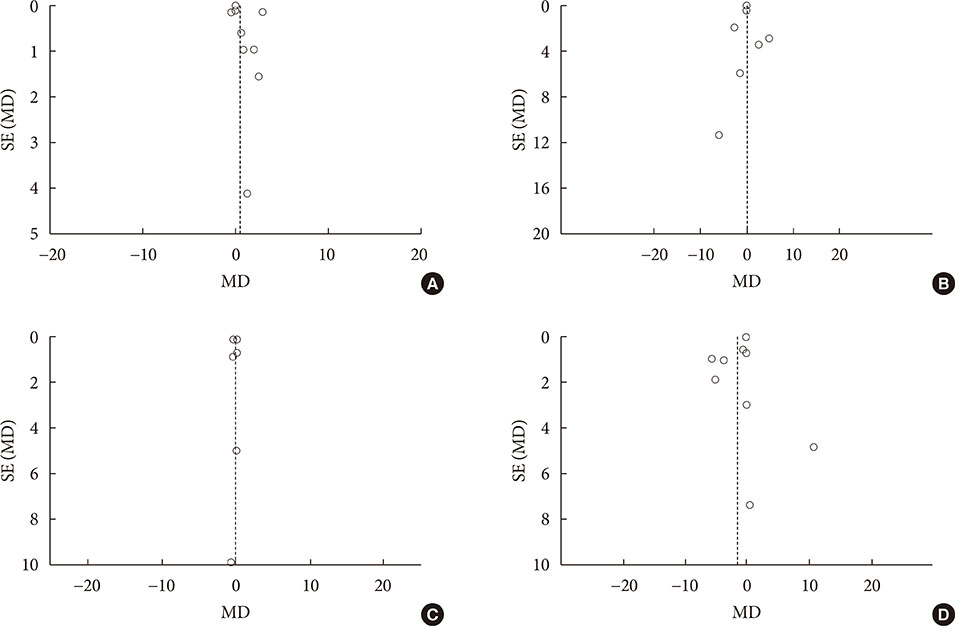
Fig. 11 Funnel plot displaying study precision against the mean difference (MD) effect estimate with 95% confidence interval for (A) adiponectin, (B) leptin, (C) interleukin 6, and (D) tumor necrosis factor α. SE, standard error.
Reference
-
1. World Health Organization. Diabetes fact sheet. cited 2018 Apr 9. Available from: http://www.who.int/mediacentre/factsheets/fs312/en.2. American Diabetes Association. Economic costs of diabetes in the U.S. in 2012. Diabetes Care. 2013; 36:1033–1046.3. Eckel RH, Kahn SE, Ferrannini E, Goldfine AB, Nathan DM, Schwartz MW, Smith RJ, Smith SR. Endocrine Society. American Diabetes Association. European Association for the Study of Diabetes. Obesity and type 2 diabetes: what can be unified and what needs to be individualized? Diabetes Care. 2011; 34:1424–1430.
Article4. World Health Organization (WHO). Obesity and overweight fact sheet. cited 2018 Apr 9. Available from: http://www.who.int/mediacentre/factsheets/fs311/en.5. Bertoni AG, Krop JS, Anderson GF, Brancati FL. Diabetes-related morbidity and mortality in a national sample of U.S. elders. Diabetes Care. 2002; 25:471–475.
Article6. Tabak AG, Herder C, Rathmann W, Brunner EJ, Kivimaki M. Prediabetes: a high-risk state for diabetes development. Lancet. 2012; 379:2279–2290.7. Cerf ME. Beta cell dysfunction and insulin resistance. Front Endocrinol (Lausanne). 2013; 4:37.
Article8. Gomez-Ambrosi J, Silva C, Galofre JC, Escalada J, Santos S, Gil MJ, Valenti V, Rotellar F, Ramirez B, Salvador J, Fruhbeck G. Body adiposity and type 2 diabetes: increased risk with a high body fat percentage even having a normal BMI. Obesity (Silver Spring). 2011; 19:1439–1444.9. Guilherme A, Virbasius JV, Puri V, Czech MP. Adipocyte dysfunctions linking obesity to insulin resistance and type 2 diabetes. Nat Rev Mol Cell Biol. 2008; 9:367–377.
Article10. Lehr S, Hartwig S, Sell H. Adipokines: a treasure trove for the discovery of biomarkers for metabolic disorders. Proteomics Clin Appl. 2012; 6:91–101.
Article11. Rabe K, Lehrke M, Parhofer KG, Broedl UC. Adipokines and insulin resistance. Mol Med. 2008; 14:741–751.
Article12. Dunmore SJ, Brown JE. The role of adipokines in β-cell failure of type 2 diabetes. J Endocrinol. 2013; 216:T37–T45.
Article13. Sans S, Padro T, Tuomilehto J, Badimon L. Incidence of diabetes and serum adipokines in Catalonian men: the ADIPOCAT study. Ann Med. 2013; 45:97–102.
Article14. Gulcelik NE, Karakaya J, Gedik A, Usman A, Gurlek A. Serum vaspin levels in type 2 diabetic women in relation to microvascular complications. Eur J Endocrinol. 2009; 160:65–70.
Article15. Pradeepa R, Surendar J, Indulekha K, Chella S, Anjana RM, Mohan V. Association of serum adiponectin with diabetic microvascular complications among south Indian type 2 diabetic subjects: (CURES-133). Clin Biochem. 2015; 48:33–38.16. Schultz H. Retail omega-3s sales to hit $34.7 billion in 2016, report predicts. updated 2012 Oct 3. Available from: http://www.nutraingredients-usa.com/Markets/Retail-omega-3s-sales-to-hit-34.7-billion-in-2016-report-predicts.17. Swanson D, Block R, Mousa SA. Omega-3 fatty acids EPA and DHA: health benefits throughout life. Adv Nutr. 2012; 3:1–7.
Article18. Wu JH, Micha R, Imamura F, Pan A, Biggs ML, Ajaz O, Djousse L, Hu FB, Mozaffarian D. Omega-3 fatty acids and incident type 2 diabetes: a systematic review and meta-analysis. Br J Nutr. 2012; 107:Suppl 2. S214–S227.
Article19. Virtanen JK, Mursu J, Voutilainen S, Uusitupa M, Tuomainen TP. Serum omega-3 polyunsaturated fatty acids and risk of incident type 2 diabetes in men: the Kuopio Ischemic Heart Disease Risk Factor study. Diabetes Care. 2014; 37:189–196.
Article20. Han E, Yun Y, Kim G, Lee YH, Wang HJ, Lee BW, Cha BS, Kim BS, Kang ES. Effects of omega-3 fatty acid supplementation on diabetic nephropathy progression in patients with diabetes and hypertriglyceridemia. PLoS One. 2016; 11:e0154683.
Article21. Gray B, Steyn F, Davies PS, Vitetta L. Omega-3 fatty acids: a review of the effects on adiponectin and leptin and potential implications for obesity management. Eur J Clin Nutr. 2013; 67:1234–1242.
Article22. Kang JX, Weylandt KH. Modulation of inflammatory cytokines by omega-3 fatty acids. Subcell Biochem. 2008; 49:133–143.
Article23. Higgins JP, Altman DG, Gotzsche PC, Juni P, Moher D, Oxman AD, Savovic J, Schulz KF, Weeks L, Sterne JA. Cochrane Bias Methods Group. Cochrane Statistical Methods Group. The Cochrane Collaboration's tool for assessing risk of bias in randomised trials. BMJ. 2011; 343:d5928.
Article24. Hozo SP, Djulbegovic B, Hozo I. Estimating the mean and variance from the median, range, and the size of a sample. BMC Med Res Methodol. 2005; 5:13.
Article25. Follmann D, Elliott P, Suh I, Cutler J. Variance imputation for overviews of clinical trials with continuous response. J Clin Epidemiol. 1992; 45:769–773.
Article26. Higgins JPT, Greean S. Cochrane handbook for systematic reviews of interventions, version 5.1.0. cited 2018 Apr 9. Available from: http://handbook.cochrane.org.27. Cochrane Community. Review Manager 5.3. (cited 2018 Apr 9). Available from: http://tech.cochrane.org/revman/download.28. DerSimonian R, Laird N. Meta-analysis in clinical trials. Control Clin Trials. 1986; 7:177–188.
Article29. Higgins JP, Thompson SG. Quantifying heterogeneity in a meta-analysis. Stat Med. 2002; 21:1539–1558.
Article30. Hashemi SB, Sarbolouki S, Djalali M, Dorosty A, Djazayery SA, Eshraghian MR, Ebadi A, Sharif MR, Nikoueinejad H. Adiponectin and glycemic profiles in type 2 diabetes patients on eicosapentaenoic acid with or without vitamin E. Acta Endo (Buc). 2014; 10:84–96.
Article31. Jacobo-Cejudo MG, Valdes-Ramos R, Guadarrama-Lopez AL, Pardo-Morales RV, Martinez-Carrillo BE, Harbige LS. Effect of n-3 polyunsaturated fatty acid supplementation on metabolic and inflammatory biomarkers in type 2 diabetes mellitus patients. Nutrients. 2017; 9:E573.
Article32. Kabir M, Skurnik G, Naour N, Pechtner V, Meugnier E, Rome S, Quignard-Boulange A, Vidal H, Slama G, Clement K, Guerre-Millo M, Rizkalla SW. Treatment for 2 mo with n 3 polyunsaturated fatty acids reduces adiposity and some atherogenic factors but does not improve insulin sensitivity in women with type 2 diabetes: a randomized controlled study. Am J Clin Nutr. 2007; 86:1670–1679.33. Krebs JD, Browning LM, McLean NK, Rothwell JL, Mishra GD, Moore CS, Jebb SA. Additive benefits of long-chain n-3 polyunsaturated fatty acids and weight-loss in the management of cardiovascular disease risk in overweight hyperinsulinaemic women. Int J Obes (Lond). 2006; 30:1535–1544.
Article34. Lee TC, Ivester P, Hester AG, Sergeant S, Case LD, Morgan T, Kouba EO, Chilton FH. The impact of polyunsaturated fatty acid-based dietary supplements on disease biomarkers in a metabolic syndrome/diabetes population. Lipids Health Dis. 2014; 13:196.
Article35. Mazaherioun M, Saedisomeolia A, Javanbakht MH, Koohdani F, Eshraghian MR, Djalali M. Beneficial effects of n-3 polyunsaturated fatty acids on adiponectin levels and AdipoR gene expression in patients with type 2 diabetes mellitus: a randomized, placebo-controlled, double-blind clinical trial. Arch Med Sci. 2017; 13:716–724.
Article36. Mocking RJ, Assies J, Bot M, Jansen EH, Schene AH, Pouwer F. Biological effects of add-on eicosapentaenoic acid supplementation in diabetes mellitus and co-morbid depression: a randomized controlled trial. PLoS One. 2012; 7:e49431.
Article37. Malekshahi Moghadam A, Saedisomeolia A, Djalali M, Djazayery A, Pooya S, Sojoudi F. Efficacy of omega-3 fatty acid supplementation on serum levels of tumour necrosis factor-alpha, C-reactive protein and interleukin-2 in type 2 diabetes mellitus patients. Singapore Med J. 2012; 53:615–619.38. Mori TA, Woodman RJ, Burke V, Puddey IB, Croft KD, Beilin LJ. Effect of eicosapentaenoic acid and docosahexaenoic acid on oxidative stress and inflammatory markers in treated-hypertensive type 2 diabetic subjects. Free Radic Biol Med. 2003; 35:772–781.
Article39. Ogawa S, Abe T, Nako K, Okamura M, Senda M, Sakamoto T, Ito S. DIMS Study Group. Eicosapentaenoic acid improves glycemic control in elderly bedridden patients with type 2 diabetes. Tohoku J Exp Med. 2013; 231:63–74.
Article40. Poreba M, Mostowik M, Siniarski A, Golebiowska-Wiatrak R, Malinowski KP, Haberka M, Konduracka E, Nessler J, Undas A, Gajos G. Treatment with high-dose n-3 PUFAs has no effect on platelet function, coagulation, metabolic status or inflammation in patients with atherosclerosis and type 2 diabetes. Cardiovasc Diabetol. 2017; 16:50.
Article41. Spencer M, Finlin BS, Unal R, Zhu B, Morris AJ, Shipp LR, Lee J, Walton RG, Adu A, Erfani R, Campbell M, McGehee RE Jr, Peterson CA, Kern PA. Omega-3 fatty acids reduce adipose tissue macrophages in human subjects with insulin resistance. Diabetes. 2013; 62:1709–1717.
Article42. Stirban A, Nandrean S, Götting C, Stratmann B, Tschoepe D. Effects of n-3 polyunsaturated fatty acids (PUFAs) on circulating adiponectin and leptin in subjects with type 2 diabetes mellitus. Horm Metab Res. 2014; 46:490–492.
Article43. Veleba J, Kopecky J Jr, Janovska P, Kuda O, Horakova O, Malinska H, Kazdova L, Oliyarnyk O, Skop V, Trnovska J, Hajek M, Skoch A, Flachs P, Bardova K, Rossmeisl M, Olza J, de Castro GS, Calder PC, Gardlo A, Fiserova E, Jensen J, Bryhn M, Kopecky J Sr, Pelikanova T. Combined intervention with pioglitazone and n-3 fatty acids in metformin-treated type 2 diabetic patients: improvement of lipid metabolism. Nutr Metab (Lond). 2015; 12:52.
Article44. Wong AT, Chan DC, Barrett PH, Adams LA, Watts GF. Supplementation with n3 fatty acid ethyl esters increases large and small artery elasticity in obese adults on a weight loss diet. J Nutr. 2013; 143:437–441.
Article45. Declerck PJ, Alessi MC, Verstreken M, Kruithof EK, Juhan-Vague I, Collen D. Measurement of plasminogen activator inhibitor 1 in biologic fluids with a murine monoclonal antibody-based enzyme-linked immunosorbent assay. Blood. 1988; 71:220–225.
Article46. Vague P, Juhan-Vague I, Aillaud MF, Badier C, Viard R, Alessi MC, Collen D. Correlation between blood fibrinolytic activity, plasminogen activator inhibitor level, plasma insulin level, and relative body weight in normal and obese subjects. Metabolism. 1986; 35:250–253.
Article47. Yarmolinsky J, Bordin Barbieri N, Weinmann T, Ziegelmann PK, Duncan BB, Ines Schmidt M. Plasminogen activator inhibitor-1 and type 2 diabetes: a systematic review and meta-analysis of observational studies. Sci Rep. 2016; 6:17714.
Article48. Schneider DJ, Sobel BE. PAI-1 and diabetes: a journey from the bench to the bedside. Diabetes Care. 2012; 35:1961–1967.
Article49. Lyon CJ, Hsueh WA. Effect of plasminogen activator inhibitor-1 in diabetes mellitus and cardiovascular disease. Am J Med. 2003; 115:Suppl 8A. 62S–68S.
Article50. Dardeno TA, Chou SH, Moon HS, Chamberland JP, Fiorenza CG, Mantzoros CS. Leptin in human physiology and therapeutics. Front Neuroendocrinol. 2010; 31:377–393.
Article51. Fischer S, Hanefeld M, Haffner SM, Fusch C, Schwanebeck U, Kohler C, Fucker K, Julius U. Insulin-resistant patients with type 2 diabetes mellitus have higher serum leptin levels independently of body fat mass. Acta Diabetol. 2002; 39:105–110.
Article52. Martin SS, Qasim A, Reilly MP. Leptin resistance: a possible interface of inflammation and metabolism in obesity-related cardiovascular disease. J Am Coll Cardiol. 2008; 52:1201–1210.53. Zhou Y, Rui L. Leptin signaling and leptin resistance. Front Med. 2013; 7:207–222.
Article54. Hariri M, Ghiasvand R, Shiranian A, Askari G, Iraj B, Salehi-Abargouei A. Does omega-3 fatty acids supplementation affect circulating leptin levels? A systematic review and meta-analysis on randomized controlled clinical trials. Clin Endocrinol (Oxf). 2015; 82:221–228.
Article55. Chandran M, Phillips SA, Ciaraldi T, Henry RR. Adiponectin: more than just another fat cell hormone? Diabetes Care. 2003; 26:2442–2450.
Article56. Wu JH, Cahill LE, Mozaffarian D. Effect of fish oil on circulating adiponectin: a systematic review and meta-analysis of randomized controlled trials. J Clin Endocrinol Metab. 2013; 98:2451–2459.
Article57. Kusminski CM, McTernan PG, Kumar S. Role of resistin in obesity, insulin resistance and type II diabetes. Clin Sci (Lond). 2005; 109:243–256.
Article58. Jamaluddin MS, Weakley SM, Yao Q, Chen C. Resistin: functional roles and therapeutic considerations for cardiovascular disease. Br J Pharmacol. 2012; 165:622–632.
Article59. Goyal R, Faizy AF, Siddiqui SS, Singhai M. Evaluation of TNF-α and IL-6 levels in obese and non-obese diabetics: pre- and postinsulin effects. N Am J Med Sci. 2012; 4:180–184.60. Lontchi-Yimagou E, Sobngwi E, Matsha TE, Kengne AP. Diabetes mellitus and inflammation. Curr Diab Rep. 2013; 13:435–444.
Article
- Full Text Links
-
- Actions
-
Cited
- CITED
-
- Close
- Share
-
- Similar articles
-
- Erratum: Type of Manuscript Correction. Effects of Omega-3 Supplementation on Adipocytokines in Prediabetes and Type 2 Diabetes Mellitus: Systematic Review and Meta-Analysis of Randomized Controlled Trials
- The Effect of Omega-3 Supplementation on Heart Failure Outcome: A Meta-Analysis of Randomized Clinical Trial
- The Effects of Auricular Therapy in Patients with Type 2 Diabetes: A Systematic Review and Meta-Analysis
- Antioxidant Supplementation for Erectile Dysfunction: Systematic Review and Meta-Analysis of Double-Blind, Randomized, Placebo-Controlled Trials
- Vitamin D and Risk of Respiratory Tract Infections in Children: A Systematic Review and Meta-analysis of Randomized Controlled Trials
