Ann Dermatol.
2014 Jun;26(3):314-320.
Differences in the Known Cellular Composition of Benign Pigmented Skin Lesions Reflected in Computer-Aided Image Analysis
- Affiliations
-
- 1Department of Dermatology, Seoul National University Bundang Hospital, Seoul National University College of Medicine, Seongnam, Korea. swyoun@snu.ac.kr
Abstract
- BACKGROUND
Computer-aided image analysis (CAIA) has been suggested as an effective diagnostic tool for pigmented skin lesions (PSLs), especially melanoma. However, few studies on benign PSLs have been reported.
OBJECTIVE
The purpose of this study was to evaluate benign PSLs with our CAIA software and analyze the differences between the parameters of those lesions.
METHODS
By using homegrown CAIA software, we analyzed 3 kinds of PSLs-nevus, lentigo, and seborrheic keratosis. The group of seborrheic keratosis was divided into pigmented seborrheic keratosis, sebolentigine, and hyperkeratotic seborrheic keratosis. The CAIA was used to extract the color, as well as the morphological, textural, and topological features from each image.
RESULTS
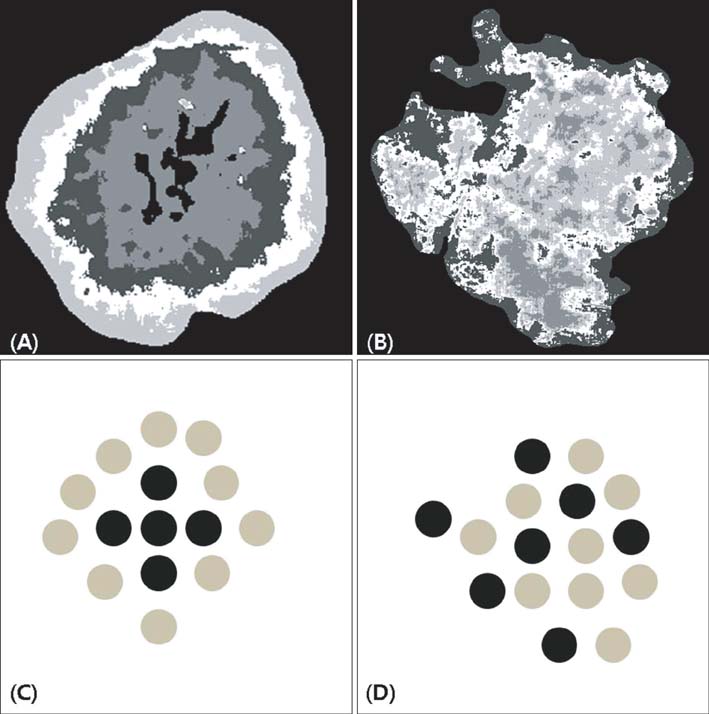
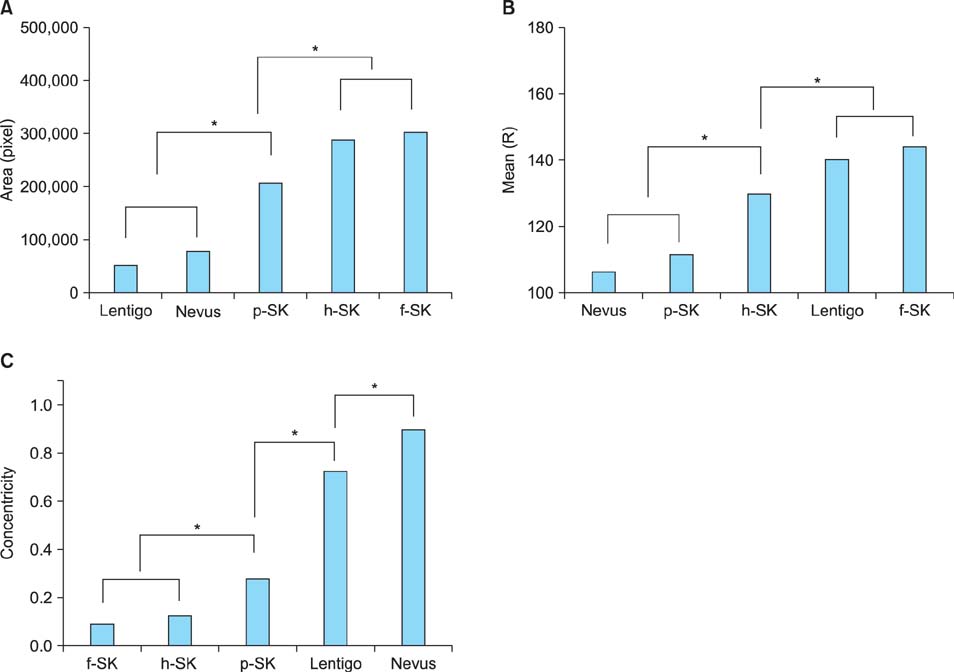
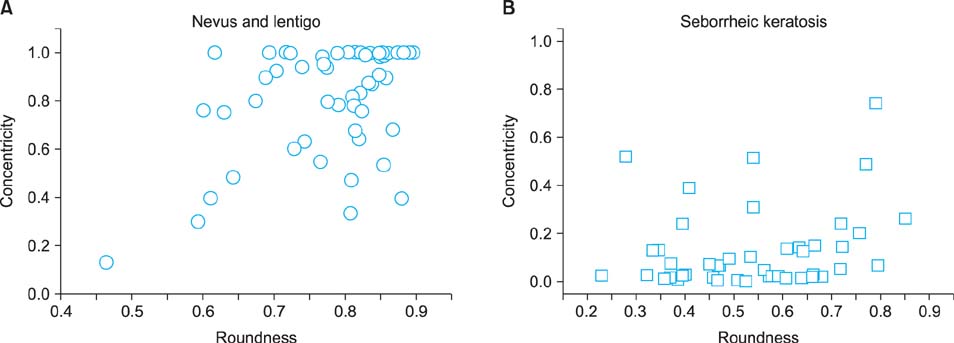
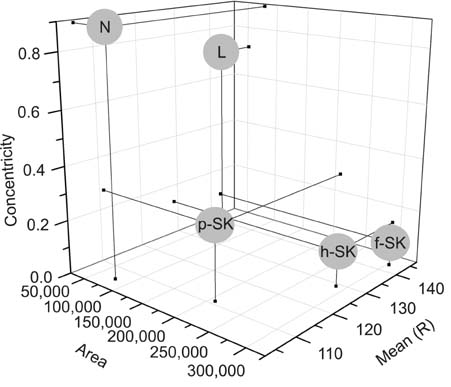
In line with clinical observations, the objective parameters indicated that nevus was dark and round, lentigo was small and bright, and seborrheic keratosis was large and spiky. The surface of nevus showed the highest contrast and correlation. In topological analysis, the concentricity clearly separated melanocytic lesions from seborrheic keratosis. The parameters of pigmented seborrheic keratosis were between those of typical nevus and seborrheic keratosis.
CONCLUSION
We confirmed that definite correlations exist between the subjective differentiation by experts' examination and the objective evaluation by using CAIA. We also found that the morphological differences observed in CAIA were greatly influenced by the composition ratios of keratinocytes and melanocytes, which are already known histopathological characteristics of each PSL.
Keyword
Figure
Reference
-
1. Nordlund JJ, Kirkwood J, Forget BM, Scheibner A, Albert DM, Lerner E, et al. Demographic study of clinically atypical (dysplastic) nevi in patients with melanoma and comparison subjects. Cancer Res. 1985; 45:1855–1861.2. Kim MM, Byrne PJ. Facial skin rejuvenation in the Asian patient. Facial Plast Surg Clin North Am. 2007; 15:381–386. vii
Article3. Scope A, Gill M, Benveuto-Andrade C, Halpern AC, Gonzalez S, Marghoob AA. Correlation of dermoscopy with in vivo reflectance confocal microscopy of streaks in melanocytic lesions. Arch Dermatol. 2007; 143:727–734.
Article4. Bassoli S, Seidenari S, Pellacani G, Longo C, Cesinaro AM. Reflectance confocal microscopy as an aid to dermoscopy to improve diagnosis on equivocal lesions: evaluation of three bluish nodules. Dermatol Res Pract. 2010; 2010:pii: 168248.
Article5. Ha S, Lee M, Lee O, Lee G, Kim J, Moon J, et al. A study of a method for distribution analysis of skin color. Skin Res Technol. 2009; 15:200–213.
Article6. Lee G, Lee O, Park S, Moon J, Oh C. Quantitative color assessment of dermoscopy images using perceptible color regions. Skin Res Technol. 2012; 18:462–470.
Article7. Møllersen K, Kirchesch HM, Schopf TG, Godtliebsen F. Unsupervised segmentation for digital dermoscopic images. Skin Res Technol. 2010; 16:401–407.
Article8. Zortea M, Skrøvseth SO, Schopf TR, Kirchesch HM, Godtliebsen F. Automatic segmentation of dermoscopic images by iterative classification. Int J Biomed Imaging. 2011; 2011:972648.
Article9. LeAnder R, Chindam P, Das M, Umbaugh SE. Differentiation of melanoma from benign mimics using the relative-color method. Skin Res Technol. 2010; 16:297–304.
Article10. Pantic I, Pantic S, Basta-Jovanovic G. Gray level co-occurrence matrix texture analysis of germinal center light zone lymphocyte nuclei: physiology viewpoint with focus on apoptosis. Microsc Microanal. 2012; 18:470–475.
Article11. Rajab MI. Segmentation of dermatoscopic images by frequency domain filtering and k-means clustering algorithms. Skin Res Technol. 2011; 17:469–478.
Article12. Barzegari M, Ghaninezhad H, Mansoori P, Taheri A, Naraghi ZS, Asgari M. Computer-aided dermoscopy for diagnosis of melanoma. BMC Dermatol. 2005; 5:8.
Article13. Burroni M, Corona R, Dell'Eva G, Sera F, Bono R, Puddu P, et al. Melanoma computer-aided diagnosis: reliability and feasibility study. Clin Cancer Res. 2004; 10:1881–1886.14. Kath R, Rodeck U, Menssen HD, Mancianti ML, Linnenbach AJ, Elder DE, et al. Tumor progression in the human melanocytic system. Anticancer Res. 1989; 9:865–872.15. Bryant J. Conservative clinical diagnoses in seborrheic keratosis. Arch Dermatol. 1998; 134:752–753.
Article16. Pellacani G, Cesinaro AM, Seidenari S. In vivo confocal reflectance microscopy for the characterization of melanocytic nests and correlation with dermoscopy and histology. Br J Dermatol. 2005; 152:384–386.
Article17. Marchesi L, Naldi L, Di Landro A, Cavalieri d'Oro L, Brevi A, Cainelli T. Segmental lentiginosis with "jentigo" histologic pattern. Am J Dermatopathol. 1992; 14:323–327.
Article18. Sahin MT, Oztürkcan S, Ermertcan AT, Güneş AT. A comparison of dermoscopic features among lentigo senilis/initial seborrheic keratosis, seborrheic keratosis, lentigo maligna and lentigo maligna melanoma on the face. J Dermatol. 2004; 31:884–889.
Article19. Eisen D, Voorhees JJ. Oral melanoma and other pigmented lesions of the oral cavity. J Am Acad Dermatol. 1991; 24:527–537.
Article
- Full Text Links
- Actions
-
Cited
- CITED
-
- Close
- Share
- Similar articles
-
- Differentiation of Benign Pigmented Skin Lesions with the Aid of Computer Image Analysis: A Novel Approach
- The Recent Progress in Quantitative Medical Image Analysis for Computer Aided Diagnosis Systems
- Detection of Breast Mass in Mammogram Using Computer-Aided Diagnosis System
- Fabricating a Ceramic-Pressed-to-Metal Restoration with Computer-Aided Design, Computer-Aided Manufacturing and Selective Laser Sintering: A Case Report
- Comparison of Optic Disc Measurements between Computer-aided Morphometry and Heidelberg Retina Tomograph


