T2 Relaxation Time Mapping of the Cartilage Cap of Osteochondromas
- Affiliations
-
- 1Department of Radiology, Cincinnati Children's Hospital Medical Center, Cincinnati, OH 45229-3039, USA. Hee.Kim@cchmc.org
- 2Department of Neurology, Cincinnati Children's Hospital Medical Center, Cincinnati, OH 45229-3039, USA.
- 3Department of Radiology, Children's Hospital of Philadelphia, University of Pennsylvania, Philadelphia, PA 19104, USA.
- 4Department of Pharmacology, Korea University College of Medicine, Seoul 02841, Korea.
- KMID: 2351176
- DOI: http://doi.org/10.3348/kjr.2016.17.1.159
Abstract
OBJECTIVE
Our aim was to evaluate the cartilage cap of osteochondromas using T2 maps and to compare these values to those of normal patellar cartilage, from age and gender matched controls.
MATERIALS AND METHODS
This study was approved by the Institutional Review Board and request for informed consent was waived. Eleven children (ages 5-17 years) with osteochondromas underwent MR imaging, which included T2-weighted fat suppressed and T2 relaxation time mapping (echo time = 9-99/repetition time = 1500 msec) sequences. Lesion origins were femur (n = 5), tibia (n = 3), fibula (n = 2), and scapula (n = 1). Signal intensity of the cartilage cap, thickness, mean T2 relaxation times, and T2 spatial variation (mean T2 relaxation times as a function of distance) were evaluated. Findings were compared to those of patellar cartilage from a group of age and gender matched subjects.
RESULTS
The cartilage caps showed a fluid-like high T2 signal, with mean thickness of 4.8 mm. The mean value of mean T2 relaxation times of the osteochondromas was 264.0 +/- 80.4 msec (range, 151.0-366.0 msec). Mean T2 relaxation times were significantly longer than the values from patellar cartilage (39.0 msec) (p < 0.0001). These findings were observed with T2 spatial variation plots across the entire distance of the cartilage cap, with the most pronounced difference in the middle section of the cartilage.
CONCLUSION
Longer T2 relaxation times of the cartilage caps of osteochondromas should be considered as normal, and likely to reflect an increased water content, different microstructure and component.
MeSH Terms
Figure
-
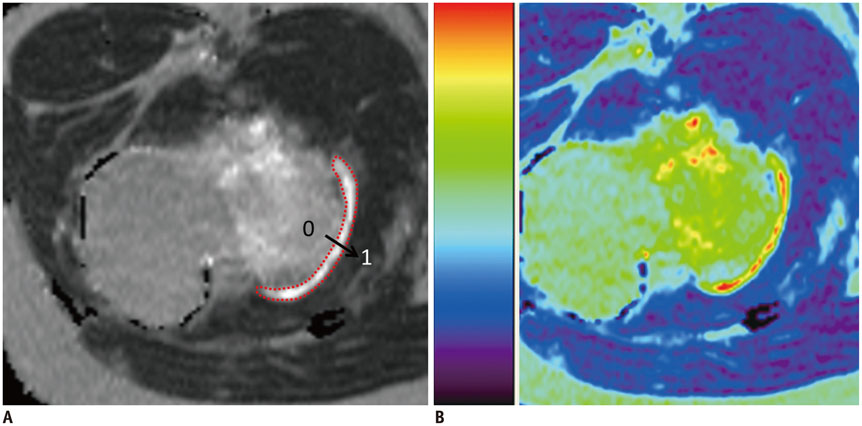
Fig. 1 T2 relaxation time mapping from 12-year-old boy with osteochondroma of femur. Gray scale map (A) and color-coded map (B) of distal femur. (A) Region of interest of cartilage cap was manually outlined on gray scale map. Mean T2 value of cartilage cap was 201.0 ± 35.4 msec, value of patellar cartilage was 40.4 ± 4.4 msec.

Fig. 2 9-year-old girl with osteochondroma of right proximal tibia (A, B) and 9-year-old girl in control group (C, D). A. Axial T2-weighted image with fat suppression demonstrates hyperintense signal of cartilage cap (arrows), which is similar to signal intensity of joint effusion of knee in age and gender matched control (C). C. Axial fast spin echo T2-weighted image with fat suppression demonstrates other forms of hyaline cartilage: unossified epiphyseal cartilage with low signal intensity (arrowheads), and articular cartilage with intermediate signal intensity (arrows). Axial color coded T2 maps of osteochondroma (B) and patellar cartilage (D) demonstrate different range of T2 relaxation times. Mean T2 values of cartilage cap in osteochondroma (172.8 ± 23.1 msec) were significantly longer than values (38.2 ± 5.2 msec) of patellar cartilage in control group.

Fig. 3 T2 spatial variation of cartilage cap obtained from 11 subjects with osteochondromas, and from patellar cartilage of age and gender matched controls. T2 relaxation times were significantly longer in cartilage caps across entire distance of cartilage (p < 0.0001). Difference is most prominent in middle portion of cartilage (at normalized distance between 0.4 and 0.8) where 0 represents osteochondral junction in osteochondroma and subchondral bone in patella; 1 represents external surface in osteochondroma and articular surface in patellar cartilage.
Reference
-
1. Giudici MA, Moser RP Jr, Kransdorf MJ. Cartilaginous bone tumors. Radiol Clin North Am. 1993; 31:237–259.2. Scarborough MT, Moreau G. Benign cartilage tumors. Orthop Clin North Am. 1996; 27:583–589.3. Murphey MD, Choi JJ, Kransdorf MJ, Flemming DJ, Gannon FH. Imaging of osteochondroma: variants and complications with radiologic-pathologic correlation. Radiographics. 2000; 20:1407–1434.4. Woertler K, Lindner N, Gosheger G, Brinkschmidt C, Heindel W. Osteochondroma: MR imaging of tumor-related complications. Eur Radiol. 2000; 10:832–840.5. Mosher TJ, Dardzinski BJ. Cartilage MRI T2 relaxation time mapping: overview and applications. Semin Musculoskelet Radiol. 2004; 8:355–368.6. Kim HK, Shiraj S, Anton CG, Horn PS, Dardzinski BJ. Age and sex dependency of cartilage T2 relaxation time mapping in MRI of children and adolescents. AJR Am J Roentgenol. 2014; 202:626–632.7. Kim HK, Laor T, Graham TB, Anton CG, Salisbury SR, Racadio JM, et al. T2 relaxation time changes in distal femoral articular cartilage in children with juvenile idiopathic arthritis: a 3-year longitudinal study. AJR Am J Roentgenol. 2010; 195:1021–1025.8. Dardzinski BJ, Laor T, Schmithorst VJ, Klosterman L, Graham TB. Mapping T2 relaxation time in the pediatric knee: feasibility with a clinical 1.5-T MR imaging system. Radiology. 2002; 225:233–239.9. Shiraj S, Kim HK, Anton C, Horn PS, Laor T. Spatial variation of T2 relaxation times of patellar cartilage and physeal patency: an in vivo study in children and young adults. AJR Am J Roentgenol. 2014; 202:W292–W297.10. Milgram JW. The origins of osteochondromas and enchondromas. A histopathologic study. Clin Orthop Relat Res. 1983; (174):264–284.11. Kitsoulis P, Galani V, Stefanaki K, Paraskevas G, Karatzias G, Agnantis NJ, et al. Osteochondromas: review of the clinical, radiological and pathological features. In Vivo. 2008; 22:633–646.12. Mirra JM. Benign cartilaginous exostoses: osteochondroma and osteochondromatosis. In : Mirra JM, editor. Bone tumors: clinical, radiologic, and pathologic correlations. Vol 2. Philadelphia, PA: Lea & Febiger;1989. p. 1626–1659.13. Maroudas A, Bullough P. Permeability of articular cartilage. Nature. 1968; 219:1260–1261.14. Maroudas A, Bullough P, Swanson SA, Freeman MA. The permeability of articular cartilage. J Bone Joint Surg Br. 1968; 50:166–177.15. Martel-Pelletier J, Boileau C, Pelletier JP, Roughley PJ. Cartilage in normal and osteoarthritis conditions. Best Pract Res Clin Rheumatol. 2008; 22:351–384.16. de Andrea CE, Wiweger M, Prins F, Bovée JV, Romeo S, Hogendoorn PC. Primary cilia organization reflects polarity in the growth plate and implies loss of polarity and mosaicism in osteochondroma. Lab Invest. 2010; 90:1091–1101.17. Huch K, Mordstein V, Stöve J, Nerlich AG, Amholdt H, Delling G, et al. Expression of collagen type I, II, X and Ki-67 in osteochondroma compared to human growth plate cartilage. Eur J Histochem. 2002; 46:249–258.18. Bernard SA, Murphey MD, Flemming DJ, Kransdorf MJ. Improved differentiation of benign osteochondromas from secondary chondrosarcomas with standardized measurement of cartilage cap at CT and MR imaging. Radiology. 2010; 255:857–865.
- Full Text Links
-
- Actions
-
Cited
- CITED
-
- Close
- Share
-
- Similar articles
-
- Quantitative Analysis of Disc Degeneration Using Axial T2 Mapping in a Percutaneous Annular Puncture Model in Rabbits
- Quantitative T2 Mapping of Articular Cartilage of the Glenohumeral Joint at 3.0T in Rotator Cuff Disease Patients: the Evaluation of Degenerative Change of Cartilage
- Clinical Usefulness of T2 Relaxometry in Temporal Lobe Epilepsy
- Quantitative Assessment of the T2 Relaxation Time of the Gluteus Muscles in Children with Duchenne Muscular Dystrophy: a Comparative Study Before and After Steroid Treatment
- Phantom-Validated Reference Values of Myocardial Mapping and Extracellular Volume at 3T in Healthy Koreans
