Quantitative Assessment of the T2 Relaxation Time of the Gluteus Muscles in Children with Duchenne Muscular Dystrophy: a Comparative Study Before and After Steroid Treatment
- Affiliations
-
- 1Department of Radiology, Cincinnati Children's Hospital Medical Center, Cincinnati, Ohio 45229-3039, USA. Hee.Kim@cchmc.org
- 2Department of Mathematical Sciences, University of Cincinnati, Cincinnati, Ohio 45221-0025, USA.
- 3Department of Neurology, Cincinnati Children's Hospital Medical Center, Cincinnati, Ohio 45229-3039, USA.
- KMID: 946270
- DOI: http://doi.org/10.3348/kjr.2010.11.3.304
Abstract
OBJECTIVE
To determine the feasibility of using T2 mapping as a quantitative method to longitudinally follow the disease activity in children with Duchenne muscular dystrophy (DMD) who are treated with steroids. MATERIALS AND METHODS: Eleven boys with DMD (age range: 5-14 years) underwent evaluation with the clinical functional score (CFS), and conventional pelvic MRI and T2 mapping before and during steroid therapy. The gluteus muscle inflammation and fatty infiltration were evaluated on conventional MRI. The histograms and mean T2 relaxation times were obtained from the T2 maps. The CFS, the conventional MRI findings and the T2 values were compared before and during steroid therapy. RESULTS: None of the patients showed interval change of their CFSs. On conventional MRI, none of the images showed muscle inflammation. During steroid treatment, two boys showed increased fatty infiltration on conventional MRI, and both had an increase of the mean T2 relaxation time (p < 0.05). The remaining nine boys had no increase in fatty infiltration. Of these, three showed an increased mean T2 relaxation time (p < 0.05), two showed no change and four showed a decreased mean T2 relaxation time (p < 0.05). CONCLUSION: T2 mapping is a feasible technique to evaluate the longitudinal muscle changes in those children who receive steroid therapy for DMD. The differences of the mean T2 relaxation time may reflect alterations in disease activity, and even when the conventional MRI and CFS remain stable.
MeSH Terms
-
Adolescent
Anti-Inflammatory Agents/therapeutic use
Buttocks
Child
Child, Preschool
Feasibility Studies
Follow-Up Studies
Humans
Longitudinal Studies
Magnetic Resonance Imaging/*methods
Male
Muscle Strength/drug effects
Muscle, Skeletal/*drug effects/*physiopathology
Muscular Dystrophy, Duchenne/*drug therapy/*physiopathology
Observer Variation
Pregnenediones/therapeutic use
Prospective Studies
Figure
-

Fig. 1 Summary of changes on conventional MRI, T2 relaxation mapping and clinical functional score for study group.
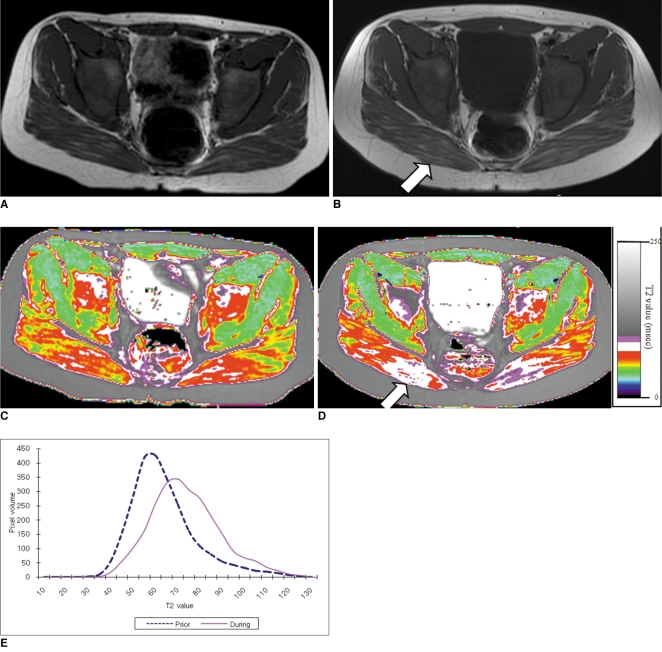
Fig. 2 9-year-old boy with Duchenne muscular dystrophy. Conventional MRI and T2 maps obtained prior to and during 12-month course of steroid therapy.A. Axial T1 weighted image (TR/TE 550/14) shows very minimal fatty infiltration within gluteus maximus muscle. Clinical functional score was assessed as 1 (normal).B. Follow-up axial T1 weighted image (TR/TE 600/14) shows minimal increase of fatty infiltration (arrow) within gluteus maximus muscle. Clinical functional score was assessed as 1 (normal).C, D. Color coded T2 map shows color change to higher scale color (from red to white) within gluteal muscles (arrow in D).E. Histogram demonstrates statistically different distribution between two time points. Mean T2 value for this patient increased (from 71.2 msec on initial study to 77.3 msec on follow-up study).
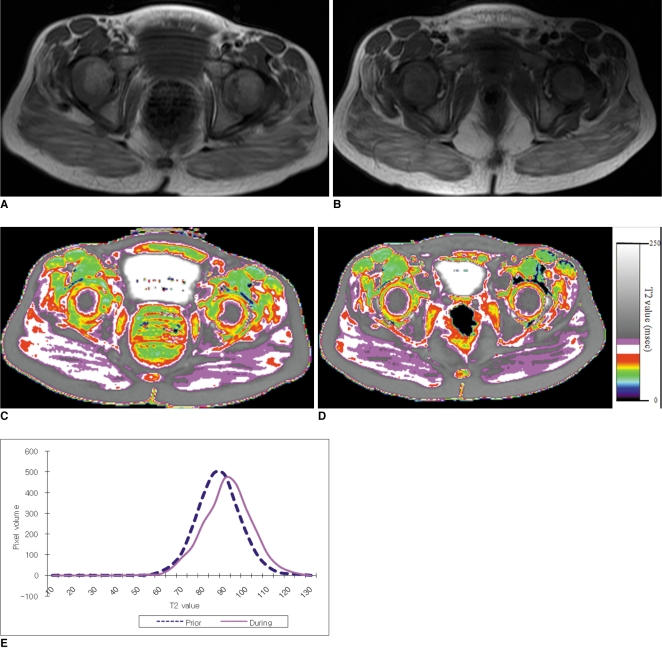
Fig. 3 5-year and 2-month-old boy with Duchenne muscular dystrophy. Conventional MRI and T2 maps obtained prior to and during 18-month course of steroid therapy.A. Axial T1 weighted image (TR/TE 517/22) shows mild fatty infiltration within gluteus maximus muscle. Clinical function score was assessed as 1 (normal).B. Follow-up axial T1 weighted image (TR/TE 517/14) shows no interval change of fatty infiltration within gluteus maximus muscle. Clinical functional score was assessed as 1 (normal).C, D. Color coded T2 map shows color change to higher scale color (from white to violet) within gluteal muscles.E. Histogram demonstrates statistically different distribution between two time points. Mean T2 value for this patient increased (from 87.2 msec on initial study to 91.3 msec on follow-up study).
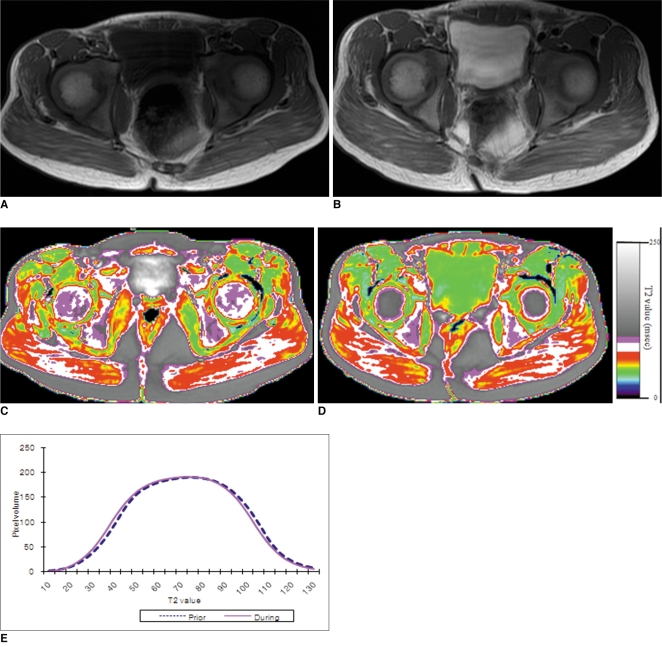
Fig. 4 75-month-old boy with Duchenne muscular dystrophy. Conventional MRI and T2 maps obtained prior to and during 12-month course of steroid therapy.A. Axial T1 weighted image (TR/TE 517/14) shows very minimal fatty infiltration within gluteus maximus muscle. Clinical function score was assessed as 1 (normal).B. Follow-up axial T1 weighted image (TR/TE 650/14) shows no interval change of fatty infiltration within gluteus maximus muscle. Clinical functional score was assessed as 1 (normal). Hyperintense T1 signal within bladder is from intravenous MRI contrast agent, which was administrated for cardiac study that was performed previously on same date.C, D. Color coded T2 map shows no color change within gluteal muscles between initial (C), and follow-up (D) examinations.E. Histogram demonstrates no statistically significant difference in distribution between two time points. Mean T2 value for this patient decreased slightly, but change was not statistically significant (from 72.4 msec on initial study to 71.1 msec on follow-up study, p value > 0.05).
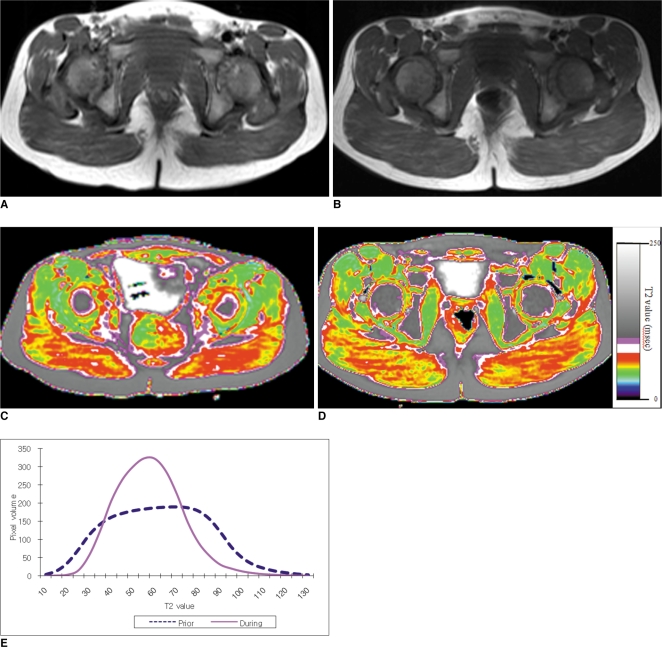
Fig. 5 5-year-old boy with Duchenne muscular dystrophy. Conventional MRI and T2 maps obtained prior to and during 16-month course of steroid therapy.A. Axial T1 weighted image (TR/TE 600/23) shows very minimal fatty infiltration within gluteus maximus muscle. Clinical function score was assessed as 1 (normal).B. Follow-up axial T1 weighted image (TR/TE 517/14) shows no significant interval change of fatty infiltration within gluteus maximus muscle. Clinical functional score was assessed as 1 (normal).C, D. Color coded T2 map shows color change from higher scale color (red) (C) to lower scale color (yellow) within gluteal muscles (D).E. Histogram demonstrates statistically significant different distribution between two time points. Mean T2 value for this patient decreased (from 62.1 msec on initial study to 57.4 msec on follow-up study).
Reference
-
1. Sarnat HB. Kliegman R, editor. Neuromuscular disorder. Nelson textbook of pediatrics. 2007. Philadelphia: Saunders;p. 1680–1696.2. Strober JB. Therapeutics in duchenne muscular dystrophy. NeuroRx. 2006; 3:225–234. PMID: 16554260.
Article3. Chen YW, Nagaraju K, Bakay M, McIntyre O, Rawat R, Shi R, et al. Early onset of inflammation and later involvement of TGFbeta in Duchenne muscular dystrophy. Neurology. 2005; 65:826–834. PMID: 16093456.4. Burrow KL, Coovert DD, Klein CJ, Bulman DE, Kissel JT, Rammohan KW, et al. CIDD Study Group. Dystrophin expression and somatic reversion in prednisone-treated and untreated Duchenne dystrophy. Neurology. 1991; 41:661–666. PMID: 1781820.
Article5. Swinyard CA, Deaver GG, Greenspan L. Gradients of functional ability of importance in rehabilitation of patients with progressive muscular and neuromuscular diseases. Arch Phys Med Rehabil. 1957; 38:574–579. PMID: 13459572.6. Brooke MH, Fenichel GM, Griggs RC, Mendell JR, Moxley R, Miller JP. Clinical investigation in Duchenne dystrophy: 2. Determination of the "power" of therapeutic trials based on the natural history. Muscle Nerve. 1983; 6:91–103. PMID: 6343858.
Article7. Sookhoo S, Mackinnon I, Bushby K, Chinnery PF, Birchall D. MRI for the demonstration of subclinical muscle involvement in muscular dystrophy. Clin Radiol. 2007; 62:160–165. PMID: 17207699.
Article8. Stern LM, Caudrey DJ, Perrett LV, Boldt DW. Progression of muscular dystrophy assessed by computed tomography. Dev Med Child Neurol. 1984; 26:569–573. PMID: 6510558.
Article9. Liu GC, Jong YJ, Chiang CH, Jaw TS. Duchenne muscular dystrophy: MR grading system with functional correlation. Radiology. 1993; 186:475–480. PMID: 8421754.
Article10. Kight AC, Dardzinski BJ, Laor T, Graham TB. Magnetic resonance imaging evaluation of the effects of juvenile rheumatoid arthritis on distal femoral weight-bearing cartilage. Arthritis Rheum. 2004; 50:901–905. PMID: 15022333.
Article11. Dunn TC, Lu Y, Jin H, Ries MD, Majumdar S. T2 relaxation time of cartilage at MR imaging: comparison with severity of knee osteoarthritis. Radiology. 2004; 232:592–598. PMID: 15215540.
Article12. Huang Y, Majumdar S, Genant HK, Chan WP, Sharma KR, Yu P, et al. Quantitative MR relaxometry study of muscle composition and function in Duchenne muscular dystrophy. J Magn Reson Imaging. 1994; 4:59–64. PMID: 8148557.
Article13. Maillard SM, Jones R, Owens C, Pilkington C, Woo P, Wedderburn LR, et al. Quantitative assessment of MRI T2 relaxation time of thigh muscles in juvenile dermatomyositis. Rheumatology (Oxford). 2004; 43:603–608. PMID: 14983103.
Article14. Patten C, Meyer RA, Fleckenstein JL. T2 mapping of muscle. Semin Musculoskelet Radiol. 2003; 7:297–305. PMID: 14735428.15. Mercuri E, Pichiecchio A, Allsop J, Messina S, Pane M, Muntoni F. Muscle MRI in inherited neuromuscular disorders: past, present, and future. J Magn Reson Imaging. 2007; 25:433–440. PMID: 17260395.
Article16. Muntoni F, Fisher I, Morgan JE, Abraham D. Steroids in Duchenne muscular dystrophy: from clinical trials to genomic research. Neuromuscul Disord. 2002; 12:S162–S165. PMID: 12206811.
Article17. Weller B, Massa R, Karpati G, Carpenter S. Glucocorticoids and immunosuppressants do not change the prevalence of necrosis and regeneration in mdx skeletal muscles. Muscle Nerve. 1991; 14:771–774. PMID: 1891001.18. Davies KE. Challenges in Duchenne muscular dystrophy. Neuromuscul Disord. 1997; 7:482–486. PMID: 9447604.19. Kissel JT, Burrow KL, Rammohan KW, Mendell JR. CIDD Study Group. Mononuclear cell analysis of muscle biopsies in prednisone-treated and untreated Duchenne muscular dystrophy. Neurology. 1991; 41:667–672. PMID: 2027481.
Article20. Phoenix J, Betal D, Roberts N, Helliwell TR, Edwards RH. Objective quantification of muscle and fat in human dystrophic muscle by magnetic resonance image analysis. Muscle Nerve. 1996; 19:302–310. PMID: 8606693.
Article21. DeSilva S, Drachman DB, Mellits D, Kuncl RW. Prednisone treatment in Duchenne muscular dystrophy. Long-term benefit. Arch Neurol. 1987; 44:818–882. PMID: 3632394.
- Full Text Links
-
- Actions
-
Cited
- CITED
-
- Close
- Share
-
- Similar articles
-
- A clinical study on Duchenne muscular dystrophy
- Duchenne Muscular Dystrophy Complicated With Dilated Cardiomyopathy and Cerebral Infarction
- Duchenne Type Muscular Dystrophy: Report of 8 Cases
- A Clinical Study on Duchenne Muscular Dystrophy in Childhood
- Ultrasound Findings in Duchenne Muscular Dystrophy Disease
