Systematic Review and Meta-Analysis of Studies Evaluating Diagnostic Test Accuracy: A Practical Review for Clinical Researchers-Part I. General Guidance and Tips
- Affiliations
-
- 1Department of Radiology and Research Institute of Radiology, University of Ulsan College of Medicine, Asan Medical Center, Seoul 05505, Korea. parksh.radiology@gmail.com
- 2Department of Biostatistics, Korea University College of Medicine, Seoul 02841, Korea.
- KMID: 2344271
- DOI: http://doi.org/10.3348/kjr.2015.16.6.1175
Abstract
- In the field of diagnostic test accuracy (DTA), the use of systematic review and meta-analyses is steadily increasing. By means of objective evaluation of all available primary studies, these two processes generate an evidence-based systematic summary regarding a specific research topic. The methodology for systematic review and meta-analysis in DTA studies differs from that in therapeutic/interventional studies, and its content is still evolving. Here we review the overall process from a practical standpoint, which may serve as a reference for those who implement these methods.
Figure
-
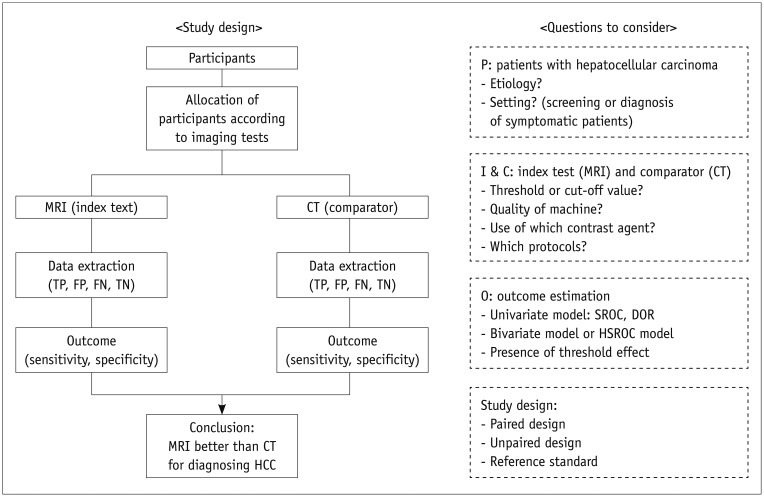
Fig. 1 Diagram of study process and frame of research questions.DOR = diagnostic odds ratio, FN = false negative, FP = false positive, HCC = hepatocellular carcinoma, HSROC = hierarchical summary receiver operating characteristic, SROC = summary receiver operating characteristic, TN = true negative, TP = true positive
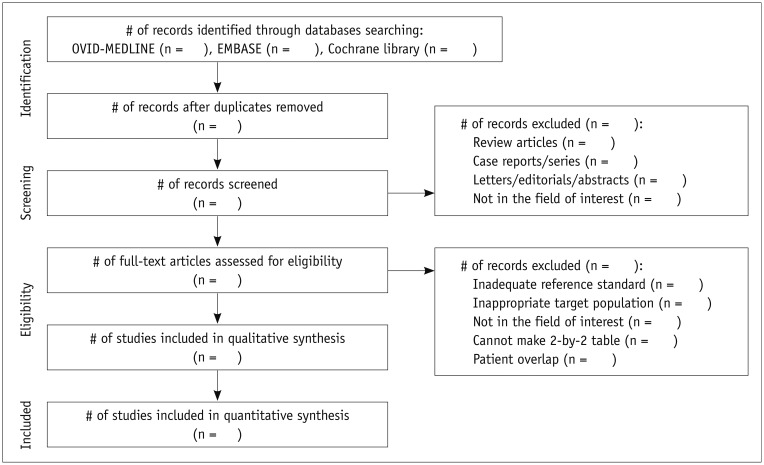
Fig. 2 Process to select literature according to Preferred Reporting Items of Systematic Reviews and Meta-Analyses guideline.
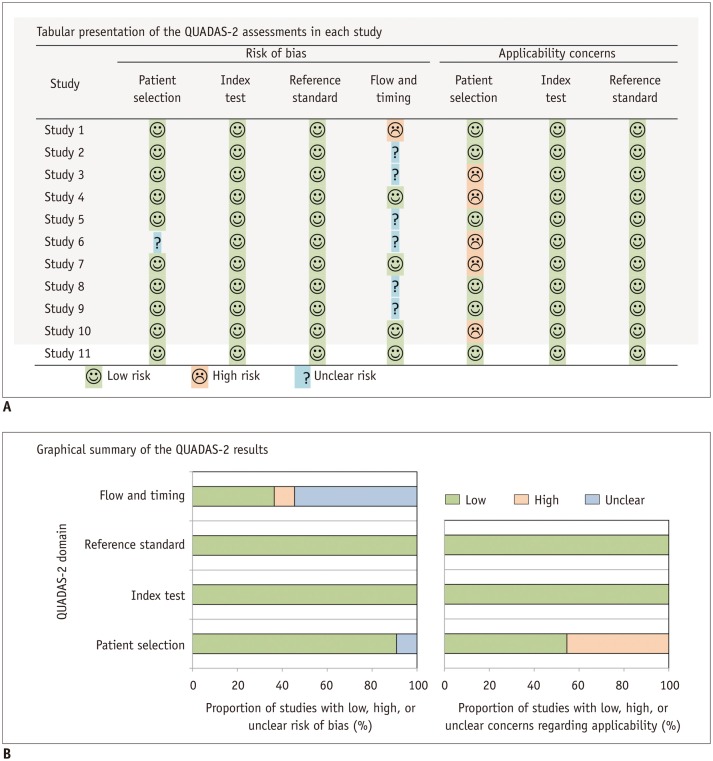
Fig. 3 Templates for presenting results of QUADAS-2 assessment for assessing quality of studies.We can present results of QUADAS-2 assessments in tabular form (A) or in graphics (B). QUADAS = Quality Assessment of Diagnostic Accuracy Studies
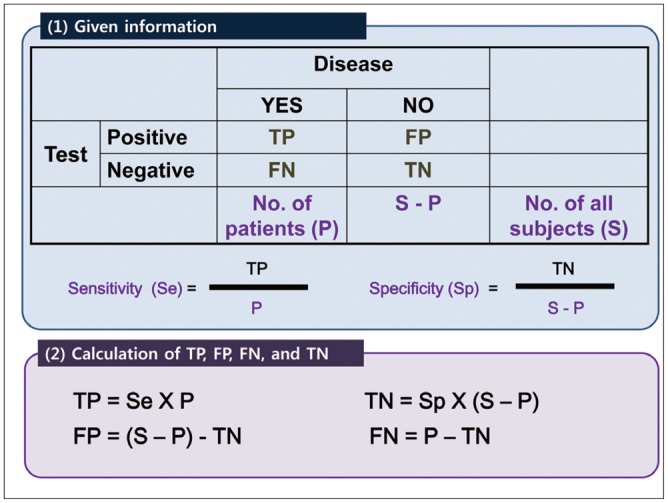
Fig. 4 Description of reconstructing diagnostic 2-by-2 table.FN = false negative, FP = false positive, TN = true negative, TP = true positive
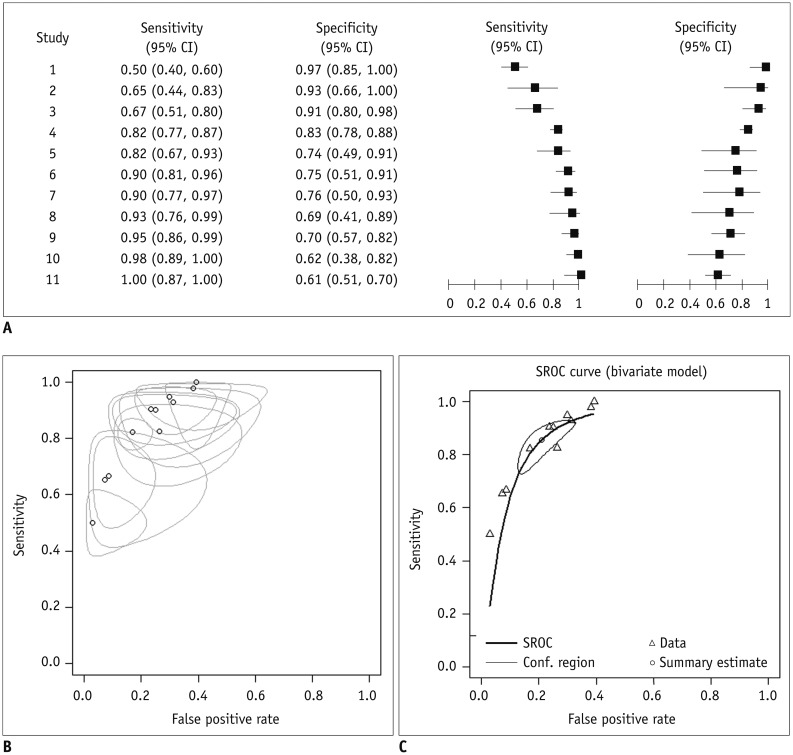
Fig. 5 Graphs used in meta-analysis of diagnostic test accuracy studies.A. Coupled forest plots. B. Summary receiver operating curve (SROC) plot. Open circle (o) represents false positive rate (x-coordinate) and sensitivity (y-coordinate) of individual studies. Size of bubbles reflects precision of estimate. C. SROC curve. CI = confidence interval
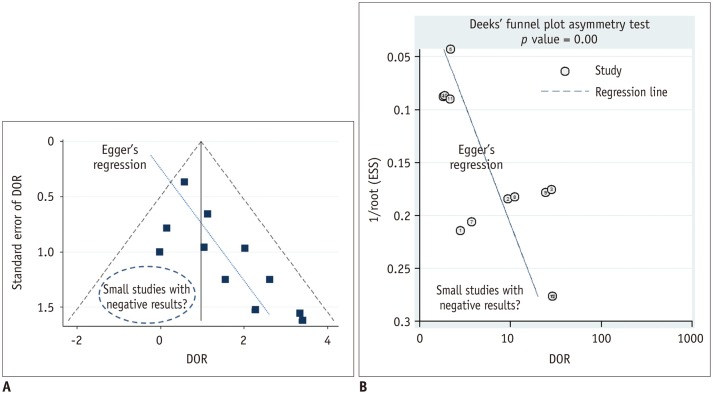
Fig. 6 Funnel plot to assess publication bias.A. Funnel plot with Egger's regression line. Each dot represents primary study. X-axis shows study result (i.e., diagnostic odds ratio [DOR]) and y-axis represents study size (i.e., standard error of study result). Empty region, to be filled with results of relatively small studies with negative results or small effect size, makes plot asymmetrical. Asymmetry of plot would indicate that such studies may not ever have been published, thus raising possibility of publication bias being presented as review result. B. Deeks funnel plot. In Deeks funnel plot, x-axis is natural logarithm of DOR and y-axis is 1/√ effective sample size (ESS). According to Deeks et al. (35), it is preferred method for meta-analysis of diagnostic test accuracy studies owing to its high statistical power.
Cited by 3 articles
-
Technical Performance of Two-Dimensional Shear Wave Elastography for Measuring Liver Stiffness: A Systematic Review and Meta-Analysis
Dong Wook Kim, Chong Hyun Suh, Kyung Won Kim, Junhee Pyo, Chan Park, Seung Chai Jung
Korean J Radiol. 2019;20(6):880-893. doi: 10.3348/kjr.2018.0812.Cardiac CT for Measurement of Right Ventricular Volume and Function in Comparison with Cardiac MRI: A Meta-Analysis
Jin Young Kim, Young Joo Suh, Kyunghwa Han, Young Jin Kim, Byoung Wook Choi
Korean J Radiol. 2020;21(4):450-461. doi: 10.3348/kjr.2019.0499.Diagnostic Performance of Ultrasound-Based Risk Stratification Systems for Thyroid Nodules: A Systematic Review and Meta-Analysis
Leehi Joo, Min Kyoung Lee, Ji Ye Lee, Eun Ju Ha, Dong Gyu Na
Endocrinol Metab. 2023;38(1):117-128. doi: 10.3803/EnM.2023.1670.
Reference
-
1. Macaskill P, Gatsonis C, Deeks JJ, Harbord RM, Takwoingi Y. Chapter 10: Analysing and Presenting Results. In : Deeks JJ, Bossuyt PM, Gatsonis C, editors. The Cochrane Collaboration. Cochrane Handbook for Systematic Reviews of Diagnostic Test Accuracy Version 1.0. 2010. Available from: http://srdta.cochrane.org/.2. Tunis AS, McInnes MD, Hanna R, Esmail K. Association of study quality with completeness of reporting: have completeness of reporting and quality of systematic reviews and meta-analyses in major radiology journals changed since publication of the PRISMA statement? Radiology. 2013; 269:413–426. PMID: 23824992.
Article3. Irwig L, Tosteson AN, Gatsonis C, Lau J, Colditz G, Chalmers TC, et al. Guidelines for meta-analyses evaluating diagnostic tests. Ann Intern Med. 1994; 120:667–676. PMID: 8135452.
Article4. Trikalinos TA, Balion CM, Coleman CI, Griffith L, Santaguida PL, Vandermeer B, et al. Chapter 8: meta-analysis of test performance when there is a "gold standard". J Gen Intern Med. 2012; 27(Suppl 1):S56–S66. PMID: 22648676.
Article5. Lee J, Kim KW, Choi SH, Huh J, Park SH. Systematic review and meta-analysis of studies evaluating diagnostic test accuracy: a practical review for clinical researchers--part ii. statistical methods of meta-analysis. Korean J Radiol. 2015; 16:1188–1196.
Article6. Jaeschke R, Guyatt GH, Sackett DL. The Evidence-Based Medicine Working Group. Users' guides to the medical literature. III. How to use an article about a diagnostic test. B. What are the results and will they help me in caring for my patients? JAMA. 1994; 271:703–707. PMID: 8309035.7. Lee YJ, Lee JM, Lee JS, Lee HY, Park BH, Kim YH, et al. Hepatocellular carcinoma: diagnostic performance of multidetector CT and MR imaging-a systematic review and meta-analysis. Radiology. 2015; 275:97–109. PMID: 25559230.
Article8. Moher D, Shamseer L, Clarke M, Ghersi D, Liberati A, Petticrew M, et al. Preferred reporting items for systematic review and meta-analysis protocols (PRISMA-P) 2015 statement. Syst Rev. 2015; 4:1. PMID: 25554246.
Article9. Shea BJ, Grimshaw JM, Wells GA, Boers M, Andersson N, Hamel C, et al. Development of AMSTAR: a measurement tool to assess the methodological quality of systematic reviews. BMC Med Res Methodol. 2007; 7:10. PMID: 17302989.
Article10. Sampson M, Barrowman NJ, Moher D, Klassen TP, Pham B, Platt R, et al. Should meta-analysts search Embase in addition to Medline? J Clin Epidemiol. 2003; 56:943–955. PMID: 14568625.
Article11. Staunton M. Evidence-based radiology: steps 1 and 2--asking answerable questions and searching for evidence. Radiology. 2007; 242:23–31. PMID: 17185659.
Article12. Moher D, Liberati A, Tetzlaff J, Altman DG. the PRISMA statement. Preferred reporting items for systematic reviews and meta-analyses: the PRISMA statement. Ann Intern Med. 2009; 151:264–269. W64. PMID: 19622511.
Article13. Jones CM, Ashrafian H, Darzi A, Athanasiou T. Guidelines for diagnostic tests and diagnostic accuracy in surgical research. J Invest Surg. 2010; 23:57–65. PMID: 20233006.
Article14. Whiting P, Rutjes AW, Reitsma JB, Glas AS, Bossuyt PM, Kleijnen J. Sources of variation and bias in studies of diagnostic accuracy: a systematic review. Ann Intern Med. 2004; 140:189–202. PMID: 14757617.15. Dodd JD. Evidence-based practice in radiology: steps 3 and 4--appraise and apply diagnostic radiology literature. Radiology. 2007; 242:342–354. PMID: 17255406.
Article18. Whiting P, Rutjes AW, Reitsma JB, Bossuyt PM, Kleijnen J. The development of QUADAS: a tool for the quality assessment of studies of diagnostic accuracy included in systematic reviews. BMC Med Res Methodol. 2003; 3:25. PMID: 14606960.
Article19. Whiting PF, Rutjes AW, Westwood ME, Mallett S, Deeks JJ, Reitsma JB, et al. QUADAS-2: a revised tool for the quality assessment of diagnostic accuracy studies. Ann Intern Med. 2011; 155:529–536. PMID: 22007046.
Article20. Wade R, Corbett M, Eastwood A. Quality assessment of comparative diagnostic accuracy studies: our experience using a modified version of the QUADAS-2 tool. Res Synth Methods. 2013; 4:280–286. PMID: 26053845.
Article21. Leeflang MM, Deeks JJ, Gatsonis C, Bossuyt PM. Cochrane Diagnostic Test Accuracy Working Group. Systematic reviews of diagnostic test accuracy. Ann Intern Med. 2008; 149:889–897. PMID: 19075208.
Article22. Reitsma JB, Glas AS, Rutjes AW, Scholten RJ, Bossuyt PM, Zwinderman AH. Bivariate analysis of sensitivity and specificity produces informative summary measures in diagnostic reviews. J Clin Epidemiol. 2005; 58:982–990. PMID: 16168343.
Article23. Halligan S, Altman DG. Evidence-based practice in radiology: steps 3 and 4--appraise and apply systematic reviews and meta-analyses. Radiology. 2007; 243:13–27. PMID: 17392245.
Article24. Deeks JJ. Systematic reviews in health care: systematic reviews of evaluations of diagnostic and screening tests. BMJ. 2001; 323:157–162. PMID: 11463691.
Article25. Devillé WL, Buntinx F, Bouter LM, Montori VM, de Vet HC, van der Windt DA, et al. Conducting systematic reviews of diagnostic studies: didactic guidelines. BMC Med Res Methodol. 2002; 2:9. PMID: 12097142.
Article26. Chappell FM, Raab GM, Wardlaw JM. When are summary ROC curves appropriate for diagnostic meta-analyses? Stat Med. 2009; 28:2653–2668. PMID: 19591118.
Article27. Higgins JP, Thompson SG, Deeks JJ, Altman DG. Measuring inconsistency in meta-analyses. BMJ. 2003; 327:557–560. PMID: 12958120.
Article28. Song F, Eastwood AJ, Gilbody S, Duley L, Sutton AJ. Publication and related biases. Health Technol Assess. 2000; 4:1–115.
Article29. Tatsioni A, Zarin DA, Aronson N, Samson DJ, Flamm CR, Schmid C, et al. Challenges in systematic reviews of diagnostic technologies. Ann Intern Med. 2005; 142(12 Pt 2):1048–1055. PMID: 15968029.
Article30. Mulherin SA, Miller WC. Spectrum bias or spectrum effect? Subgroup variation in diagnostic test evaluation. Ann Intern Med. 2002; 137:598–602. PMID: 12353947.
Article31. de Groot JA, Dendukuri N, Janssen KJ, Reitsma JB, Brophy J, Joseph L, et al. Adjusting for partial verification or workup bias in meta-analyses of diagnostic accuracy studies. Am J Epidemiol. 2012; 175:847–853. PMID: 22422923.
Article32. Leeflang MM, Moons KG, Reitsma JB, Zwinderman AH. Bias in sensitivity and specificity caused by data-driven selection of optimal cutoff values: mechanisms, magnitude, and solutions. Clin Chem. 2008; 54:729–737. PMID: 18258670.
Article33. Ewald B. Post hoc choice of cut points introduced bias to diagnostic research. J Clin Epidemiol. 2006; 59:798–801. PMID: 16828672.
Article
- Full Text Links
-
- Actions
-
Cited
- CITED
-
- Close
- Share
-
- Similar articles
-
- Systematic Review and Meta-Analysis of Studies Evaluating Diagnostic Test Accuracy: A Practical Review for Clinical Researchers-Part II. Statistical Methods of Meta-Analysis
- Overview of the Process of Conducting Meta-analyses of the Diagnostic Test Accuracy
- An overview of systematic reviews of diagnostic tests accuracy
- Meta-Analysis of Diagnostic Test Accuracy
- Meta-analysis of diagnostic test accuracy studies with multiple thresholds for data integration
