Overview of the Process of Conducting Meta-analyses of the Diagnostic Test Accuracy
- Affiliations
-
- 1Department of Rheumatology, Korea University College of Medicine, Seoul, Korea. lyhcgh@korea.ac.kr
- KMID: 2405015
- DOI: http://doi.org/10.4078/jrd.2018.25.1.3
Abstract
- Diagnosis is a critical step for clinical treatment. Many individual studies have been conducted to determine the accuracy of various diagnostic tests, but they had small sample sizes and correspondingly inadequate statistical strength. Combining the results from several such studies can help increase the statistical strength and precision of their results. Meta-analysis is a useful tool for evaluating the accuracy of diagnostic tests and can be used to obtain precise estimates when multiple small studies for a given test and subject pool are available. The need for meta-analysis on studies examining diagnostic test accuracy has increased noticeably, and more meta-analyses on diagnostic test accuracy studies are being published. A meta-analysis of diagnostic test accuracy studies differs from a typical meta-analysis because diagnostic test accuracy studies report a pair of statistics, such as sensitivity and specificity, rather than a single statistic. Therefore, meta-analyses of the diagnostic test accuracy need to deal with two summary statistics simultaneously. More complex statistical methods are required for conducting meta-analyses using diagnostic test accuracy studies compared to that required for conventional meta-analysis. This is because the sensitivity and specificity are generally inversely correlated due to a threshold effect, and there is considerable heterogeneity in the results of test accuracy studies. This review provides an overview of the process of meta-analysis of the diagnostic test accuracy.
Keyword
MeSH Terms
Figure
-
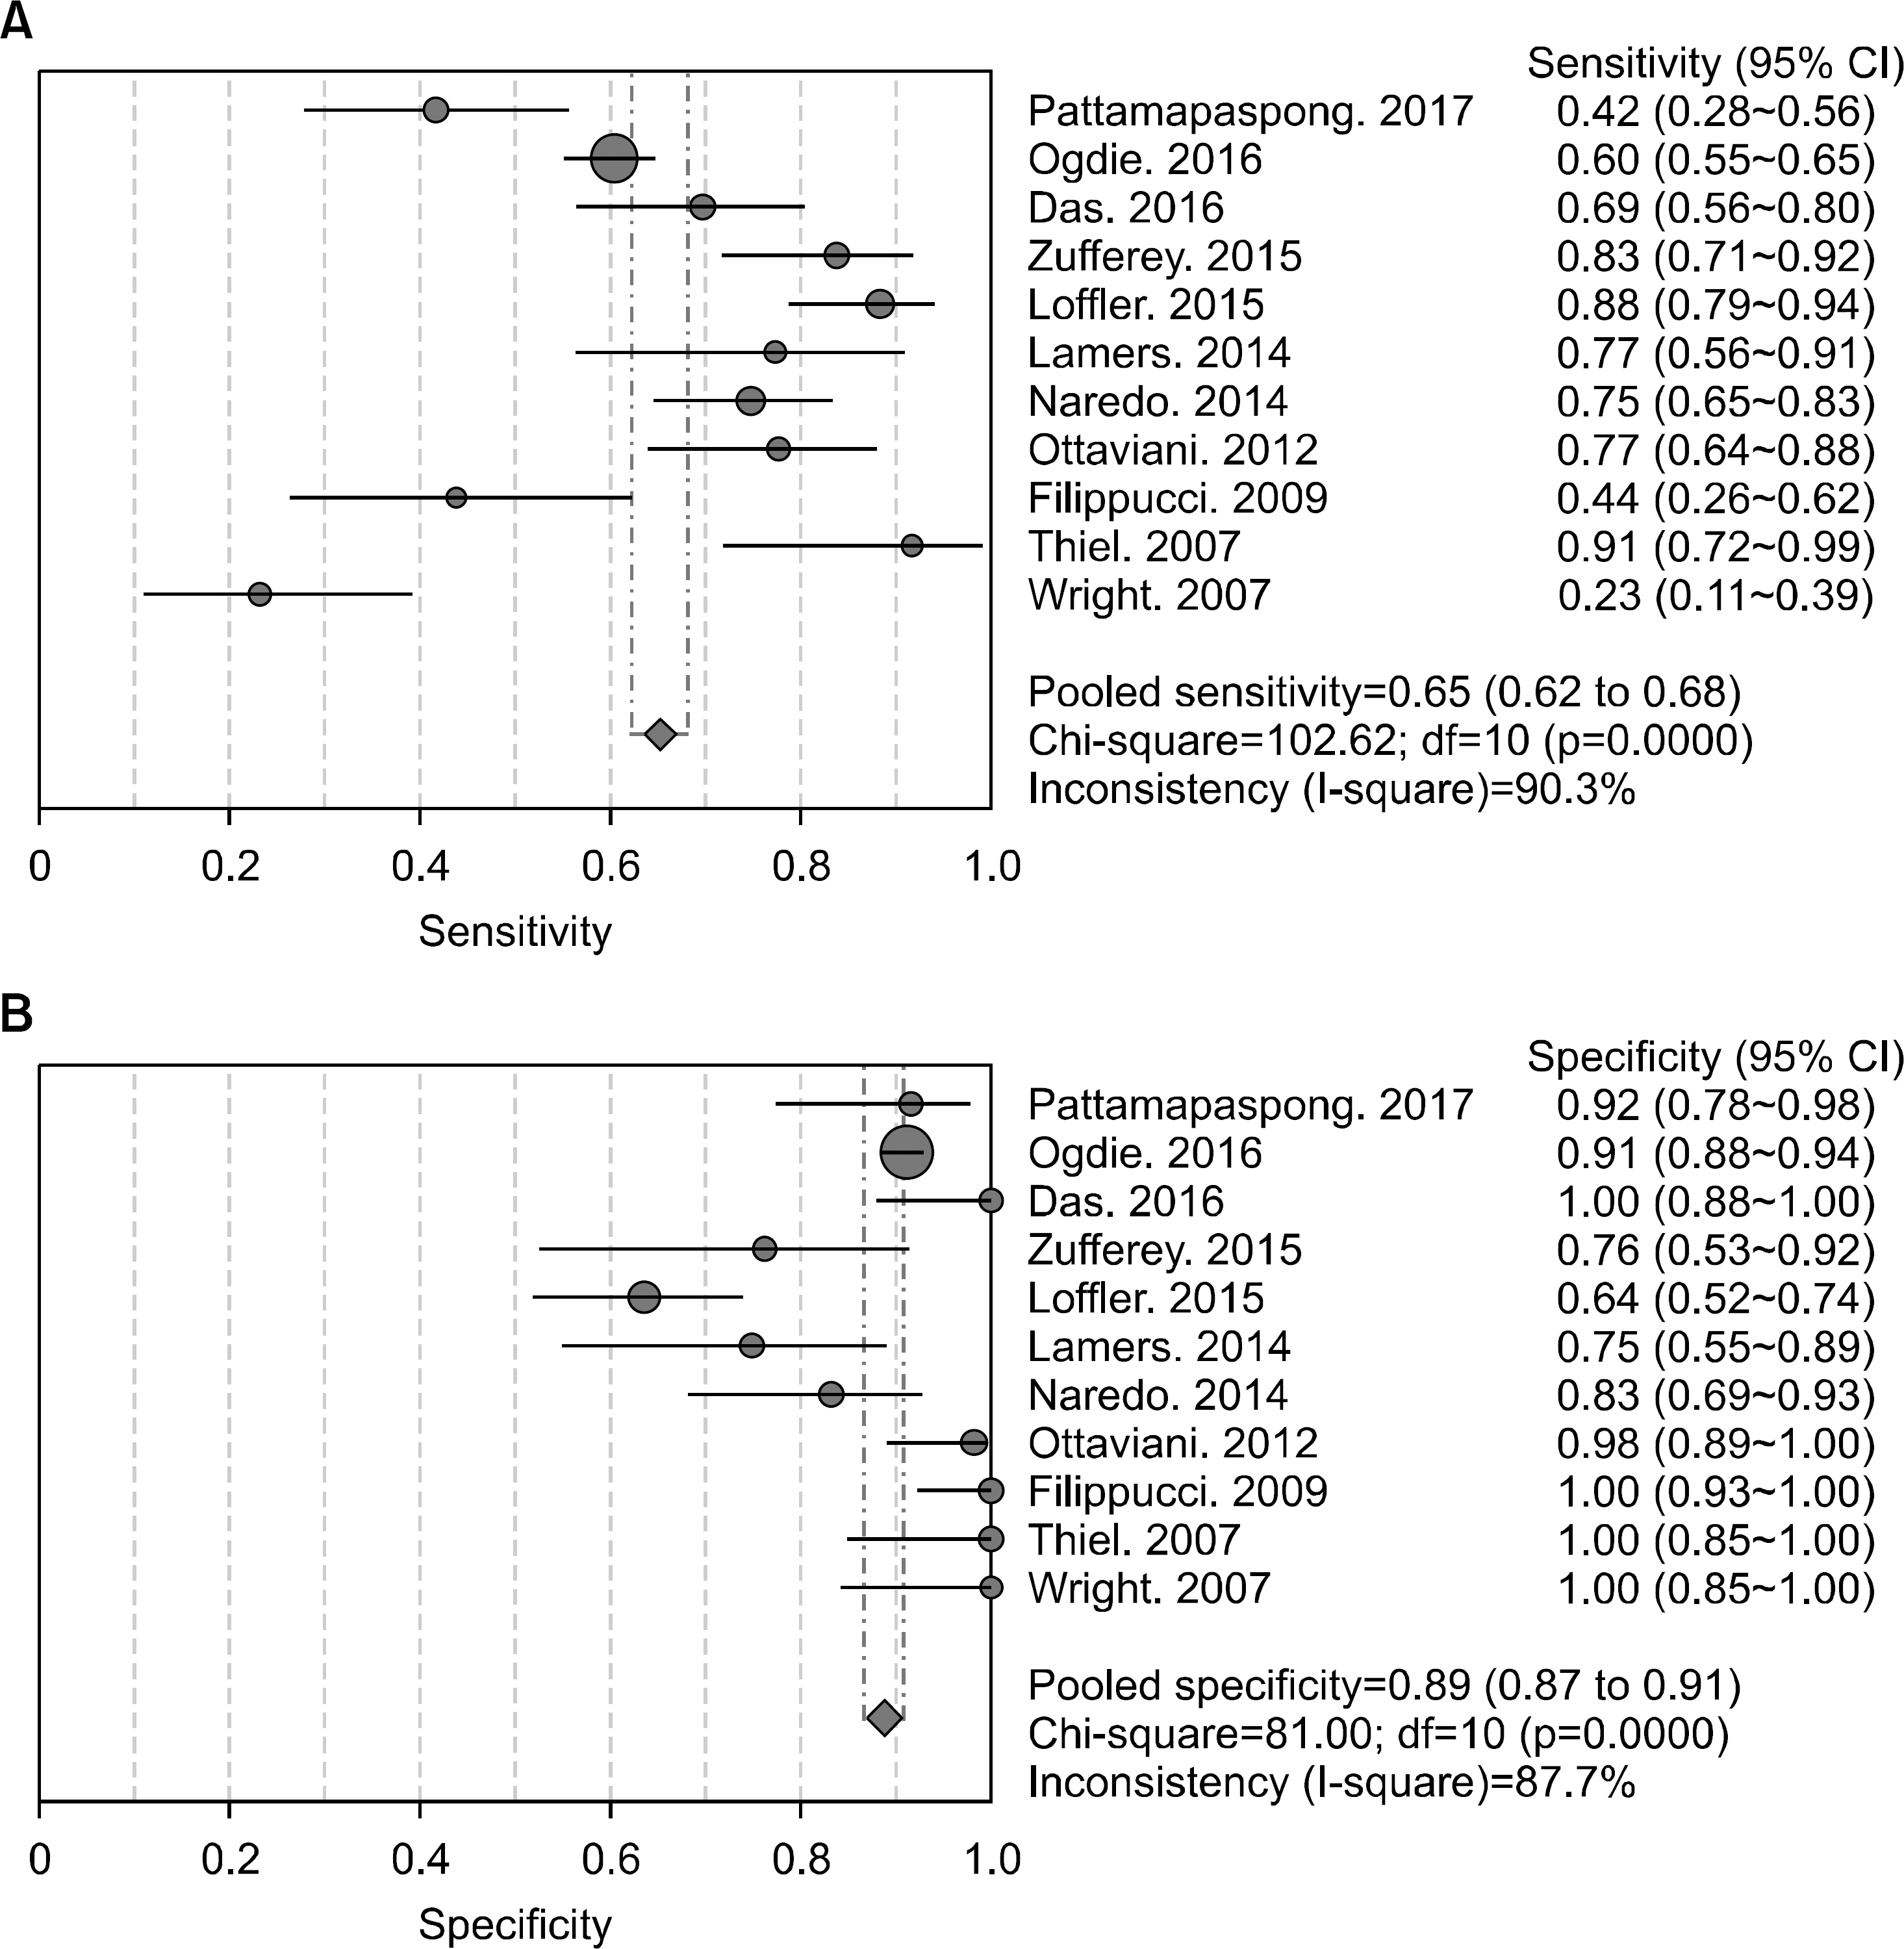
Figure 1. (A) Sensitivity and (B) specificity estimates for ultrasound used for the diagnosis of gout. Circles and lines represent point estimates and 95% confidence intervals (CI), respectively. Circled areas represent relative study sizes. Df: degrees of freedom.
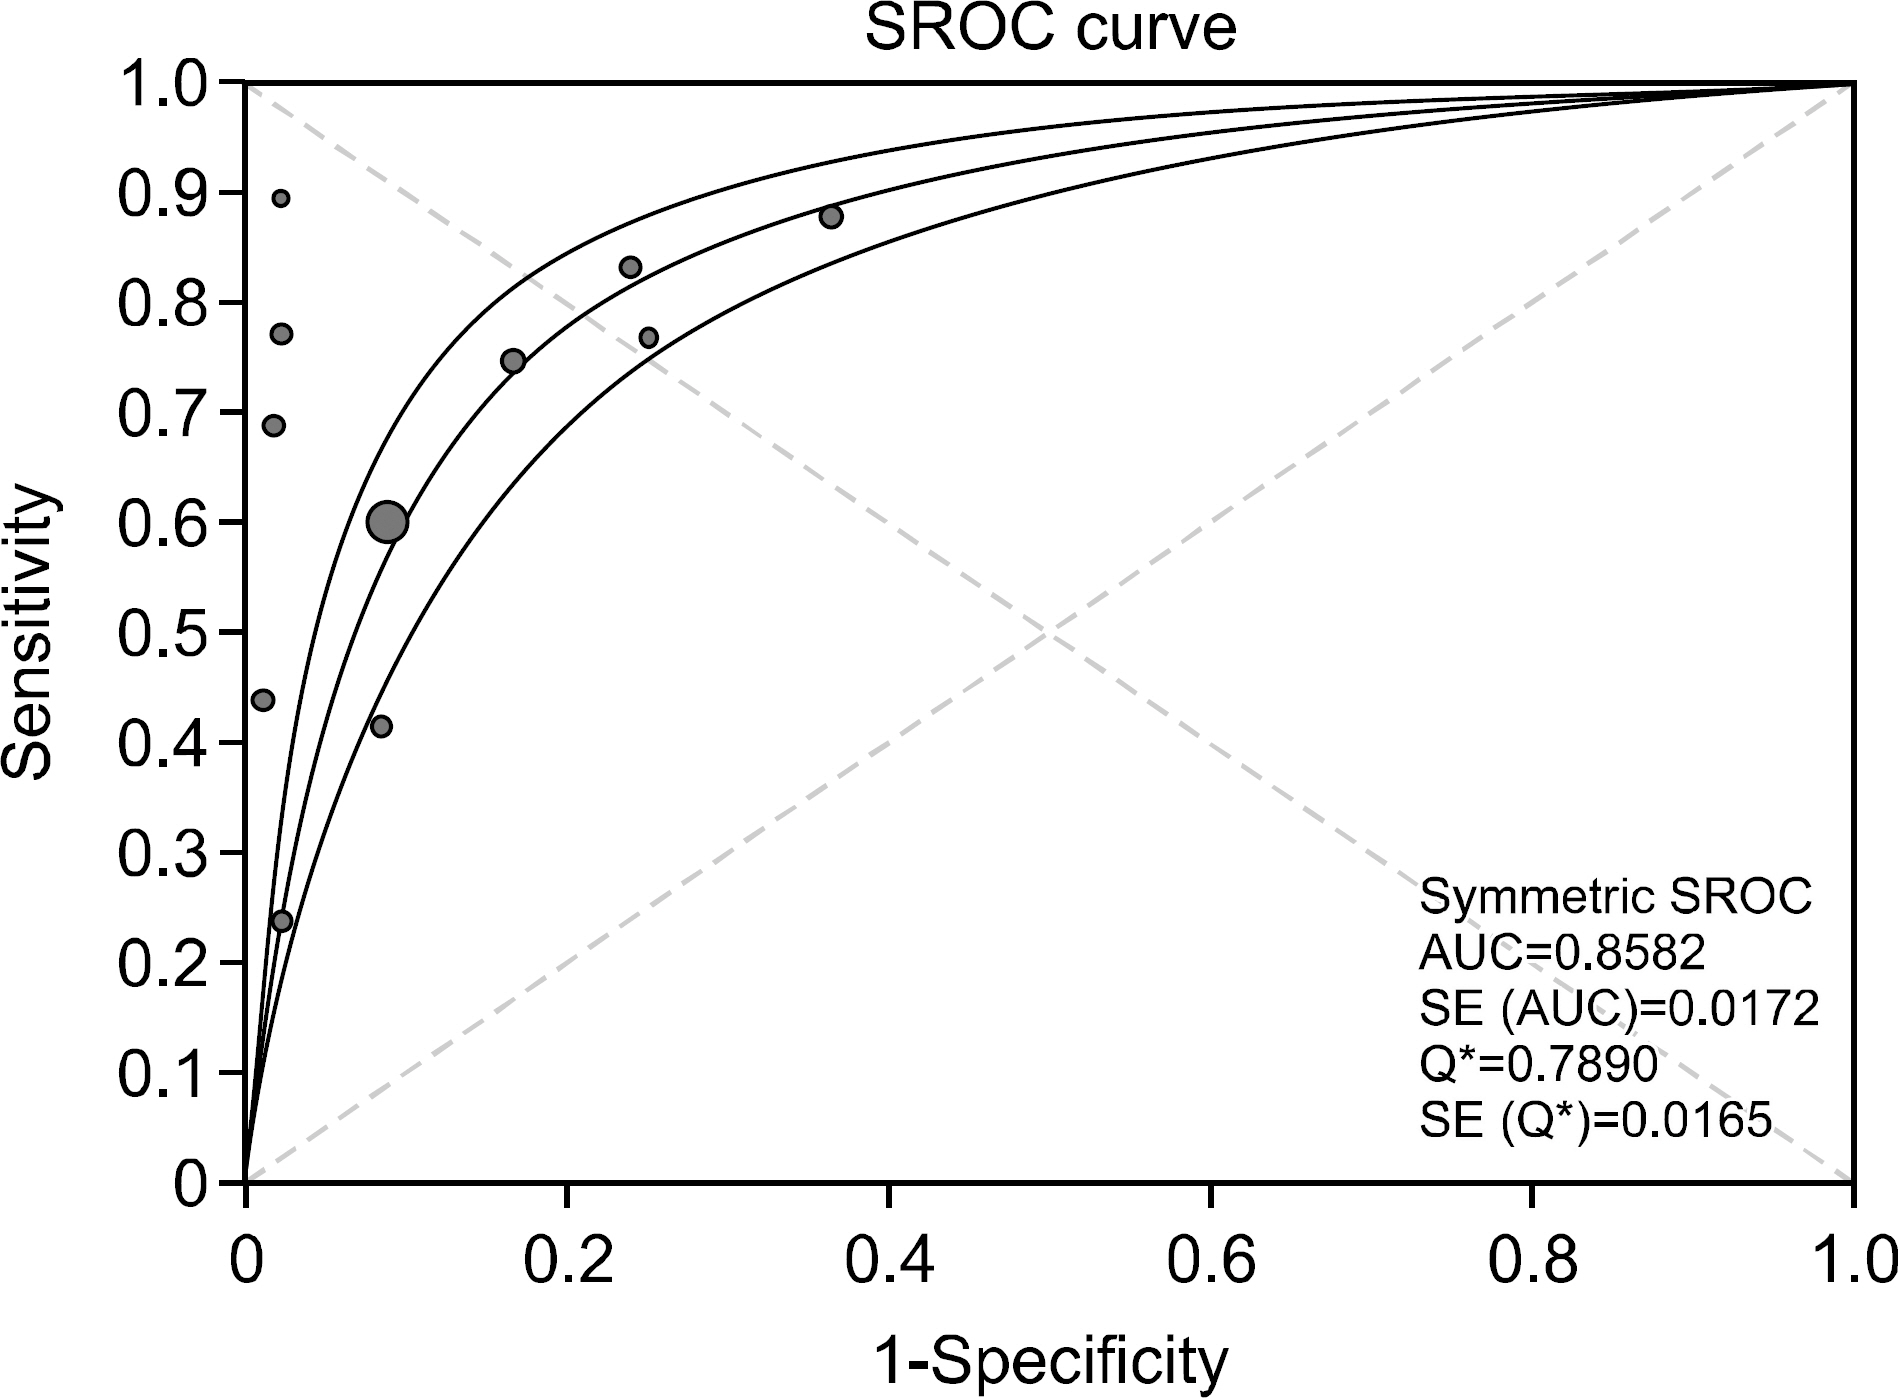
Figure 2. Summary receiver-operating characteristic curves for ultrasound for the diagnosis of gout. Solid circles represent the individual studies included in this meta-analysis. The curve shown is a regression line that summarizes the overall diagnostic accuracy. SE (AUC): standard error of the area under the curve, Q*: an index defined by the point on the summary receiver operating characteristic (sROC) curve, where the sensitivity and specificity are equal, SE (Q*): Q* index standard error.
Reference
-
1. Gotzsche PC. Why we need a broad perspective on meta-analysis. It may be crucially important for patients. BMJ. 2000; 321:585–6.2. Irwig L, Macaskill P, Glasziou P, Fahey M. Meta-analytic methods for diagnostic test accuracy. J Clin Epidemiol. 1995; 48:119–30.
Article3. Egger M, Smith GD, Phillips AN. Meta-analysis: principles and procedures. BMJ. 1997; 315:1533–7.
Article4. Thompson SG, Higgins JP. How should meta-regression analyses be undertaken and interpreted? Stat Med. 2002; 21:1559–73.
Article5. Šimundić AM. Measures of diagnostic accuracy: basic definitions. EJIFCC. 2009; 19:203–11.6. Harbord RM, Whiting P, Sterne JA, Egger M, Deeks JJ, Shang A, et al. An empirical comparison of methods for meta-analysis of diagnostic accuracy showed hierarchical models are necessary. J Clin Epidemiol. 2008; 61:1095–103.
Article7. Reitsma JB, Glas AS, Rutjes AW, Scholten RJ, Bossuyt PM, Zwinderman AH. Bivariate analysis of sensitivity and specificity produces informative summary measures in diagnostic reviews. J Clin Epidemiol. 2005; 58:982–90.
Article8. Campbell JM, Klugar M, Ding S, Carmody DP, Hakonsen SJ, Jadotte YT, et al. The joanna briggs institute reviewers' manual 2015. The systematic review of studies of diagnostic test accuracy. Adelaide, The Joanna Briggs Institute. 2015; 46.9. Leeflang MM. Systematic reviews and meta-analyses of diagnostic test accuracy. Clin Microbiol Infect. 2014; 20:105.
Article10. Deeks J, Bossuyt P, Gatsonis C. Cochrane handbook for systematic reviews of diagnostic test accuracy version 1.0. 0. Oxford: Cochrane Collaboration;2009.11. Deeks JJ. Systematic reviews in health care: Systematic reviews of evaluations of diagnostic and screening tests. BMJ. 2001; 323:157–62.
Article12. Glas AS, Lijmer JG, Prins MH, Bonsel GJ, Bossuyt PM. The diagnostic odds ratio: a single indicator of test performance. J Clin Epidemiol. 2003; 56:1129–35.
Article13. Hanley JA, McNeil BJ. The meaning and use of the area under a receiver operating characteristic (ROC) curve. Radiology. 1982; 143:29–36.
Article14. Dinnes J, Deeks J, Kirby J, Roderick P. A methodological review of how heterogeneity has been examined in systematic reviews of diagnostic test accuracy. Health Technol Assess. 2005; 9:1–113. iii.
Article15. Walter SD. Properties of the summary receiver operating characteristic (SROC) curve for diagnostic test data. Stat Med. 2002; 21:1237–56.
Article16. Okeh UM, Okoro CN. Evaluating measures of indicators of diagnostic test performance: fundamental meanings and formulars. J Biom Biostat. 2012; 3:132.17. Trikalinos TA, Salanti G, Zintzaras E, Ioannidis JP. Meta-analysis methods. Adv Genet. 2008; 60:311–34.
Article18. Whitehead A, Whitehead J. A general parametric approach to the meta-analysis of randomized clinical trials. Stat Med. 1991; 10:1665–77.
Article19. Munafò MR, Flint J. Meta-analysis of genetic association studies. Trends Genet. 2004; 20:439–44.
Article20. Higgins JP, Thompson SG. Quantifying heterogeneity in a meta-analysis. Stat Med. 2002; 21:1539–58.
Article21. Leeflang MM, Deeks JJ, Gatsonis C, Bossuyt PM. Cochrane Diagnostic Test Accuracy Working Group. Systematic reviews of diagnostic test accuracy. Ann Intern Med. 2008; 149:889–97.
Article22. Moses LE, Shapiro D, Littenberg B. Combining independent studies of a diagnostic test into a summary ROC curve: da-ta-analytic approaches and some additional considerations. Stat Med. 1993; 12:1293–316.
Article23. Davey Smith G, Egger M. Meta-analyses of randomised controlled trials. Lancet. 1997; 350:1182.24. DerSimonian R, Laird N. Meta-analysis in clinical trials. Control Clin Trials. 1986; 7:177–88.
Article25. Rutter CM, Gatsonis CA. A hierarchical regression approach to meta-analysis of diagnostic test accuracy evaluations. Stat Med. 2001; 20:2865–84.
Article26. Terslev L, Gutierrez M, Schmidt WA, Keen HI, Filippucci E, Kane D, et al. Ultrasound as an outcome measure in gout. A validation process by the OMERACT Ultrasound Working Group. J Rheumatol. 2015; 42:2177–81.
Article27. Neogi T, Jansen TL, Dalbeth N, Fransen J, Schumacher HR, Berendsen D, et al. 2015 Gout Classification Criteria: an American College of Rheumatology/European League Against Rheumatism collaborative initiative. Arthritis Rheumatol. 2015; 67:2557–68.
Article28. Wallace SL, Robinson H, Masi AT, Decker JL, McCarty DJ, Yü TF. Preliminary criteria for the classification of the acute arthritis of primary gout. Arthritis Rheum. 1977; 20:895–900.
Article29. Zamora J, Abraira V, Muriel A, Khan K, Coomarasamy A. Meta-DiSc: a software for meta-analysis of test accuracy data. BMC Med Res Methodol. 2006; 6:31.
Article30. Pattamapaspong N, Vuthiwong W, Kanthawang T, Louthrenoo W. Value of ultrasonography in the diagnosis of gout in patients presenting with acute arthritis. Skeletal Radiol. 2017; 46:759–67.
Article31. Ogdie A, Taylor WJ, Neogi T, Fransen J, Jansen TL, Schumacher HR, et al. Performance of ultrasound in the diagnosis of gout in a multicenter study: comparison with monosodium urate monohydrate crystal analysis as the gold standard. Arthritis Rheumatol. 2017; 69:429–38.
Article32. Das S, Ghosh A, Ghosh P, Lahiri D, Sinhamahapatra P, Basu K. Sensitivity and specificity of ultrasonographic features of gout in intercritical and chronic phase. Int J Rheum Dis. 2017; 20:887–93.
Article33. Zufferey P, Valcov R, Fabreguet I, Dumusc A, Omoumi P, So A. A prospective evaluation of ultrasound as a diagnostic tool in acute microcrystalline arthritis. Arthritis Res Ther. 2015; 17:188.
Article34. Löffler C, Sattler H, Peters L, Löffler U, Uppenkamp M, Bergner R. Distinguishing gouty arthritis from calcium pyrophosphate disease and other arthritides. J Rheumatol. 2015; 42:513–20.
Article35. Lamers-Karnebeek FB, Van Riel PL, Jansen TL. Additive value for ultrasonographic signal in a screening algorithm for patients presenting with acute mono-/oligoarthritis in whom gout is suspected. Clin Rheumatol. 2014; 33:555–9.
Article36. Naredo E, Uson J, Jiménez-Palop M, Martínez A, Vicente E, Brito E, et al. Ultrasound-detected musculoskeletal urate crystal deposition: which joints and what findings should be assessed for diagnosing gout? Ann Rheum Dis. 2014; 73:1522–8.
Article37. Ottaviani S, Richette P, Allard A, Ora J, Bardin T. Ultrasonography in gout: a case-control study. Clin Exp Rheumatol. 2012; 30:499–504.38. Filippucci E, Riveros MG, Georgescu D, Salaffi F, Grassi W. Hyaline cartilage involvement in patients with gout and calcium pyrophosphate deposition disease. An ultrasound study. Osteoarthritis Cartilage. 2009; 17:178–81.
Article39. Thiele RG, Schlesinger N. Diagnosis of gout by ultrasound. Rheumatology (Oxford). 2007; 46:1116–21.
Article40. Wright SA, Filippucci E, McVeigh C, Grey A, McCarron M, Grassi W, et al. High-resolution ultrasonography of the first metatarsal phalangeal joint in gout: a controlled study. Ann Rheum Dis. 2007; 66:859–64. www.jrd.or.kr.
Article
- Full Text Links
-
- Actions
-
Cited
- CITED
-
- Close
- Share
-
- Similar articles
-
- Meta-Analysis of Diagnostic Test Accuracy
- An overview of systematic reviews of diagnostic tests accuracy
- Systematic Review and Meta-Analysis of Studies Evaluating Diagnostic Test Accuracy: A Practical Review for Clinical Researchers-Part I. General Guidance and Tips
- Systematic Review and Meta-Analysis of Studies Evaluating Diagnostic Test Accuracy: A Practical Review for Clinical Researchers-Part II. Statistical Methods of Meta-Analysis
- A Meta-analysis of the Diagnostic Value of Minor Salivary Gland Biopsy for Primary Sjogren's Syndrome
