J Korean Ophthalmol Soc.
2012 Jan;53(1):103-110. 10.3341/jkos.2012.53.1.103.
Comparison of Retinal Nerve Fiber Layer Thickness Measured by Spectral-Domain and Time-Domain Optical Coherence Tomography
- Affiliations
-
- 1Department of Ophthalmology, Hanyang University College of Medicine, Seoul, Korea. KBUhm@hanyang.ac.kr
- KMID: 2215251
- DOI: http://doi.org/10.3341/jkos.2012.53.1.103
Abstract
- PURPOSE
To compare retinal nerve fiber layer (RNFL) thickness measured by time domain (Stratus) and spectral domain (3D) optical coherence tomography (OCT).
METHODS
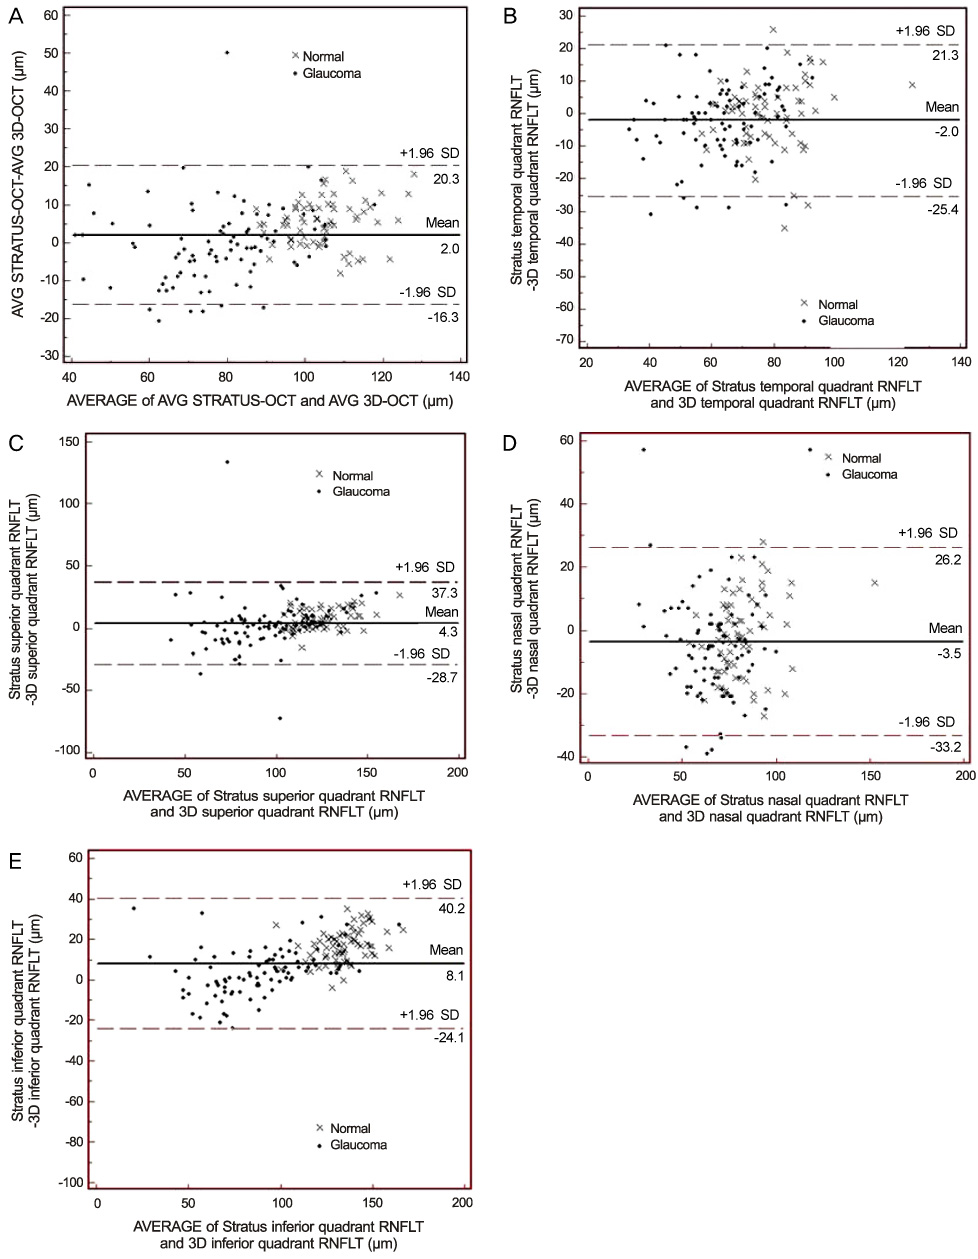
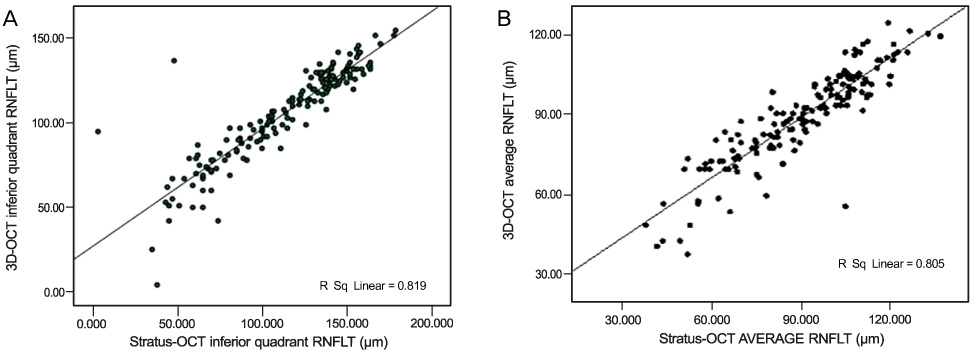
Sixty-nine normal subjects and 92 glaucoma patients were included in the present study. Peripapillary RNFL thickness was measured with Stratus fast RNFL scan and 3D optic disc cube scan on the same day. The relationship between RNFL thickness measurements of the two OCTs were evaluated using a Pearson's correlation analysis. A Bland-Altman plot was used for the comparison of Stratus-OCT and 3D-OCT.
RESULTS
In all subjects, average, superior, and inferior quadrant RNFL thicknesses measured by Stratus-OCT were thicker than those measured by 3D-OCT. In contrast, temporal and nasal quadrant RNFL thicknesses measured by 3D-OCT were thicker than those measured by Stratus-OCT. Although there were absolute value differences in RNFL thicknesses, high correlation was observed between Stratus-OCT and 3D-OCT (average: r = 0.897, temporal quadrant: r = 0.728, superior quadrant: r = 0.811, nasal quadrant: r = 0.678, and inferior quadrant: r = 0.905). Bland-Altman plots showed that Stratus-OCT values were greater than 3D-OCT values with relatively high RNFL thickness and the opposite with low RNFL thickness.
CONCLUSIONS
For thicker RNFL, Stratus-OCT measurements tend to be greater than 3D-OCT, while for thinner RNFL, 3D-OCT measurements tend to be greater than Stratus-OCT. This difference must be taken into account if comparing measurements made with a Stratus-OCT to the measurements of a 3D-OCT.
Figure
Reference
-
1. Blumenthal EZ, BS Williams JM, Weinreb RN, et al. Reproducibility of nerve fiber layer thickness measurements by use of optical coherence tomography. Ophthalmology. 2000. 107:2278–2282.2. Hood DC, Raza AS, Kay KY, et al. A comparison of retinal nerve fiber layer (RNFL) thickness obtained with frequency and time domain optical coherence tomography (OCT). Opt Express. 2009. 17:3997–4003.3. Inoue R, Hangai M, Kotera Y, et al. Three-dimensional high-speed optical coherence tomography imaging of lamina cribrosa in glaucoma. Ophthalmology. 2009. 116:214–222.4. Kotera Y, Hangai M, Hirose F, et al. Three-dimensional imaging of macular inner structures in glaucoma by using spectral-domain optical coherence tomography. Invest Ophthalmol Vis Sci. 2011. 52:1412–1421.5. Menke MN, Knecht P, Sturm V, et al. Reproducibility of nerve fiber layer thickness measurements using 3D fourier-domain OCT. Invest Ophthalmol Vis Sci. 2008. 49:5386–5391.6. Landis JR, Koch GG. The measurement of observer agreement for categorical data. Biometrics. 1977. 33:159–174.7. Vizzeri G, Weinreb RN, Gonzalez-Garcia AO, et al. Agreement between spectral domain and time-domain OCT for measuring RNFL thickness. Br J Ophthalmol. 2009. 93:775–781.8. Sung KR, Kim DY, Park SB, Kook MS. Comparison of retinal nerve fiber layer thickness measured by Cirrus HD and Stratus optical coherence tomography. Ophthalmology. 2009. 116:1264–1270.9. Knight OJ, Chang RT, Feuer WJ, Budenz DL. Comparison of retinal nerve fiber layer measurements using time domain and spectral domain optical coherent tomography. Ophthalmology. 2009. 116:1271–1277.10. Cho JW, Sung KR, Hong JT, et al. Detection of glaucoma by spectral domain scanning laser ophthalmoscopy/optical coherence tomography (SD-SLO/OCT) and time domain optical coherence tomography. J Glaucoma. 2011. 20:15–20.11. González-García AO, Vizzeri G, Bowd C, et al. Reproducibility of RTVue retinal nerve fiber layer thickness and optic disc measurements and agreement with Stratus optical coherence tomography measurements. Am J Ophthalmol. 2009. 147:1067–1074.12. Kim BK, Lee DW, Ahn M, Cho NC. Comparison of time domain OCT and spectrum domain OCT for retinal nerve fiber layer assessment. J Korean Ophthalmol Soc. 2009. 50:1539–1547.13. Leung CKS, Yung WH, Ng AC, et al. Evaluation of scanning resolution on retinal nerve fiber layer measurement using optical coherence tomography in normal and glaucomatous eyes. J Glaucoma. 2004. 13:479–485.14. Budenz DL, Chang RT, Huang X, et al. Reproducibility of retinal nerve fiber thickness measurements using the Stratus OCT in normal and glaucomatous eyes. Invest Ophthalmol Vis Sci. 2005. 46:2440–2443.15. Legarreta JE, Gregori G, Punjabi OS, et al. Macular thickness measurements in normal eyes using spectral domain optical coherence tomography. Ophthalmic Surg Lasers Imaging. 2008. 39:4 Suppl. S43–S49.16. Song YM, Uhm KB. Discrimination between normal and early stage of glaucomatous eyes using the Stratus optical coherence tomography. J Korean Ophthalmol Soc. 2007. 48:1675–1685.17. Ghadiali Q, Hood DC, Lee C, et al. An analysis of normal variations in retinal nerve fiber layer thickness profiles measured with optical coherence tomography. J Glaucoma. 2008. 17:333–340.18. Hood DC, Fortune B, Arthur SN, et al. Blood vessel contributions to retinal nerve fiber layer thickness profiles measured with optical coherence tomography. J Glaucoma. 2008. 17:519–528.19. Budenz DL, Fredette MJ, Feuer WJ, Anderson DR. Reproducibility of peripapillary retinal nerve fiber thickness measurements with Stratus OCT in glaucomatous eyes. Ophthalmology. 2008. 115:661–666.20. Schuman JS, Pedut-Kloizman T, Hertzmark E, et al. Reproducibility of nerve fiber layer thickness measurements using optical coherence tomography. Ophthalmology. 1996. 103:1889–1898.21. Knighton RW, Qian C. An optical model of the human retinal nerve fiber layer: implications of directional reflectance for variability of clinical measurements. J Glaucoma. 2000. 9:56–62.22. Vizzeri G, Bowd C, Medeiros FA, et al. Effect of improper scan alignment on retinal nerve fiber layer thickness measurements using Stratus optical coherence tomograph. J Glaucoma. 2008. 17:341–349.
- Full Text Links
- Actions
-
Cited
- CITED
-
- Close
- Share
- Similar articles
-
- Retinal Nerve Fiber Layer Thickness Measured by Spectral Domain Optical Coherence Tomography in Healthy Koreans
- Spectral-Domain Optical Coherence Tomography Findings in Acute Central Retinal Artery Occlusion
- Influence of Epiretinal Membranes on the Retinal Nerve Fiber Layer Thickness Measured by Spectral Domain Optical Coherence Tomography in Glaucoma
- Difference of GCIPL Thickness of Diabetes and Normal Eyes in Spectral Domain OCT
- Comparison of Retinal Nerve Fiber Layer Thickness between Stratus and Spectralis OCT


