Chonnam Med J.
2013 Apr;49(1):38-42. 10.4068/cmj.2013.49.1.38.
Changes in 18F-Fluorodeoxyglucose Uptake in the Spinal Cord in a Healthy Population on Serial Positron Emission Tomography/Computed Tomography
- Affiliations
-
- 1Department of Nuclear Medicine, Chosun University Hospital, School of Medicine, Chosun University, Gwangju, Korea.
- 2Department of Nuclear Medicine, Chonnam National University Hospital, Gwangju, Korea. songhc@jnu.ac.kr
- 3Department of Nuclear Medicine, Chonnam National University Hwasun Hospital, Hwasun, Korea.
- 4Department of Neurosurgery, Chonnam National University Hospital, Chonnam National University Medical School, Gwangju, Korea.
- KMID: 2172175
- DOI: http://doi.org/10.4068/cmj.2013.49.1.38
Abstract
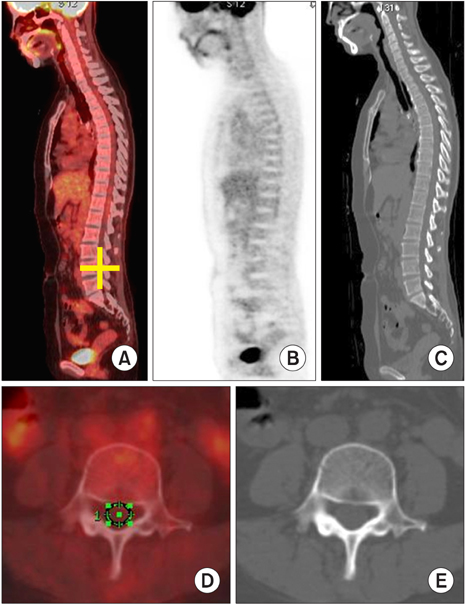
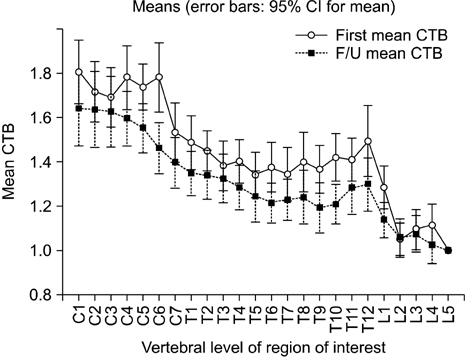
- We aimed to determine the changes in 18F-fluorodeoxyglucose (FDG) uptake in the spinal cord on two serial positron emission tomography/computed tomography (PET/CT) scans in a healthy population. We retrospectively enrolled healthy people who underwent PET/CT twice for cancer screening. We excluded those who had degenerative vertebral disease, neurologic disease, or a history of a vertebral operation. The standardized uptake value (SUVmax) of the spinal cord of each mid-vertebral body was obtained by drawing a region of interest on an axial image of PET/CT. For analysis, the cord-to-background ratio (CTB) was used (CTB=SUVmax of each level/SUVmax of L5 level). Differences in pattern, sex, age, and intervals of the two serial PET/CT scans were analyzed. A total of 60 PET/CT images of 30 people were analyzed. The mean interval between the two PET/CT imaging studies was 2.80+/-0.94 years. On the follow-up PET/CT, significant change was shown only at the level of the C6 and T10 vertebrae (p<0.005). Mean CTB showed a decreasing pattern from cervical to lumbar vertebrae. There were two peaks at the lower cervical level (C4-6) and at the lower thoracic level (T12). Neither sex nor age significantly affected CTB. The FDG uptake of the spinal cord changed significantly on follow-up PET/CT only at the level of the C6 and T10 vertebrae. This finding is valuable as a baseline reference in the follow-up of metabolic changes in the spinal cord.
MeSH Terms
Figure
Reference
-
1. Zhang N, Wimmer J, Qian SJ, Chen WS. Stem cells: current approach and future prospects in spinal cord injury repair. Anat Rec (Hoboken). 2010. 293:519–530.
Article2. Saporta S, Makoui AS, Willing AE, Daadi M, Cahill DW, Sanberg PR. Functional recovery after complete contusion injury to the spinal cord and transplantation of human neuroteratocarcinoma neurons in rats. J Neurosurg. 2002. 97:1 Suppl. 63–68.
Article3. Coutts M, Keirstead HS. Stem cells for the treatment of spinal cord injury. Exp Neurol. 2008. 209:368–377.
Article4. Frangioni JV, Hajjar RJ. In vivo tracking of stem cells for clinical trials in cardiovascular disease. Circulation. 2004. 110:3378–3383.
Article5. Amin A, Rosenbaum SJ, Bockisch A. Physiological 18F-FDG uptake by the spinal cord: is it a point of consideration for cancer patients? J Neurooncol. 2012. 107:609–615.
Article6. Do BH, Mari C, Tseng JR, Quon A, Rosenberg J, Biswal S. Pattern of 18F-FDG uptake in the spinal cord in patients with non-central nervous system malignancy. Spine (Phila Pa 1976). 2011. 36:E1395–E1401.
Article7. McCarville MB, Monu N, Smeltzer MP, Li CS, Laningham FH, Morris EB, et al. PET-CT of the normal spinal cord in children. Acad Radiol. 2009. 16:881–885.
Article8. Esik O, Emri M, Szakáll S Jr, Herzog H, Sáfrány G, Lengyel E, et al. PET identifies transitional metabolic change in the spinal cord following a subthreshold dose of irradiation. Pathol Oncol Res. 2004. 10:42–46.
Article9. Esik O, Csere T, Stefanits K, Szakáll S Jr, Lengyel Z, Sáfrány G, et al. Increased metabolic activity in the spinal cord of patients with long-standing Lhermitte's sign. Strahlenther Onkol. 2003. 179:690–693.10. Chamroonrat W, Posteraro A, El-Haddad G, Zhuang H, Alavi A. Radiation myelopathy visualized as increased FDG uptake on positron emission tomography. Clin Nucl Med. 2005. 30:560.
Article11. Esik O, Emri M, Csornai M, Kásler M, Gödény M, Trón L. Radiation myelopathy with partial functional recovery: PET evidence of long-term increased metabolic activity of the spinal cord. J Neurol Sci. 1999. 163:39–43.
Article12. Esik O, Lengyel Z, Sáfrány G, Vönöczky K, Agoston P, Székely J, et al. A PET study on the characterization of partially reversible radiogenic lower motor neurone disease. Spinal Cord. 2002. 40:468–473.
Article13. Komori T, Delbeke D. Leptomeningeal carcinomatosis and intramedullary spinal cord metastases from lung cancer: detection with FDG positron emission tomography. Clin Nucl Med. 2001. 26:905–907.
Article14. Jeon MJ, Kim TY, Han JM, Yim JH, Rhim SC, Kim WB, et al. Intramedullary spinal cord metastasis from papillary thyroid carcinoma. Thyroid. 2011. 21:1269–1271.
Article15. Ota K, Tsunemi T, Saito K, Yamanami F, Watanabe M, Irioka T, et al. 18F-FDG PET successfully detects spinal cord sarcoidosis. J Neurol. 2009. 256:1943–1946.
Article16. Sakushima K, Yabe I, Shiga T, Yashima-Yamada M, Tsuji-Akimoto S, Terae S, et al. FDG-PET SUV can distinguish between spinal sarcoidosis and myelopathy with canal stenosis. J Neurol. 2011. 258:227–230.
Article17. Floeth FW, Stoffels G, Herdmann J, Jansen P, Meyer W, Steiger HJ, et al. Regional impairment of 18F-FDG uptake in the cervical spinal cord in patients with monosegmental chronic cervical myelopathy. Eur Radiol. 2010. 20:2925–2932.
Article18. Uchida K, Nakajima H, Yayama T, Kobayashi S, Shimada S, Tsuchida T, et al. High-resolution magnetic resonance imaging and 18FDG-PET findings of the cervical spinal cord before and after decompressive surgery in patients with compressive myelopathy. Spine (Phila Pa 1976). 2009. 34:1185–1191.
Article19. Baba H, Uchida K, Sadato N, Yonekura Y, Kamoto Y, Maezawa Y, et al. Potential usefulness of 18F-2-fluoro-deoxy-D-glucose positron emission tomography in cervical compressive myelopathy. Spine (Phila Pa 1976). 1999. 24:1449–1454.
Article20. Gray H. William PL, editor. Gray's anatomy. Spinal Medulla or Cord. 1989. 37th ed. New York: Churchill Livingstone;922.21. Kameyama T, Hashizume Y, Sobue G. Morphologic features of the normal human cadaveric spinal cord. Spine (Phila Pa 1976). 1996. 21:1285–1290.
Article22. Schafer EA. Quain J, Schafer EA, Thane GD, editors. Quain's elements of anatomy. The Spinal Cord. 1900. 10th ed. London: Longmans, Green and Co.;1–219.23. Cahill CM, Stroman PW. Mapping of neural activity produced by thermal pain in the healthy human spinal cord and brain stem: a functional magnetic resonance imaging study. Magn Reson Imaging. 2011. 29:342–352.
Article24. Stroman PW, Coe BC, Munoz DP. Influence of attention focus on neural activity in the human spinal cord during thermal sensory stimulation. Magn Reson Imaging. 2011. 29:9–18.
Article25. Chen YY, Shih YY, Chien CN, Chou TW, Lee TW, Jaw FS. MicroPET study of brain neuronal metabolism under electrical and mechanical stimulation of the rat tail. Nucl Med Commun. 2009. 30:188–193.
Article26. Chen YY, Shih YY, Lo YC, Lu PL, Tsang S, Jaw FS, et al. MicroPET imaging of noxious thermal stimuli in the conscious rat brain. Somatosens Mot Res. 2010. 27:69–81.
Article27. Fehm HL, Kern W, Peters A. The selfish brain: competition for energy resources. Prog Brain Res. 2006. 153:129–140.
Article28. Mapp PI, Terenghi G, Walsh DA, Chen ST, Cruwys SC, Garrett N, et al. Monoarthritis in the rat knee induces bilateral and time-dependent changes in substance P and calcitonin gene-related peptide immunoreactivity in the spinal cord. Neuroscience. 1993. 57:1091–1096.
Article
- Full Text Links
- Actions
-
Cited
- CITED
-
- Close
- Share
- Similar articles
-
- Non-Malignant 18F-FDG Uptake in the Thorax by Positron Emission Tomography Computed Tomography Fusion Imaging
- 18F-2-Deoxy-2-Fluoro-D-Glucose Positron Emission Tomography: Computed Tomography for Preoperative Staging in Gastric Cancer Patients
- Adult granulosa cell tumor presenting with massive ascites, elevated CA-125 level, and low 18F-fluorodeoxyglucose uptake on positron emission tomography/computed tomography
- Perirenal 18F-FDG Uptake in a Patient with a Pheochromocytoma
- Lymphocytic Thyroiditis Presenting as a Focal Uptake on 18F-Fluorodeoxyglucose Positron Emission Tomography: A Case Report


