Alu and L1 Retroelements Are Correlated with the Tissue Extent and Peak Rate of Gene Expression, Respectively
- Affiliations
-
- 1Department of Microbiology, College of Medicine, The Catholic University of Korea, Seoul, Korea. rhyumung@catholic.ac.kr
- KMID: 1778557
- DOI: http://doi.org/10.3346/jkms.2004.19.6.783
Abstract
- We exploited the serial analysis of gene expression (SAGE) libraries and human genome database in silico to correlate the breadth of expression (BOE; housekeep-ing versus tissue-specific genes) and peak rate of expression (PRE; high versus low expressed genes) with the density distribution of the retroelements. The BOE status is linearly associated with the density of the sense Alus along the 100 kb nucleotides region upstream of a gene, whereas the PRE status is inversely correlated with the density of antisense L1s within a gene and in the up- and downstream regions of the 0-10 kb nucleotides. The radial distance of intranuclear position, which is known to serve as the global domain for transcription regulation, is reciprocally correlated with the fractions of Alu (toward the nuclear center) and L1 (toward the nuclear edge) elements in each chromosome. We propose that the BOE and PRE statuses are related to the reciprocal distribution of Alu and L1 elements that formulate local and global expression domains.
MeSH Terms
-
Alu Elements/*genetics
Chromosome Mapping/*methods
Comparative Study
Databases, Genetic
Gene Expression Profiling/*methods
Gene Expression Regulation/*genetics
Genome, Human
Humans
Long Interspersed Nucleotide Elements/*genetics
Retroelements/genetics
Sequence Analysis, DNA/*methods
Statistics
Tissue Distribution
Figure
-
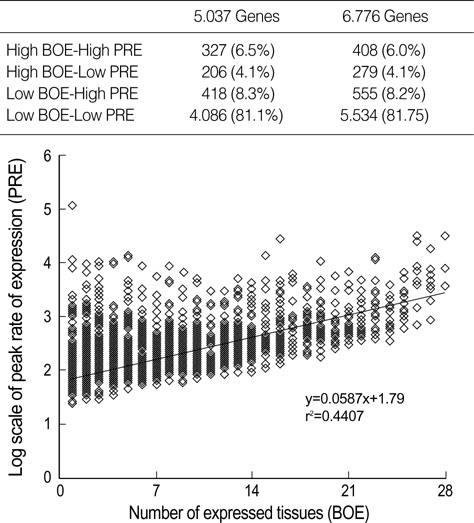
Fig. 1 Distribution of 5,037 gene expressions skewed toward low breadth of expression (BOE) and low peak rate of expression (PRE). The total of 6,776 expressed genes and the 5,037 genes reliably matched to a transcriptional unit are similarly divided into four BOE-PRE groups using the median values of the expression parameters. The table above the graph represents the proportion of 6,776 expressed genes and 5,037 matched genes present in the four BOE-PRE groups. The 5,036 expressed genes are plotted against the BOE and PRE parameters and are divided into four quadrants indicated by dotted lines. The correlation between the BOE and log-transformed PRE is shown by the best-fit line.

Fig. 2 Relationships between breadth (BOE) and peak rate (PRE) of expression and retroelement families. The 5,037 gene expressions are categorized into four BOE-PRE pair-wise groups, high-BOE and high-PRE (blue), high-BOE and low-PRE (black), low-BOE and high-PRE (green), and low-BOE and low-PRE (red). The densities of the retroelements in the 100 kb nucleotides regions, upstream and downstream of the genes, are fractionated into 10 kb nucleotides bins, and separately plotted for the four BOE-PRE groups. The sense and antisense copies of each retroelement indicate the same and opposite orientation, respectively, in relation to the nearest gene. The intragenic density of the retroelements is indicated above the "Gene".
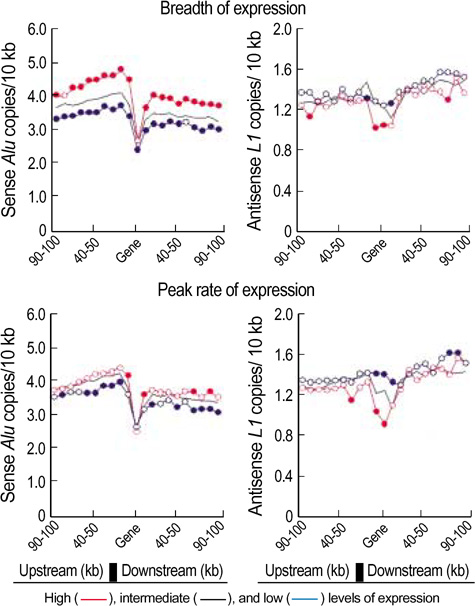
Fig. 3 Regional relationships between the BOE and PRE statuses and density distributions of sense Alu and antisense L1 elements. The BOE and PRE statuses are divided into three levels, high (red), intermediate (black), and low (blue). Sense Alu and antisense L1 elements in the extragenic and intragenic regions are separately plotted according to the levels of BOE and PRE in 10 kb nucleotide bins along 100 kb nucleotides regions upstream and downstream of the coding regions. Statistically significant differences (p<0.05) in the Alu and L1 densities between high and intermediate levels (red) and between intermediate and low levels (blue) of expression are indicated by closed circles along the intragenic and extragenic regions. The cutoff points for the BOE and PRE levels were described in the Methods section. The intragenic density of the retroelements is indicated above the "Gene".
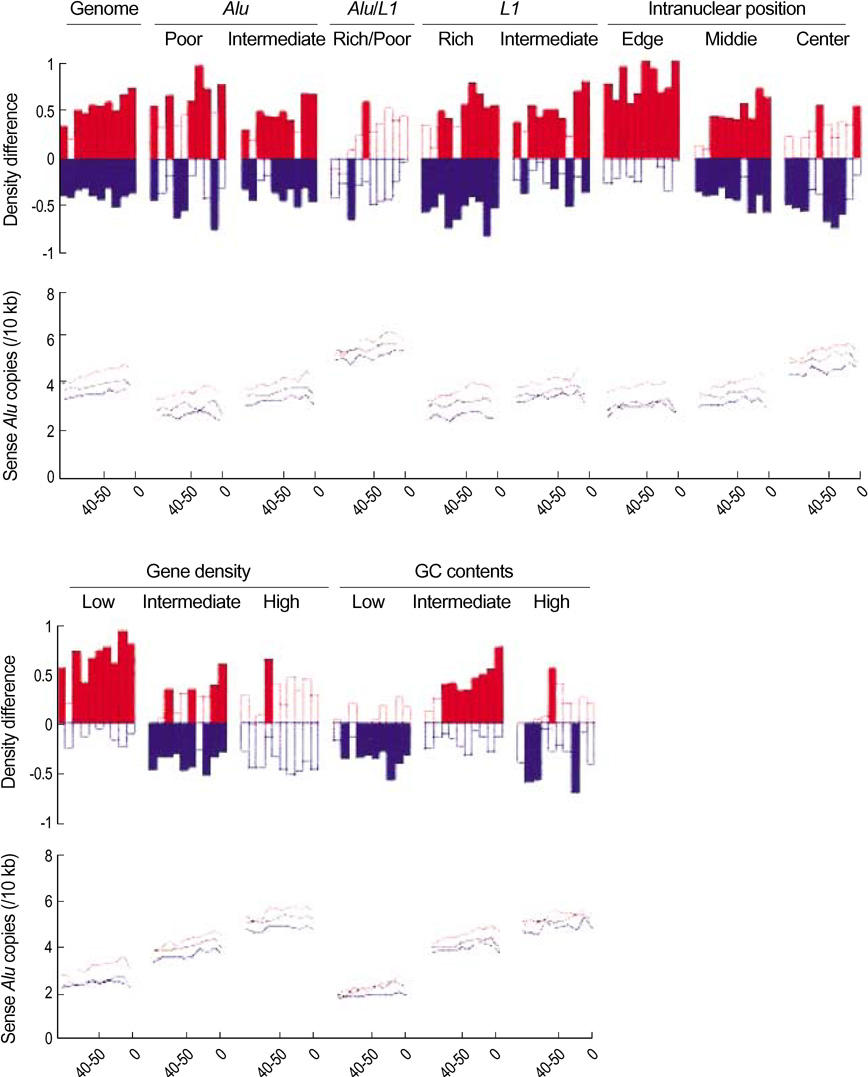
Fig. 4 Comparison of BOE-Alu relation among the five gene groups sorted in the order of chromosomal (Alu and L1 fractions and intranuclear position) and genomic (gene density and GC content) parameters. Sense Alu density differences between the high and intermediate (red) and the low and intermediate (blue) levels of the BOE status are calculated for each chromosome or gene group. Density differences are indicated by shaded bars in statistically significant cases (p<0.05). The cutoff values for gene grouping were described in the Methods section. The mean densities of the sense Alus per 10 kb segment along the 100 kb upstream region of a gene are selected and depicted below the corresponding histogram (see legend to Fig. 3).
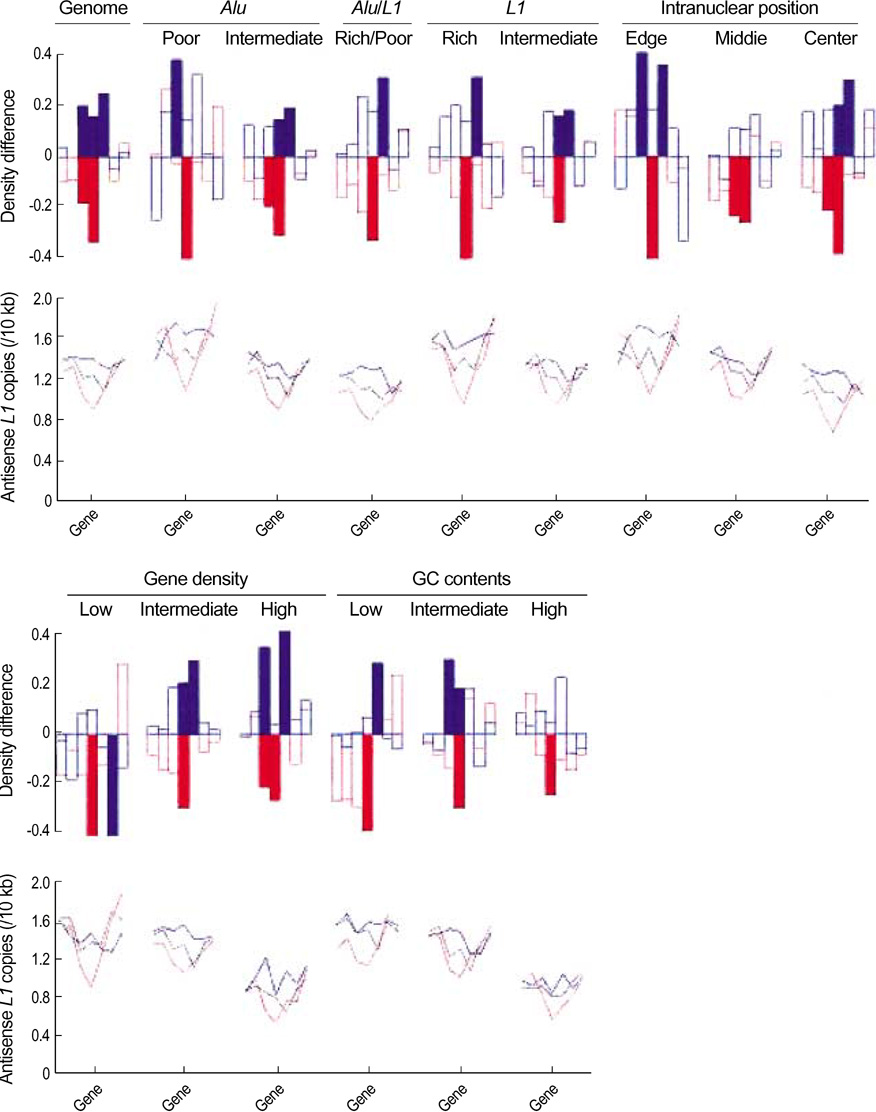
Fig. 5 Comparison of PRE-L1 relation among the five gene groups sorted in the order of chromosomal (Alu and L1 fractions and intranuclear position) and genomic (gene density and GC content) parameters. Density differences of antisense L1s between the high and intermediate (red) and the low and intermediate (blue) levels of the PRE status are calculated for each chromosome or gene group. Density differences are indicated by shaded bars in statistically significant cases (p<0.05). The cutoff values for gene grouping were described in the Methods section. The mean densities of the antisense L1s within a gene and the 30 kb upstream and downstream regions are selectively depicted below the corresponding histogram (see legend to Fig. 3).
Reference
-
1. Lander ES, Linton LM, Birren B, Nusbaum C, Zody MC, Baldwin J, Devon K, Dewar K, Doyle M, FitzHugh W, Funke R, Gage D, Harris K, Heaford A, Howland J, Kann L, Lehoczky J, LeVine R, McEwan P, McKernan K, Meldrim J, Mesirov JP, Miranda C, Morris W, Naylor J, Raymond C, Rosetti M, Santos R, Sheridan A, Sougnez C, Stange-Thomann N, Stojanovic N, Subramanian A, Wyman D, Rogers J, Sulston J, Ainscough R, Beck S, Bentley D, Burton J, Clee C, Carter N, Coulson A, Deadman R, Deloukas P, Dunham A, Dunham I, Durbin R, French L, Grafham D, Gregory S, Hubbard T, Humphray S, Hunt A, Jones M, Lloyd C, McMurray A, Matthews L, Mercer S, Milne S, Mullikin JC, Mungall A, Plumb R, Ross M, Shownkeen R, Sims S, Waterston RH, Wilson RK, Hillier LW, McPherson JD, Marra MA, Mardis ER, Fulton LA, Chinwalla AT, Pepin KH, Gish WR, Chissoe SL, Wendl MC, Delehaunty KD, Miner TL, Delehaunty A, Kramer JB, Cook LL, Fulton RS, Johnson DL, Minx PJ, Clifton SW, Hawkins T, Branscomb E, Predki P, Richardson P, Wenning S, Slezak T, Doggett N, Cheng JF, Olsen A, Lucas S, Elkin C, Uberbacher E, Frazier M, Gibbs RA, Muzny DM, Scherer SE, Bouck JB, Sodergren EJ, Worley KC, Rives CM, Gorrell JH, Metzker ML, Naylor SL, Kucherlapati RS, Nelson DL, Weinstock GM, Sakaki Y, Fujiyama A, Hattori M, Yada T, Toyoda A, Itoh T, Kawagoe C, Watanabe H, Totoki Y, Taylor T, Weissenbach J, Heilig R, Saurin W, Artiguenave F, Brottier P, Bruls T, Pelletier E, Robert C, Wincker P, Smith DR, Doucette-Stamm L, Rubenfield M, Weinstock K, Lee HM, Dubois J, Rosenthal A, Platzer M, Nyakatura G, Taudien S, Rump A, Yang H, Yu J, Wang J, Huang G, Gu J, Hood L, Rowen L, Madan A, Qin S, Davis RW, Federspiel NA, Abola AP, Proctor MJ, Myers RM, Schmutz J, Dickson M, Grimwood J, Cox DR, Olson MV, Kaul R, Raymond C, Shimizu N, Kawasaki K, Minoshima S, Evans GA, Athanasiou M, Schultz R, Roe BA, Chen F, Pan H, Ramser J, Lehrach H, Reinhardt R, McCombie WR, de la Bastide M, Dedhia N, Blocker H, Hornischer K, Nordsiek G, Agarwala R, Aravind L, Bailey JA, Bateman A, Batzoglou S, Birney E, Bork P, Brown DG, Burge CB, Cerutti L, Chen HC, Church D, Clamp M, Copley RR, Doerks T, Eddy SR, Eichler EE, Furey TS, Galagan J, Gilbert JG, Harmon C, Hayashizaki Y, Haussler D, Hermjakob H, Hokamp K, Jang W, Johnson LS, Jones TA, Kasif S, Kaspryzk A, Kennedy S, Kent WJ, Kitts P, Koonin EV, Korf I, Kulp D, Lancet D, Lowe TM, McLysaght A, Mikkelsen T, Moran JV, Mulder N, Pollara VJ, Ponting CP, Schuler G, Schultz J, Slater G, Smit AF, Stupka E, Szustakowski J, Thierry-Mieg D, Thierry-Mieg J, Wagner L, Wallis J, Wheeler R, Williams A, Wolf YI, Wolfe KH, Yang SP, Yeh RF, Collins F, Guyer MS, Peterson J, Felsenfeld A, Wetterstrand KA, Patrinos A, Morgan MJ, Szustakowki J, de Jong P, Catanese JJ, Osoegawa K, Shizuya H, Choi S, Chen YJ. International Human Genome Sequencing Consortium. Initial sequencing and analysis of the human genome. Nature. 2001. 409:860–921.2. Doolittle WF, Sapienza C. Selfish genes, the phenotype paradigm and genome evolution. Nature. 1980. 284:601–603.
Article3. Ohno S. So much 'junk' DNA in our genome in Brookhaven Symposia in Biology. Brookhaven Symp Biol. 1972. 23:366–370.4. Smit AF. Interspersed repeats and other mementos of transposable elements in mammalian genomes. Curr Opin Genet Dev. 1999. 9:657–663.
Article5. Chu WM, Ballard R, Carpick BW, Williams BR, Schmid CW. Potential Alu function: regulation of the activity of double-stranded RNA-activated kinase PKR. Mol Cell Biol. 1998. 18:58–68.
Article6. Ostertag EM, Kazazian HH Jr. Biology of mammalian L1 retrotransposons. Annu Rev Genet. 2001. 35:501–538.
Article7. Brosius J. RNAs from all categories generate retrosequences that may be exapted as novel genes or regulatory elements. Gene. 1999. 238:115–134.
Article8. Velculescu VE, Zhang L, Vogelstein B, Kinzler KW. Serial analysis of gene expression. Science. 1995. 270:484–487.
Article9. Lercher MJ, Urrutia AO, Hurst LD. Clustering of housekeeping genes provides a unified model of gene order in the human genome. Nat Genet. 2002. 31:180–183.
Article10. Cremer T, Cremer C. Chromosome territories, nuclear architecture and gene regulation in mammalian cells. Nat Rev Genet. 2001. 2:292–301.
Article11. Andrulis ED, Neiman AM, Zappulla DC, Sternglanz R. Perinuclear localization of chromatin facilitates transcriptional silencing. Nature. 1998. 394:592–595.
Article12. Boyle S, Gilchrist S, Bridger JM, Mahy NL, Ellis JA, Bickmore WA. The spatial organization of human chromosomes within the nuclei of normal and emerin-mutant cells. Hum Mol Genet. 2001. 10:211–219.
Article13. Tanabe H, Muller S, Neusser M, von Hase J, Calcagno E, Cremer M, Solovei I, Cremer C, Cremer T. Evolutionary conservation of chromosome territory arrangements in cell nuclei from higher primates. Proc Natl Acad Sci USA. 2002. 99:4424–4429.
Article14. Dillon N, Festenstein R. Unravelling heterochromatin: competition between positive and negative factors regulates accessibility. Trends Genet. 2002. 18:252–258.
Article15. Wolffe AP, Matzke MA. Epigenetics: regulation through repression. Science. 1999. 286:481–486.
Article16. Colot V, Rossignol JL. Eukaryotic DNA methylation as an evolutionary device. Bioessays. 1999. 21:402–411.
Article17. Eden S, Hashimshony T, Keshet I, Cedar H, Thorne AW. DNA methylation models histone acetylation. Nature. 1998. 394:842.
Article18. Medstrand P, van de Lagemaat LN, Mager DL. Retroelement distributions in the human genome: variations associated with age and proximity to genes. Genome Res. 2002. 12:1483–1495.
Article19. Urrutia AO, Hurst LD. The signature of selection mediated by expression on human genes. Genome Res. 2003. 13:2260–2264.
Article20. Frith MC, Spouge JL, Hansen U, Weng Z. Statistical significance of clusters of motifs represented by position specific scoring matrices in nucleotide sequences. Nucleic Acids Res. 2002. 30:3214–3224.
Article21. Vinogradov AE. Isochores and tissue-specificity. Nucleic Acids Res. 2003. 31:5212–5220.
Article22. Schuler GD, Boguski MS, Stewart EA, Stein LD, Gyapay G, Rice K, White RE, Rodriguez-Tome P, Aggarwal A, Bajorek E, Bentolila S, Birren BB, Butler A, Castle AB, Chiannilkulchai N, Chu A, Clee C, Cowles S, Day PJ, Dibling T, Drouot N, Dunham I, Duprat S, East C, Hudson TJ. A gene map of the human genome. Science. 1996. 274:540–546.
Article
- Full Text Links
-
- Actions
-
Cited
- CITED
-
- Close
- Share
-
- Similar articles
-
- Structural Variation of Alu Element and Human Disease
- Periodic Explosive Expansion of Human Retroelements Associated with the Evolution of the Hominoid Primate
- High Correlation between Alu Elements and the Conversion of 3' UTR of mRNAs Processed Pseudogenes
- Gastric Mucosal Atrophy Impedes Housekeeping Gene Methylation in Gastric Cancer Patients
- Association between the Alu Insertion/Deletion Polymorphism in the Tissue-Type Plasminogen Activator Gene and Mirtazapine Response in Koreans with Major Depression
