Korean J Gastroenterol.
2013 Jan;61(1):9-16. 10.4166/kjg.2013.61.1.9.
Metabolomic Study of a Diagnostic Model for the Metabolites of Stool Fat
- Affiliations
-
- 1Department of Bioscience and Biotechnology, Bio/Molecular Informatics Center, Konkuk University, Seoul, Korea.
- 2Department of Internal Medicine, Konkuk University School of Medicine, Seoul, Korea. sunyoung@kuh.ac.kr
- KMID: 1775781
- DOI: http://doi.org/10.4166/kjg.2013.61.1.9
Abstract
- BACKGROUND/AIMS
Metabolomics is a powerful tool for measuring low-molecular-weight metabolites in an organism at a specified time under specific environmental conditions. The aim of this study was to determine the usefulness of metabolomics in identifying the metabolites in stool-fat-positive specimens, and to establish whether the results could be used to predict the long-term prognosis.
METHODS
Fecal specimens were collected from 52 subjects with bowel habit change. The subjects were accessed using Rome III questionnaires and Bristol stool scale form, and followed after three years. The feces samples were centrifuged and the resulting extracts reconstituted for liquid chromatography/mass spectrometry analysis. The datasets were autoscaled, log-transformed, and mean-centered in a column-wise fashion prior to principal-components analysis and partial least-squares-discrimination analysis modeling.
RESULTS
Fecal samples from 10 of the 52 patients gave a positive stool-fat result of 30-100 microm; those of the remaining 42 contained neither fatty acids nor neutral fats. The peak intensities of lithocholic acid (p=0.001), lysophosphatidyl ethanolamine (lysoPE) 16:0 (p=0.015), and lysoPE 18:1/0:0 (p=0.014) were correlated with the size of the fatty acid. Subjects with positive stool-fat result showed higher score in Bristol stool scale form than those with negative stool-fat result at initial (p=0.040) and after three years (p=0.012).
CONCLUSIONS
The metabolomic assay of stool fatty acid revealed mainly lysoPEs and lithocholic acid. The size of the fatty acid was correlated with higher concentrations of lysoPEs and lithocholic acid in stool-fat-test-positive specimens and related to loose stool even after three years of follow-up period.
Keyword
MeSH Terms
-
Adult
Aged
Chromatography, High Pressure Liquid
Fatty Acids/*analysis
Feces/*chemistry
Female
Follow-Up Studies
Humans
Least-Squares Analysis
Lithocholic Acid/analysis
Lysophospholipids/analysis
Male
*Metabolomics
Middle Aged
Principal Component Analysis
Questionnaires
Spectrometry, Mass, Electrospray Ionization
Fatty Acids
Lysophospholipids
Lithocholic Acid
Figure
-
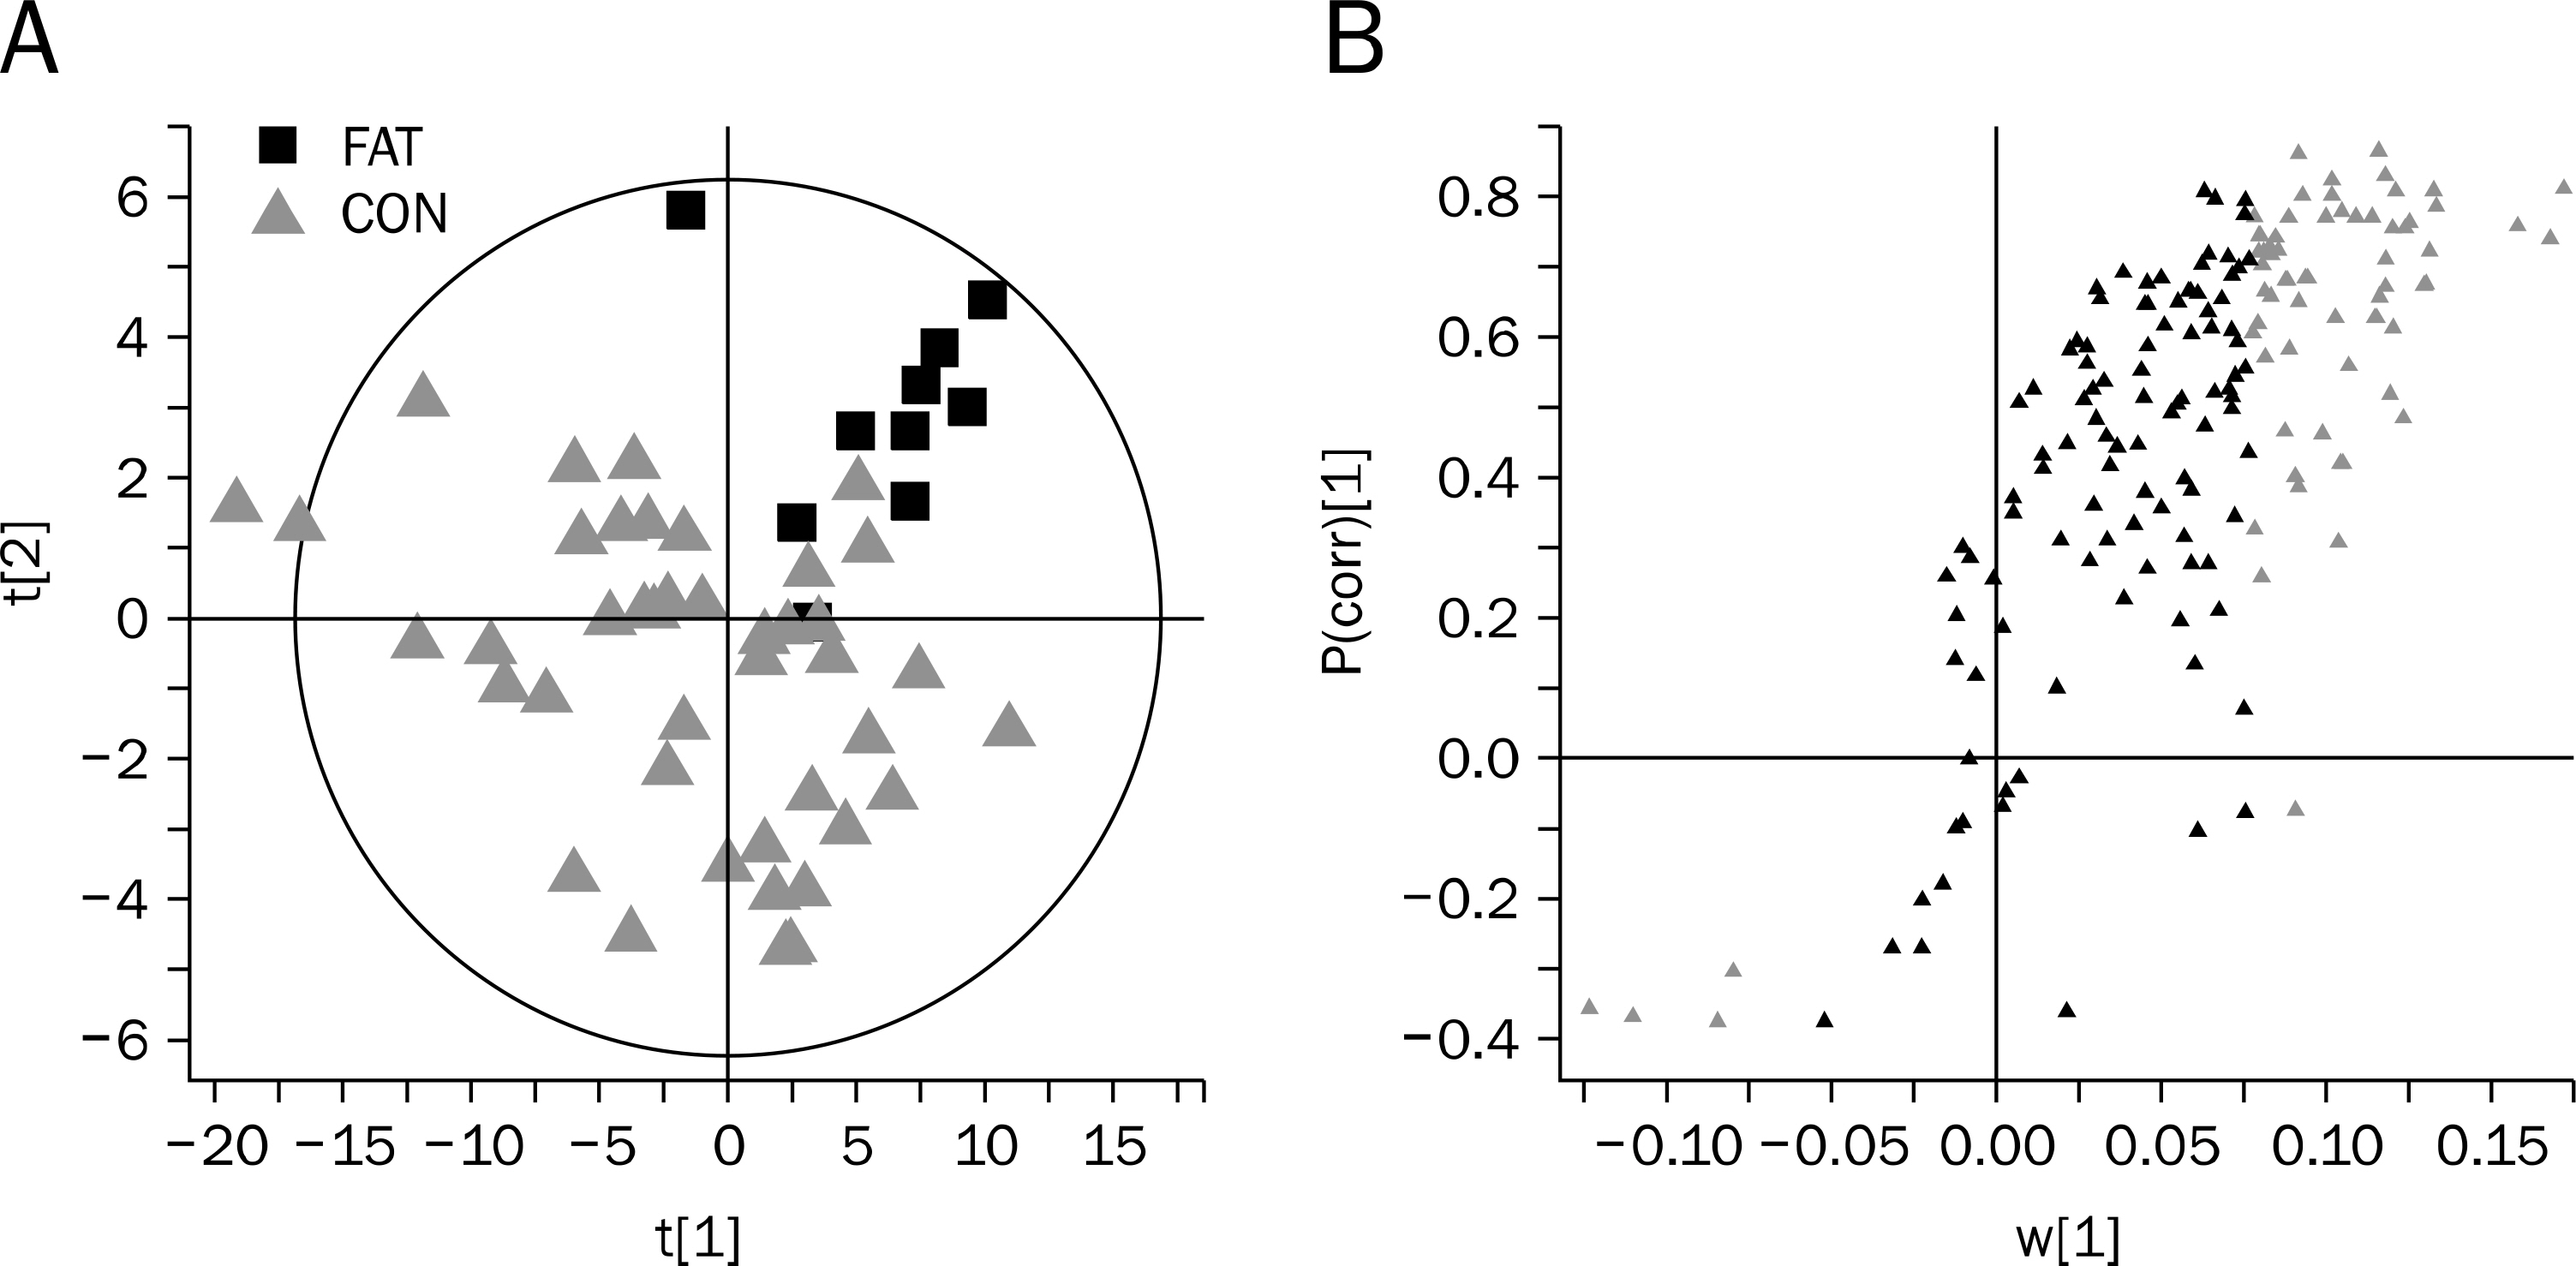
Fig. 1. Partial least-squares discrimination analysis of liquid chromatography/ mass spectrometry-based metabolic profiles for the stool-fat-positive (FAT) group (n=10) and the stool-fat-negative (CON) group (n=42). (A) Score plot between FAT (square) and CON (tri-angle). (B) Loading plot for 66 variables selected by VIP>1. t[1], variables accounted for 31.6% of the measured variance; P (corr), positive correlation.
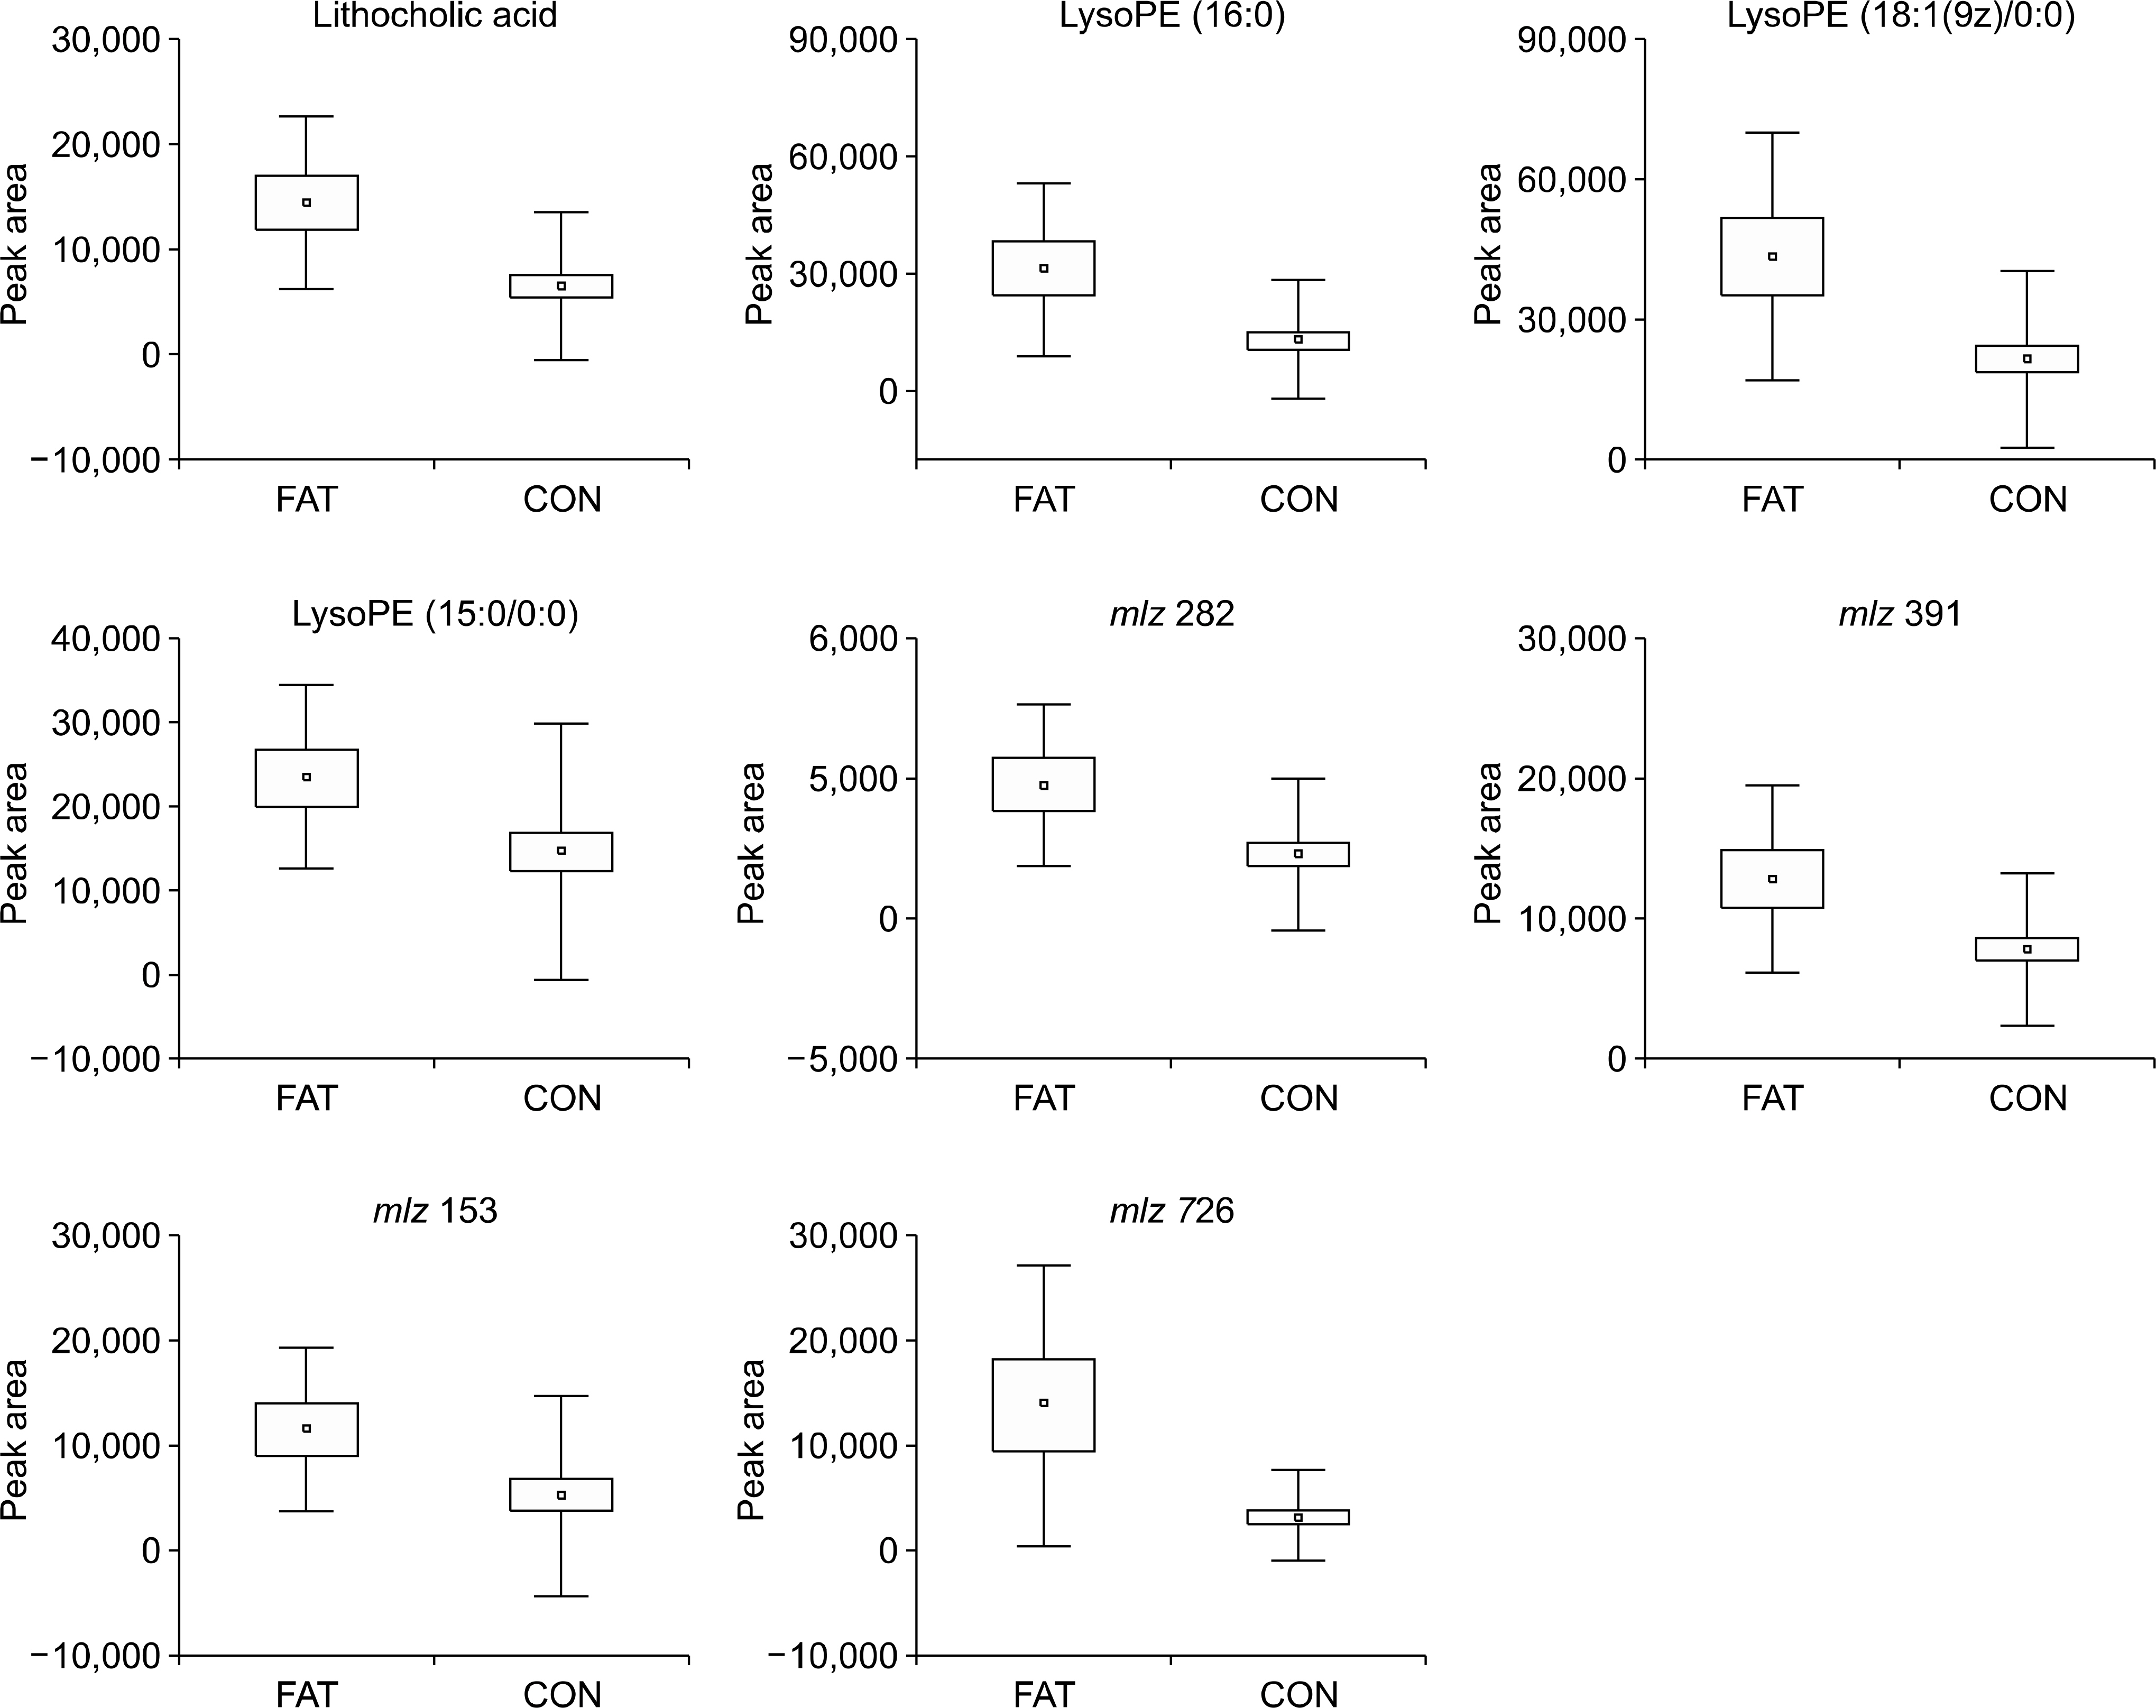
Fig. 2. Box and whiskers plot of metabolite changes in the stool-fat-positive (FAT) group and the stool-fat-negative (CON) group. The findings for eight metabolites differed significantly between the two groups (p<0.05). m/z, mass-to-charge ration (m/z) data; LysoPE, lysophosphatidyl ethanolamine.
Reference
-
References
1. Hofmann AF, Manier JW. Fecal fat concentration: determinants and diagnostic value. Gastroenterology. 1985; 89:231–233.
Article2. Feurle GE. Diagnostic value of fecal fat concentration. Gastroenterology. 1985; 88:857–858.
Article3. VAN DE KAMER JH, WEIJERS HA, DICKE WK. Coeliac disease. IV. An investigation into the injurious constituents of wheat in connection with their action on patients with coeliac disease. Acta Paediatr. 1953; 42:223–231.4. Bo-Linn GW, Fordtran JS. Fecal fat concentration in patients with steatorrhea. Gastroenterology. 1984; 87:319–322.
Article5. Bai JC, Andrüsh A, Matelo G, et al. Fecal fat concentration in the differential diagnosis of steatorrhea. Am J Gastroenterol. 1989; 84:27–30.6. Thompson G. Fat absorption and metabolism. Gastroenterol Jpn. 1984; 19:251–259.
Article7. Smith CA, Want EJ, O'Maille G, Abagyan R, Siuzdak G. XCMS: processing mass spectrometry data for metabolite profiling using nonlinear peak alignment, matching, and identification. Anal Chem. 2006; 78:779–787.
Article8. Capanoglu E, Beekwilder J, Boyacioglu D, Hall R, de Vos R. Changes in antioxidant and metabolite profiles during production of tomato paste. J Agric Food Chem. 2008; 56:964–973.
Article9. Xie G, Plumb R, Su M, et al. Ultra-performance LC/TOF MS analysis of medicinal Panax herbs for metabolomic research. J Sep Sci. 2008; 31:1015–1026.10. Fernández-Cáceres PL, Martín MJ, Pablos F, González AG. Differentiation of tea (Camellia sinensis) varieties and their geographical origin according to their metal content. J Agric Food Chem. 2001; 49:4775–4779.
Article11. Chen Q, Zhao J, Lin H. Study on discrimination of Roast green tea (Camellia sinensis L.) according to geographical origin by FT-NIR spectroscopy and supervised pattern recognition. Spectrochim Acta A Mol Biomol Spectrosc. 2009; 72:845–850.
Article12. Llorach R, Martánez-Sánchez A, Tomás-Barberán FA, Gil MI, Ferreres F. Characterisation of polyphenols and antioxidant properties of five lettuce varieties and escarole. Food Chem. 2008; 108:1028–1038.
Article13. Khouri MR, Huang G, Shiau YF. Sudan stain of fecal fat: new insight into an old test. Gastroenterology. 1989; 96:421–427.
Article14. Pongsuwan W, Fukusaki E, Bamba T, Yonetani T, Yamahara T, Kobayashi A. Prediction of Japanese green tea ranking by gas chromatography/mass spectrometry-based hydrophilic metabolite fingerprinting. J Agric Food Chem. 2007; 55:231–236.
Article15. Pongsuwan W, Bamba T, Yonetani T, Kobayashi A, Fukusaki E. Quality prediction of Japanese green tea using pyrolyzer cou-pled GC/MS based metabolic fingerprinting. J Agric Food Chem. 2008; 56:744–750.
Article16. Faloon WW, Rubulis A, Knipp J, Sherman CD, Flood MS. Fecal fat, bile acid, and sterol excretion abd biliary lipid changes in jejunoileostomy patients. Am J Clin Nutr. 1977; 30:21–31.
- Full Text Links
-
- Actions
-
Cited
- CITED
-
- Close
- Share
-
- Similar articles
-
- Predicting Clinically Significant Prostate Cancer Using Urine Metabolomics via Liquid Chromatography Mass Spectrometry
- Specific urinary metabolites in canine mammary gland tumors
- Metabolomic analysis of healthy human urine following administration of glimepiride using a liquid chromatography-tandem mass spectrometry
- Time-Dependent Changes in the Bladder Muscle Metabolome After Traumatic Spinal Cord Injury in Rats Using Metabolomics
- Quantification of 11 metabolites in rat urine after exposure to organophosphates
