Perfusion Imaging of the Brain Using Z-Score and Dynamic Images Obtained by Subtracting Images from before and after Contrast Injection
- Affiliations
-
- 1Department of Diagnostic Radiology, Dong-A University College of Medicine, Korea. sschoi317@yahoo.co.kr
- 2Department of Radiology, University of Minnesota School of Medicine.
- KMID: 1118818
- DOI: http://doi.org/10.3348/kjr.2004.5.3.143
Abstract
OBJECTIVE
The aim of this study was to examine the feasibility of perfusion imaging of the brain using the Z-score and subtraction dynamic images obtained from susceptibility contrast MR images. MATERIALS AND METHODS: Five patients, each with a normal MRI, Moya-moya, a middle cerebral artery occlusion, post-trauma syndrome, and a metastatic brain tumor, were selected for a presentation. A susceptibility-contrast echo-planar image after a routine MRI was taken as the source image with a rapid manual injection of 0.1 mmol/kg of Gd-DTPA. The inflow and washout patterns were observed from the time-signal intensity curve of the serial scans using the standard program of an MRI machine. The repeated Z-score images of the peak and late phases were made using the threshold Z-score values between 1.4 and 2.0 in four to five studies of the pre-contrast, peak, and late phases. Dynamic subtraction images were produced by subtracting sequential post-contrast images from a pre-contrast image and coloring these images using a pseudocolor mapping method. RESULTS: In the diseases with perfusion abnormalities, the Z-score images revealed information about the degree of perfusion during the peak and late phases. However, the quality varied with the Z-score threshold and the studies selected in a group. The dynamic subtraction images were of sufficient quality with no background noise and more clearly illustrated the temporal changes in perfusion and delayed perfusion. CONCLUSION: The Z-scores and dynamic subtraction images illustrated the degree of perfusion and sequential changes in the pattern of perfusion, respectively. These images can be used as a new complimentary method for observing the perfusion patterns in brain diseases.
MeSH Terms
Figure
-
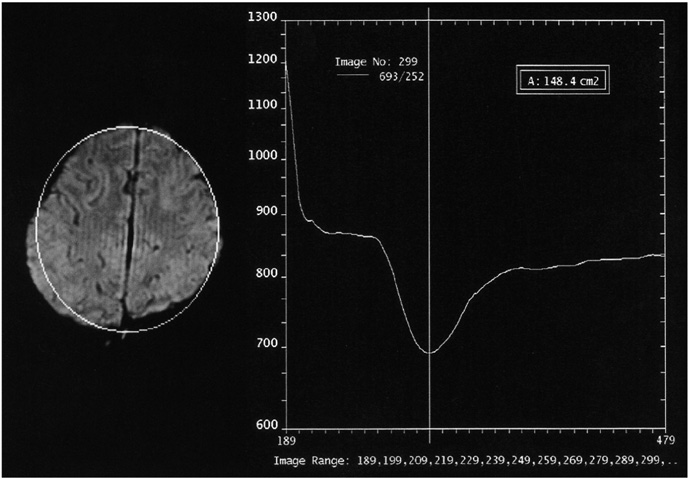
Fig. 1 The time-signal intensity curve (right) shows markedly decreased signal intensity during the peak arrival of the contrast agent, followed by the recovery of the signal intensity according to the washout of the contrast media as a function of time at the region of interest (left).
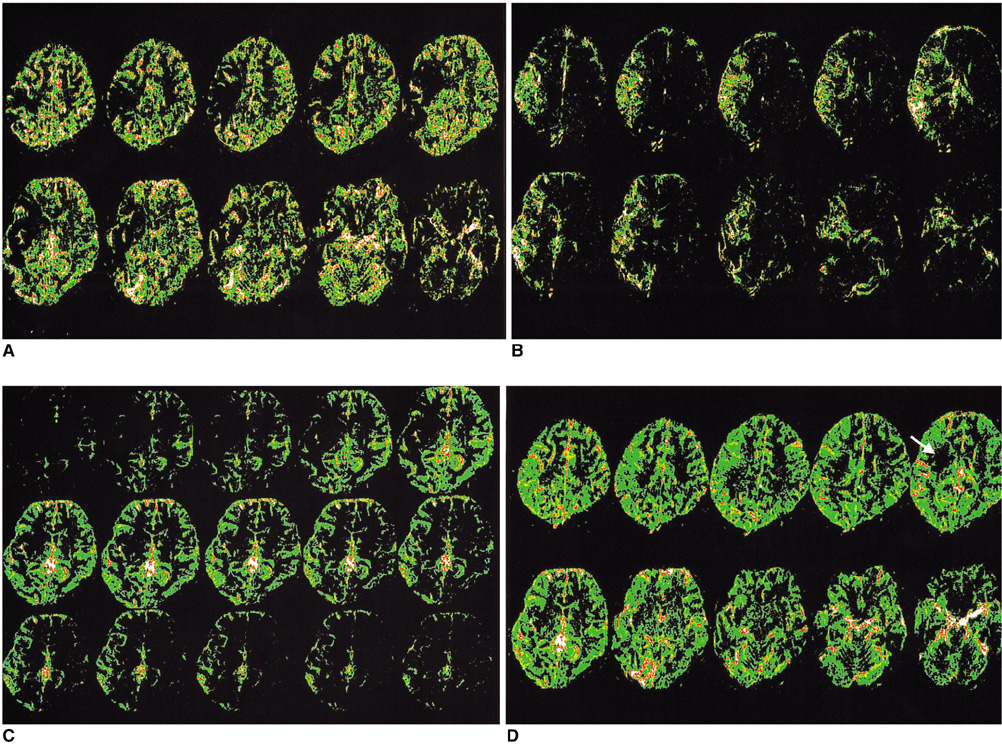
Fig. 2 A 26-year-old female with arrhythmia showed a right middle cerebral artery occlusion on the magnetic resonance angiography and high signal intensity at the right basal ganglia on the diffusion weighted image (not shown) 3 hours after developing a left hemiplegia. A. The peak Z-score image shows perfusion defects at the right posterior frontal, temporal area and the basal ganglia. B. The late Z-score image shows delayed perfusion at the perfusion defect areas in A. C. The subtraction dynamic image of a level show initially decreased perfusion with delayed and persisted perfusion at the right frontal, temporal area and the basal ganglia. Images from the top left to the bottom right show the sequential changes in the signal intensity (perfusion) every 1.32 seconds. D. Added images of a peak and a late phase subtraction image show a perfusion defect only at the right basal ganglia (arrow), which is consistent with a diffusion weighted image (not shown).
Cited by 3 articles
-
Quantitative Assessment of Tumor Responses after Radiation Therapy in a DLD-1 Colon Cancer Mouse Model Using Serial Dynamic Contrast-Enhanced Magnetic Resonance Imaging
Sung Jun Ahn, Woong Sub Koom, Chan Sik An, Joon Seok Lim, Seung-Koo Lee, Jin-Suck Suh, Ho-Taek Song
Yonsei Med J. 2012;53(6):1147-1153. doi: 10.3349/ymj.2012.53.6.1147.Determination of the rCBF in the Amygdala and Rhinal Cortex Using a FAIR-TrueFISP Sequence
Burkhard Ludescher, Petros Martirosian, Uwe Klose, Thomas Nägele, Fritz Schick, Ulrike Ernemann
Korean J Radiol. 2011;12(5):554-558. doi: 10.3348/kjr.2011.12.5.554.Correlations of 3T DCE-MRI Quantitative Parameters with Microvessel Density in a Human-Colorectal-Cancer Xenograft Mouse Model
Sung Jun Ahn, Chan Sik An, Woong Sub Koom, Ho-Taek Song, Jin-Suck Suh
Korean J Radiol. 2011;12(6):722-730. doi: 10.3348/kjr.2011.12.6.722.
Reference
-
1. Bihan DL, Turner R. Stark DD, Bradley WG, editors. Diffusion and perfusion. Magnetic resonance imaging. 1999. 2nd ed. St. Louis, Mo: Mosby;335–371.2. Hagen T, Bartylla K, Piepgras U. Correlation of cerebral blood flow measured by stable xenon CT and perfusion MRI. J Comput Assist Tomogr. 1999. 23:257–264.3. Lythgoe DJ, Ostergaard L, William SC, et al. Quantitative perfusion imaging in carotid artery stenosis using dynamic susceptibility contrast-enhanced magnetic resonance imaging. Magn Reson Imaging. 2000. 18:1–11.4. Barbier EL, Lamalle L, Decorps M. Methodology of brain perfusion imaging. J Magn Reson Imaging. 2001. 13:496–520.5. Gibby WA. Zimmerman RA, Gibby WA, Carmody RF, editors. Magnetic resonance angiography and flow imaging. Neuroimaging, clinical and physical principles. 2000. New York: Springer-Verlag;212–219.6. Cha S, Knopp EA, Johnson G, Wetzel SG, Litt AW, Zagzag D. Intracranial mass lesions: dynamic contrast-enhanced susceptibility-weighted echo-planar perfusion MR imaging. Radiology. 2002. 223:11–29.7. Forman SD, Cohen JD, Fitzgerald M, Eddy WF, Mintun MA, Noll DC. Improved assessment of significant activation in functional magnetic resonance imaging (fMRI): use of a cluster-size threshold. Magn Reson Med. 1995. 33:636–647.8. Weiger M, Pruessmann KP, Osterbauer R, Bornert P, Boesiger P, Jezzard P. Sensitivity-encoded single-shot spiral imaging for reduced susceptibility artifacts in BOLD fMRI. Magn Reson Med. 2002. 48:860–866.9. Knopp EA, Cha S, Johnson G, et al. Glial neoplasms: Dynamic contrast-enhanced T2* weighted MR imaging. Radiology. 1999. 211:791–798.10. Wittsack HJ, Ritzl A, Fink GR, et al. MR imaging in acute stroke: diffusion-weighted and perfusion imaging parameters for predicting infarct size. Radiology. 2002. 222:397–403.11. Neumann-Haefelin T, Wittsack HJ, Wenserski F, et al. Diffusion- and perfusion-weighted MRI. The DWI/PWI mismatch region in acute stroke. Stroke. 1999. 30:1591–1597.12. Roberts HC, Roberts TPL, Brasch RC, Dillon WP. Quantitative measurement of microvascular permeability in human brain tumors achieved using dynamic contrast-enhanced MR imaging: correlation with histologic grade. AJNR Am J Neuroradiol. 2000. 21:891–899.13. Provenzale JM, Wang GR, Brenner T, Petrella JR, Sorensen AG. Comparison of permeability in high-grade and low-grade brain tumors using dynamic susceptibility contrast MR imaging. AJR Am J Roentgenol. 2002. 178:711–716.14. Cha S, Knopp EA, Johnson G, et al. Dynamic contrast-enhanced T2*-weighted MR imaging of recurrent malignant gliomas treated with thalidomide and carboplatin. AJNR Am J Neuroradiol. 2000. 21:881–890.15. Sugahara T, Korogi Y, Tomiguchi S, et al. Posttherapeutic intraaxial brain tumor: the value of perfusion-sensitive contrast-enhanced MR imaging for differentiating tumor recurrence from nonneoplastic contrast-enhancing tissue. AJNR Am J Neuroradiol. 2000. 21:901–909.16. Law M, Cha S, Knopp EA, Johnson G, Arnett J, Litt AW. High-grade gliomas and solitary metastases: differentiation by using perfusion and proton spectroscopic MR imaging. Radiology. 2002. 222:715–721.17. Henry RG, Vigneron DB, Fischbein NJ, et al. Comparison of relative cerebral blood volume and proton spectroscopy in patients with treated gliomas. AJNR Am J Neuroradiol. 2000. 21:357–366.18. Kiselev VG. On the theoretical basis of perfusion measurements by dynamic susceptibility contrast MRI. Magn Reson Med. 2001. 46:1113–1122.19. Vonken EP, van Osch MJ, Bakker CJ, Viergever MA. Simultaneous quantitative cerebral perfusion and Gd-DTPA extravasation measurement with dual-echo dynamic susceptibility contrast MRI. Magn Reson Med. 2000. 43:820–827.20. Yamada K, Gonzalez RG, Ostergaard L, et al. Iron-induced susceptibility effect at the globus pallidus causes underestimation of flow and volume on dynamic susceptibility contrast-enhanced MR perfusion images. AJNR Am J Neuroradiol. 2002. 23:1022–1029.21. Perkio J, Aronen H, Kangasmaki A, et al. Evaluation of four postprocessing methods for determination of cerebral blood volume and mean transit time by dynamic susceptibility contrast imaging. Magn Reson Med. 2002. 47:973–981.22. Smith AM, Grandin CB, Duprez T, Mataigne F, Cosnard G. Whole brain quantitative CBF, CBV, and MTT measurements using MRI bolus tracking: implementation and application to data acquired from hyperacute stroke patients. J Magn Reson Imaging. 2000. 12:400–410.23. Simonsen CZ, Rohl L, Vestergaard-Poulsen P, Gyldensted C, Anderson G, Ostergarrd L. Final infarct size after acute stroke: prediction with flow heterogeneity. Radiology. 2002. 225:269–275.24. Jackson A, Kassner A, Annesley-Williams D, Reid H, Zhu XP, Li KL. Abnormalities in the recirculation phase of contrast agent bolus passage in cerebral gliomas: comparison with relative blood volume and tumor grade. AJNR Am J Neuroradiol. 2002. 23:7–14.
- Full Text Links
-
- Actions
-
Cited
- CITED
-
- Close
- Share
-
- Similar articles
-
- Perfusion MRI of the Brain Using Oxygen Inhalation
- Adenomyosis of the Uterus: Recognition of a Characteristic Enhancement Pattern on Contrast-enhanced Dynamic MRI
- The Study of Renal Perfusion Image in Rabbit by Harmonic Ultrasound with Microbble Contrast Agent in Comparison with 99mTc-DTPA: Focusing on US Scan Technique and Concentration of Contrast Agent
- Usefulness of Dynamic Magnetic Resonance Imaging in Pituitary Microadenomas
- Effects of Magnetization Transfer in Gadolinium-Enhanced Brain MR Imaging
