Serial MR Imaging of Intramuscular Hematoma: Experimental Study in a Rat Model with the Pathologic Correlation
- Affiliations
-
- 1Department of Radiology, Daejeon St. Mary's Hospital, The Catholic University of Korea, Daejeon 301-723, Korea.
- 2Department of Radiology, Chungnam National University, School of Medicine, Daejeon 301-721, Korea.
- 3Department of Pathology, Daejeon St. Mary's Hospital, The Catholic University of Korea, Daejeon 301-723, Korea.
- 4Department of Rehabilitation Medicine, Daejeon St. Mary's Hospital, The Catholic University of Korea, Daejeon 301-723, Korea. ces612@nate.com
- KMID: 991684
- DOI: http://doi.org/10.3348/kjr.2011.12.1.66
Abstract
OBJECTIVE
We wanted to demonstrate the temporal changes of the magnetic resonance imaging (MRI) findings in experimentally-induced intramuscular hematomas in rats and to correlate these data with the concurrent pathologic observations.
MATERIALS AND METHODS
Intramuscular hematoma was induced in 30 rats. The MR images were obtained at 1, 4, 7 and 10 days and at 2, 3, 4, 6 and 8 weeks after muscle injury. The characteristic serial MRI findings were evaluated and the relative signal intensities were calculated. Pathologic specimens were obtained at each time point.
RESULTS
On the T1-weighted imaging (T1WI), the intramuscular hematomas exhibited isointensity compared to that of muscle or the development of a high signal intensity (SI) rim on day one after injury. The high SI persisted until eight weeks after injury. On the T2-weighted imaging (T2WI), the hematomas showed high SI or centrally low SI on day one after injury, and mainly high SI after four days. A dark signal rim was apparent after seven days, which was indicative of hemosiderin on the pathology. The gradient echo (GRE) imaging yielded dark signal intensities at all stages.
CONCLUSION
Unlike brain hematomas, experimentally-induced intramuscular hematomas show increased SI on both the T1WI and T2WI from the acute stage onward, and this is pathologically correlated with a rich blood supply and rapid healing response to injury in the muscle. On the T2WI and GRE imaging, high SI with a peripheral dark signal rim is apparent from seven days to the chronic stage.
Keyword
MeSH Terms
Figure
-
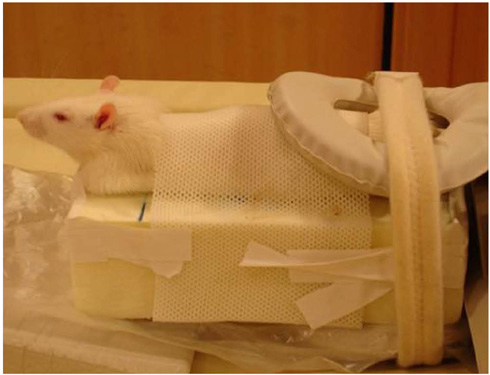
Fig. 1 Rat was fixed on special mount to hold fore- and hind-limbs in prone position. SENSE Flex S coil was used on both hind-limbs.

Fig. 2 MR imaging of intramuscular hematoma one day after injury. A. Axial spin echo T1-weighted image shows iso-signal intensity compared to adjacent muscle (arrows). Value of relative signal intensity is 1.22. B. Axial T2-weighted image shows heterogeneous high signal intensity lesion (arrow). Value of relative signal intensity is 5.71. C. Gradient echo image shows central dark signal intensity with high signal rim. Value of central relative signal intensity is 0.18 and that of peripheral relative signal intensity is 1.34. D, E. Microscopic findings of intramuscular hematoma (arrows) (Hematoxylin & Eosin stain, original magnification in D, × 10; in E, × 200) show hemorrhage, necrosis with neutrophils, acute inflammation and red blood cells, which is all indicative of acute stage. ○= region of interest for measuring relative signal intensity
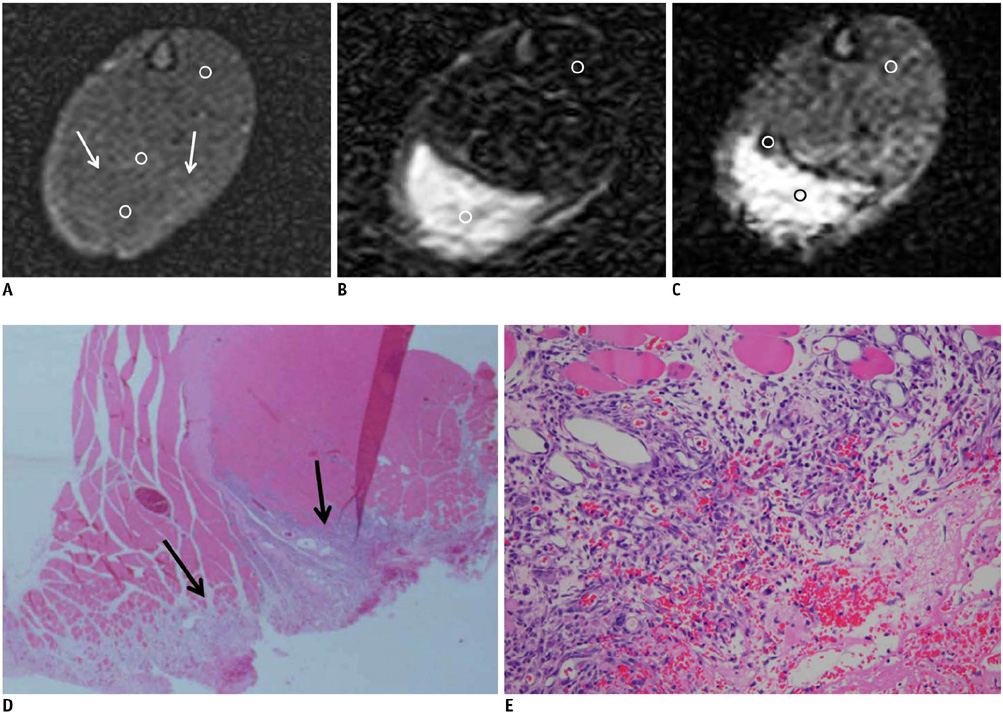
Fig. 3 MR images of intramuscular hematoma four days after injury. A. Axial spin echo T1-weighted image shows isosignal intensity with peripheral slightly increased signal intensity rim (arrows). Value of central relative signal intensity is 1.1 and that of peripheral relative signal intensity is 1.3. B. Axial T2-weighted image shows heterogeneous high signal intensity lesion (relative signal intensity: 8.27). C. Gradient echo image shows central high signal intensity with a peripheral dark signal rim (central relative signal intensity: 2.73, peripheral relative signal intensity: 0.67). D, E. Microscopic findings of intramuscular hematoma (arrows) (Hematoxylin & Eosin stain, original magnification in D, × 10; in E × 400). After fourth day, hematoma replaces granulation tissue. Necrotic muscle fibers, hemorrhage and inflammatory cells are seen. ○= region of interest for measuring relative signal intensity

Fig. 4 MR imaging of intramuscular hematoma seven days after injury. A. Axial spin echo T1-weighted image shows slightly increased signal intensity (arrows) and high signal nodule. Value of relative signal intensity is 1.49. B. Axial T2-weighted image shows heterogeneous central high signal intensity and peripheral dark signal rim (central relative signal intensity: 12.2, peripheral relative signal intensity: 0.78). C. Gradient echo image shows central high signal intensity with peripheral dark signal rim (central relative signal intensity: 2.86, peripheral relative signal intensity: 0.33). D, E. Microscopic findings of intramuscular hematoma (arrows) (Hematoxylin & Eosin stain, original magnification in D, × 10; in E × 400) show some hemosiderin-laden macrophages (arrows in E), fibrosis and regenerating muscle bundle fibers. ○= region of interest for measuring relative signal intensity
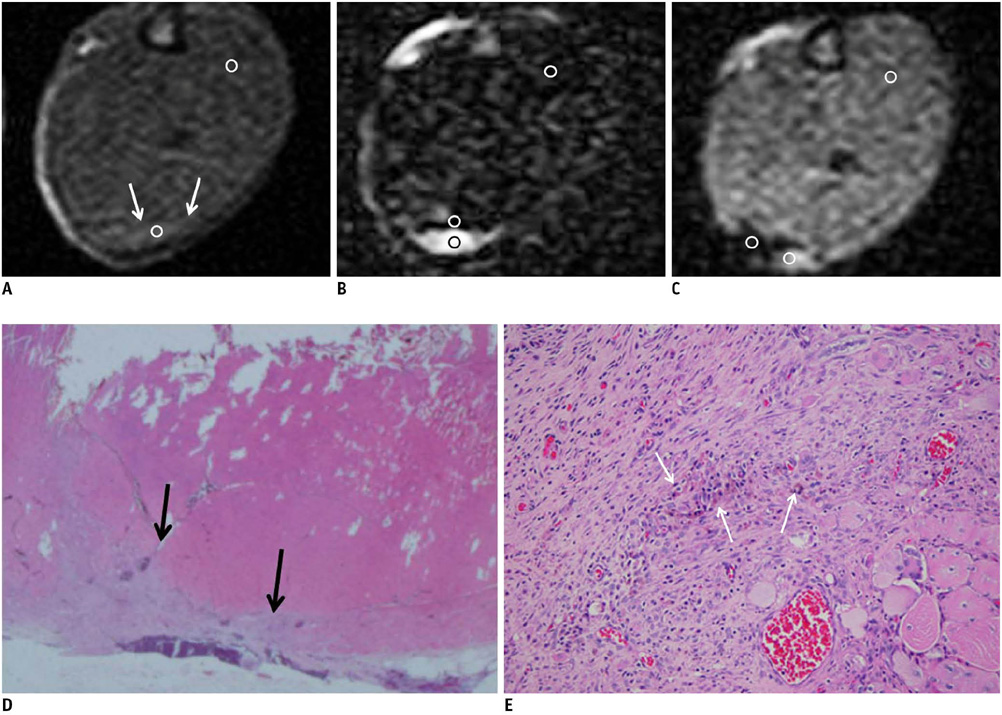
Fig. 5 MR imaging of intramuscular hematoma 10 days after injury. Size of hematoma is decreased. A. Axial spin echo T1-weighted image shows slightly increased signal intensity (arrows). Value of relative signal intensity is 1.37. B, C. Axial T2-weighted image (B) and gradient echo image (C) show central high signal intensity and peripheral dark signal rim (central relative signal intensity: 11.9, peripheral relative signal intensity: 0.64 in B, central relative signal intensity: 1.94, peripheral relative signal intensity: 0.32 in C). D, E. Microscopic findings of intramuscular hematoma (arrows) (Hematoxylin & Eosin stain, original magnification in D, × 10; in E × 200). After 10th day, collections of some hemosiderin-laden macrophages and fibrosis (arrows in E) are easily identified. ○= region of interest for measuring relative signal intensity
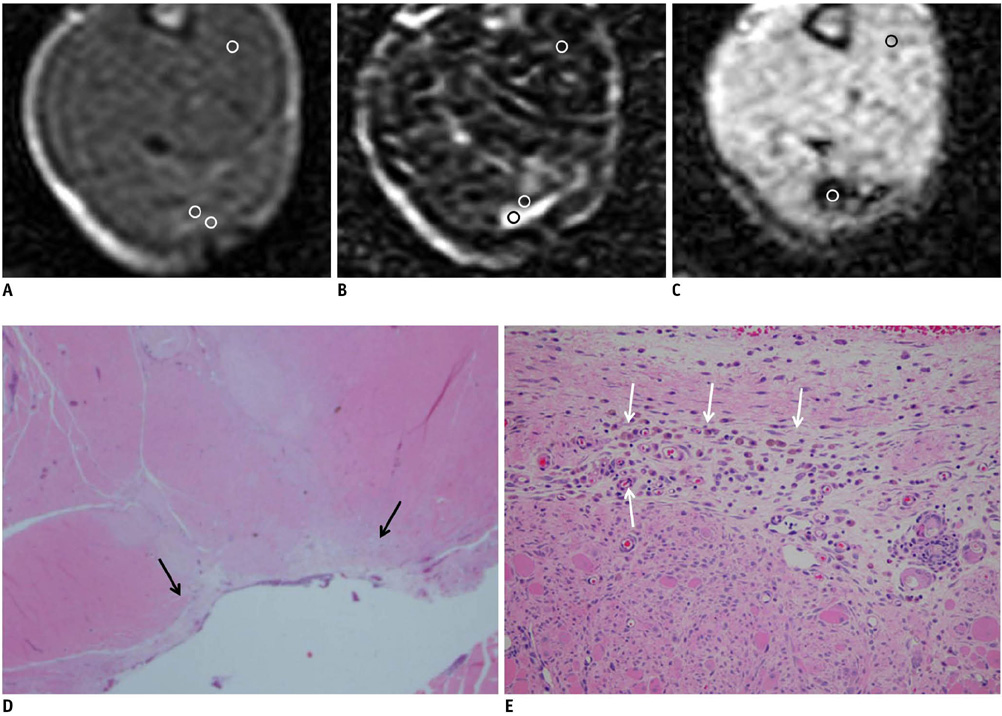
Fig. 6 MR imaging of intramuscular hematoma three weeks after injury. A. Axial spin echo T1-weighted image shows increased signal intensity and peripheral low signal rim (central relative signal intensity: 1.93, peripheral relative signal intensity: 0.85). B. Axial T2-weighted image shows central high signal intensity and peripheral dark signal rim (central relative signal intensity: 7.55, peripheral relative signal intensity: 0.75). C. Gradient echo image shows dark signal lesion. Value of relative signal intensity is 0.32. D, E. Microscopic findings of intramuscular hematoma (arrows) (Hematoxylin & Eosin stain, original magnification in D, × 10; in E × 200) show many hemosiderin-laden macrophages (arrows in E) and fibers. ○= region of interest for measuring relative signal intensity
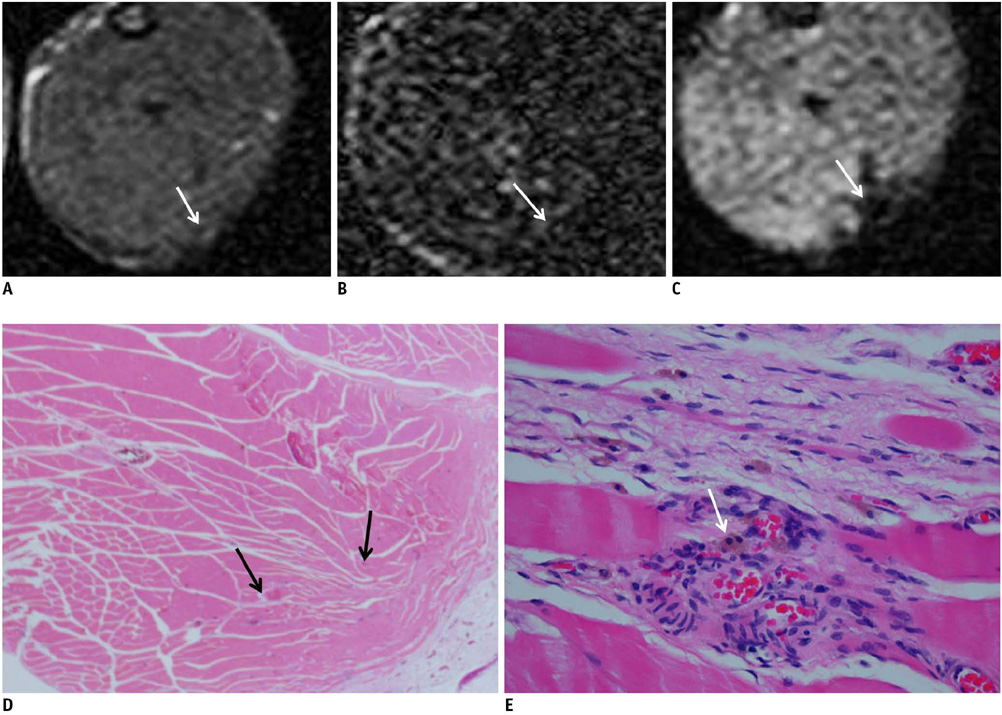
Fig. 7 MR images of intramuscular hematoma eight weeks after injury. It is difficult to observe hematomas owing to their extremely small size. However, hematomas can still be detected by gradient echo imaging because of their dark signals. A. Axial spin echo T1-weighted image shows tiny isosignal intensity with low signal (arrow). B. Axial T2-weighted image shows isosignal intensity with low signal (arrow). C. Gradient echo image shows focal dark signal lesion (arrow). D, E. Microscopic findings of intramuscular hematoma (Hematoxylin & Eosin stain, original magnification in D, × 10; in E × 400). After eighth week, it is difficult to find lesion. Granulation is not seen. Regenerating muscles and some capillaries are noted (arrows in D). Some residual hemosiderin-laden macrophages (arrow) are seen on high power magnification microscopic findings (E).
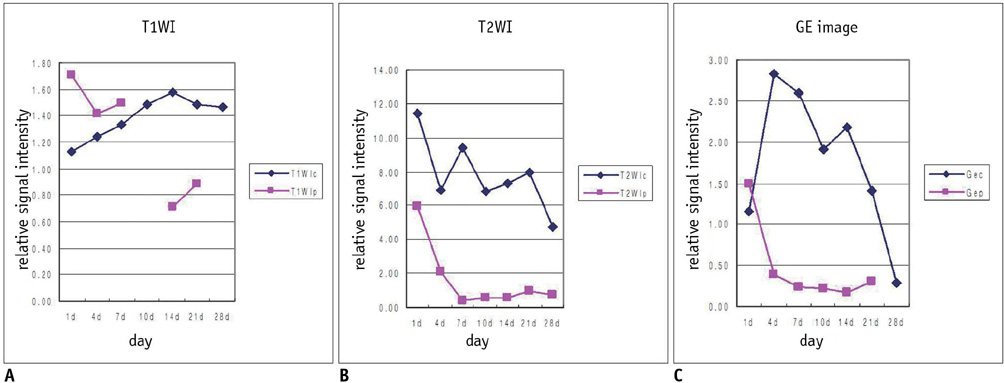
Fig. 8 Time-signal intensity curve of relative signal intensity of intramuscular hematoma on each pulse sequence. A. Central signal intensity is significantly increased on T1-weighted image (p < 0.05), whereas peripheral signal intensity was variable (p > 0.05). B. On T2-weighted image, hematomas were of variable signal intensity in central portion, with peripherally dark signal rim (p < 0.05). C. Signal intensities of hematomas on gradient echo imaging were similar to those on T2-weighted image. Gec = central relative signal intensity on GRE image, Gep = peripheral relative signal intensity on GRE image, T1WIc = central relative signal intensity on T1WI, T1WIp = peripheral relative signal intensity on T1WI, T2WIc = central relative signal intensity on T2WI, T2WIp = peripheral relative signal intensity on T2WI
Cited by 1 articles
-
Possible Local Stem Cells Activation by Microcurrent Application in Experimentally Injured Soleus Muscle
Maha Baligh Zickri
Int J Stem Cells. 2014;7(2):79-86. doi: 10.15283/ijsc.2014.7.2.79.
Reference
-
1. Crundwell N, O'Donnell P, Saifuddin A. Non-neoplastic conditions presenting as soft-tissue tumours. Clin Radiol. 2007. 62:18–27.2. Papp DF, Khanna AJ, McCarthy EF, Carrino JA, Farber AJ, Frassica FJ. Magnetic resonance imaging of soft-tissue tumors: determinate and indeterminate lesions. J Bone Joint Surg Am. 2007. 89:103–115.3. McKenzie G, Raby N, Ritchie D. Pictorial review: non-neoplastic soft-tissue masses. Br J Radiol. 2009. 82:775–785.4. Bush CH. The magnetic resonance imaging of musculoskeletal hemorrhage. Skeletal Radiol. 2000. 29:1–9.5. Bradley WG Jr. MR appearance of hemorrhage in the brain. Radiology. 1993. 189:15–26.6. Di Chiro G, Brooks RA, Girton ME, Caporale T, Wright DC, Dwyer AJ, et al. Sequential MR studies of intracerebral hematomas in monkeys. AJNR Am J Neuroradiol. 1986. 7:193–199.7. Allkemper T, Tombach B, Schwindt W, Kugel H, Schilling M, Debus O, et al. Acute and subacute intracerebral hemorrhages: comparison of MR imaging at 1.5 and 3.0 T--initial experience. Radiology. 2004. 232:874–881.8. Küllmer K, Sievers KW, Rompe JD, Nägele M, Harland U. Sonography and MRI of experimental muscle injuries. Arch Orthop Trauma Surg. 1997. 116:357–361.9. De Smet AA. Magnetic resonance findings in skeletal muscle tears. Skeletal Radiol. 1993. 22:479–484.10. Ehman RL, Berquist TH. Magnetic resonance imaging of musculoskeletal trauma. Radiol Clin North Am. 1986. 24:291–319.11. De Smet AA, Fisher DR, Heiner JP, Keene JS. Magnetic resonance imaging of muscle tears. Skeletal Radiol. 1990. 19:283–286.12. Dooms GC, Fisher MR, Hricak H, Higgins CB. MR imaging of intramuscular hemorrhage. J Comput Assist Tomogr. 1985. 9:908–913.13. Rybak LD, Torriani M. Magnetic resonance imaging of sports-related muscle injuries. Top Magn Reson Imaging. 2003. 14:209–219.14. Fleckenstein JL, Weatherall PT, Parkey RW, Payne JA, Peshock RM. Sports-related muscle injuries: evaluation with MR imaging. Radiology. 1989. 172:793–798.15. Koulouris G, Connell D. Evaluation of the hamstring muscle complex following acute injury. Skeletal Radiol. 2003. 32:582–589.16. Kneeland JP. MR imaging of muscle and tendon injury. Eur J Radiol. 1997. 25:198–208.17. Steinbach L, Fleckenstein JL, Mink JH. Magnetic resonance imaging of muscle injuries. Orthopedics. 1994. 17:991–999.18. Connell DA, Schneider-Kolsky ME, Hoving JL, Malara F, Buchbinder R, Koulouris G, et al. Longitudinal study comparing sonographic and MRI assessments of acute and healing hamstring injuries. AJR Am J Roentgenol. 2004. 183:975–984.19. Weishaupt D, Schweitzer ME, Morrison WB. Injuries to the distal gastrocnemius muscle: MR findings. J Comput Assist Tomogr. 2001. 25:677–682.20. Bohndorf K, Kilcoyne RF. Traumatic injuries: imaging of peripheral musculoskeletal injuries. Eur Radiol. 2002. 12:1605–1616.21. Mellerowicz H, Lubasch A, Dulce MC, Dulce K, Wagner S, Wolf KJ. Diagnosis and follow-up of muscle injuries by means of plain and contrast-enhanced MRT: experimental and clinical studies. Rofo. 1997. 166:437–445. [German].22. Niemi P, Paajanen H, Kormano M, Alanen A, Määttänen H, Dean PB. MR imaging of experimental intramuscular hemorrhage at 0.02 T. Contrast enhancement with Gd-DOTA. Acta Radiol. 1990. 31:455–458.23. Hurme T, Kalimo H, Lehto M, Järvinen M. Healing of skeletal muscle injury: an ultrastructural and immunohistochemical study. Med Sci Sports Exerc. 1991. 23:801–810.24. Kääriäinen M, Kääriäinen J, Järvinen TL, Sievänen H, Kalimo H, Järvinen M. Correlation between biomechanical and structural changes during the regeneration of skeletal muscle after laceration injury. J Orthop Res. 1998. 16:197–206.25. Terada N, Takayama S, Yamada H, Seki T. Muscle repair after a transsection injury with development of a gap: an experimental study in rats. Scand J Plast Reconstr Surg Hand Surg. 2001. 35:233–238.26. Sánchez-Márquez A, Gil-Garcáa M, Valls C, Portabella-Blavia F, Narváez-Garcia J, Andía-Navarro E, et al. Sports-related muscle injuries of the lower extremity: MR imaging appearances. Eur Radiol. 1999. 9:1088–1093.27. Brooks RA, Di Chiro G, Patronas N. MR imaging of cerebral hematomas at different field strengths: theory and applications. J Comput Assist Tomogr. 1989. 13:194–206.28. Edelman RR, Johnson K, Buxton R, Shoukimas G, Rosen BR, Davis KR, et al. MR of hemorrhage: a new approach. AJNR Am J Neuroradiol. 1986. 7:751–756.29. Boutin RD, Fritz RC, Steinbach LS. Imaging of sports-related muscle injuries. Radiol Clin North Am. 2002. 40:333–362.30. El-Khoury GY, Brandser EA, Kathol MH, Tearse DS, Callaghan JJ. Imaging of muscle injuries. Skeletal Radiol. 1996. 25:3–11.
- Full Text Links
-
- Actions
-
Cited
- CITED
-
- Close
- Share
-
- Similar articles
-
- Serial Correlation between the Ultrasonographic and Pathologic Findings of Intramuscular Hemorrhaging in an Experimental Rabbit
- Effects of Neck and Back Touch on Ultrasonic Vocalization and the Rat Grimace Scale in Rats Receiving Intramuscular Injections
- An experimental study on MR imaging of acute intracerebral hematoma: comparative analysis between high-field(2.0 T) and medium-field (0.5 T) images
- Delayed Intramuscular Hematoma in Iliacus after Blunt Trauma to the Pelvis: Case Report
- Intramuscular hematoma on the psoas muscle
