Diabetes Metab J.
2024 Sep;48(5):885-900. 10.4093/dmj.2023.0278.
Single-Cell Landscape and a Macrophage Subset Enhancing Brown Adipocyte Function in Diabetes
- Affiliations
-
- 1Department of Endocrinology & Geriatrics, Shandong Provincial Hospital, Shandong University, Jinan, China
- 2Department of Geriatrics, Shandong Provincial Hospital Affiliated to Shandong First Medical University, Jinan, China
- 3Department of Endocrinology, The Second Affiliated Hospital of Wannan Medical College, Wuhu, China
- 4National Key Laboratory for Innovation and Transformation of Luobing Theory, Shandong University, Jinan, China
- 5Key Laboratory of Cardiovascular Remodeling and Function Research, Chinese Ministry of Education, Chinese National Health Commission, Shandong University, Jinan, China
- 6Department of Cardiology, Qilu Hospital of Shandong University, Jinan, China
- 7Department of Biology, University College London, London, UK
- KMID: 2558999
- DOI: http://doi.org/10.4093/dmj.2023.0278
Abstract
- Background
Metabolic dysregulation is a hallmark of type 2 diabetes mellitus (T2DM), in which the abnormalities in brown adipose tissue (BAT) play important roles. However, the cellular composition and function of BAT as well as its pathological significance in diabetes remain incompletely understood. Our objective is to delineate the single-cell landscape of BAT-derived stromal vascular fraction (SVF) and their characteristic alterations in T2DM rats.
Methods
T2DM was induced in rats by intraperitoneal injection of low-dose streptozotocin and high-fat diet feeding. Single-cell mRNA sequencing was then performed on BAT samples and compared to normal rats to characterize changes in T2DM rats. Subsequently, the importance of key cell subsets in T2DM was elucidated using various functional studies.
Results
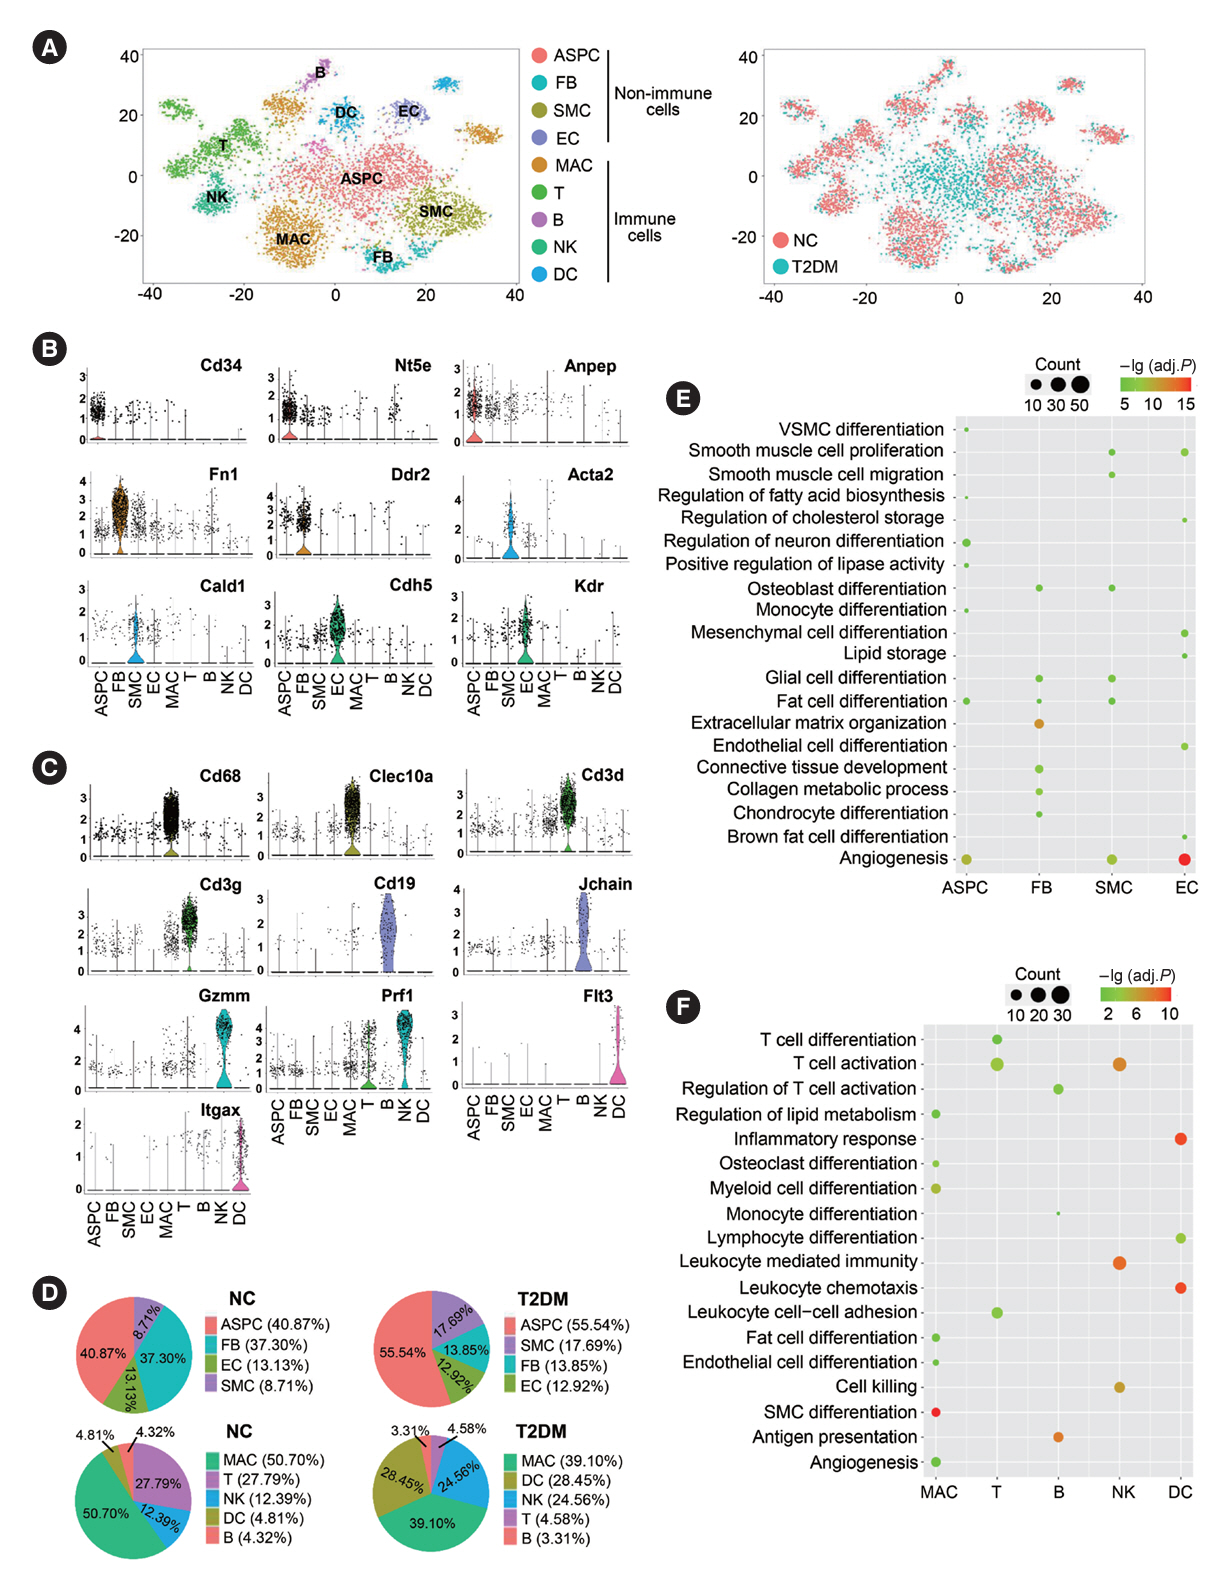
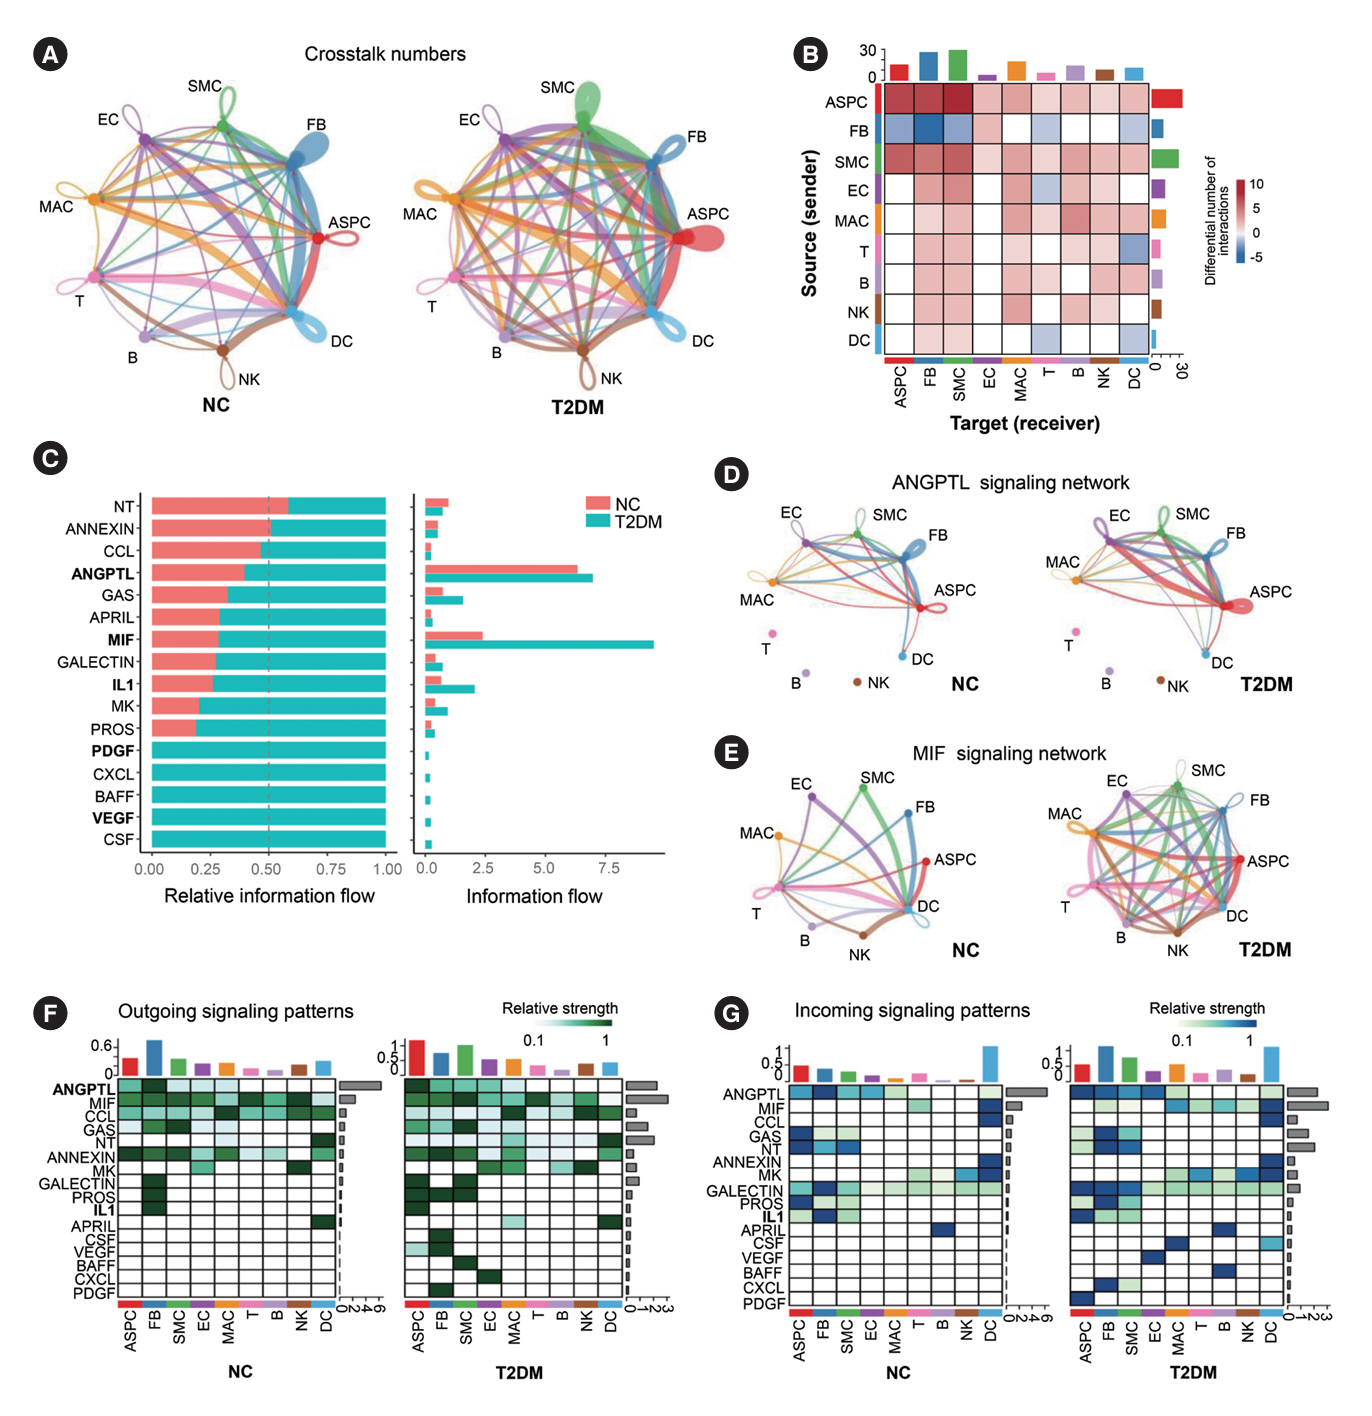
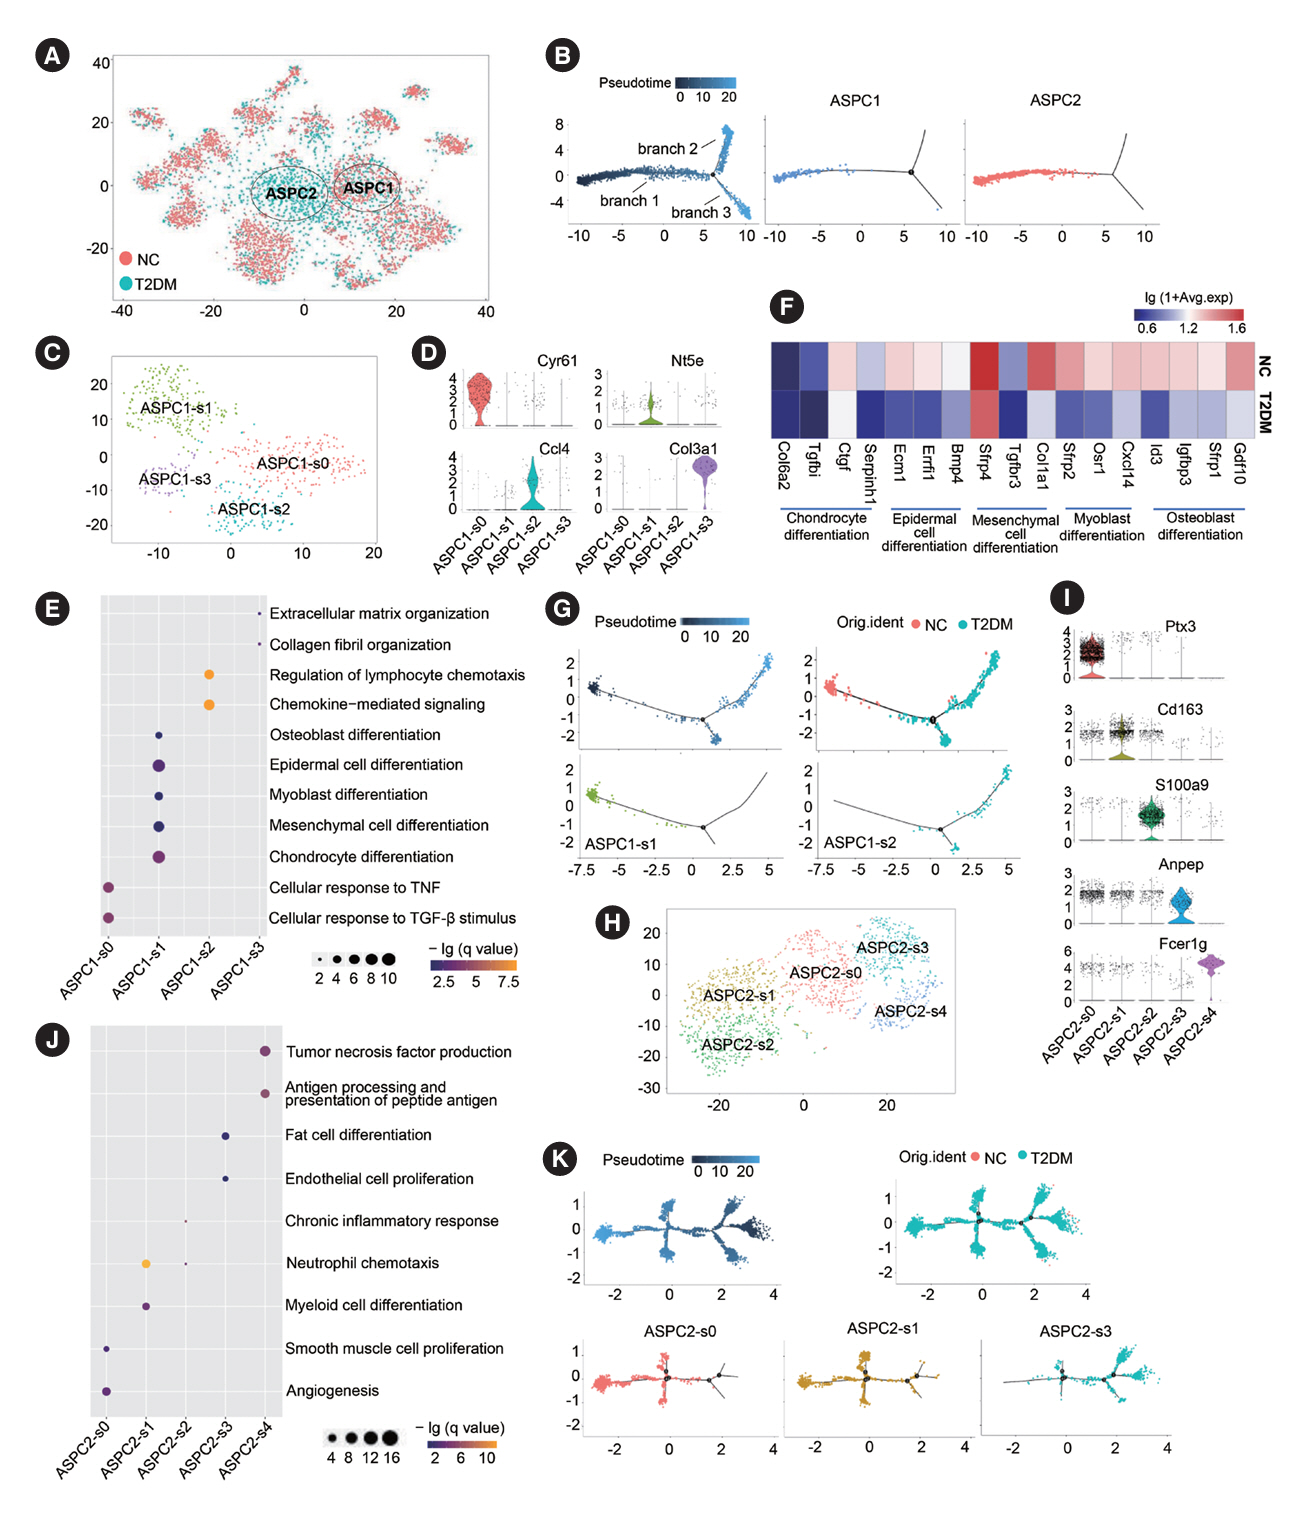
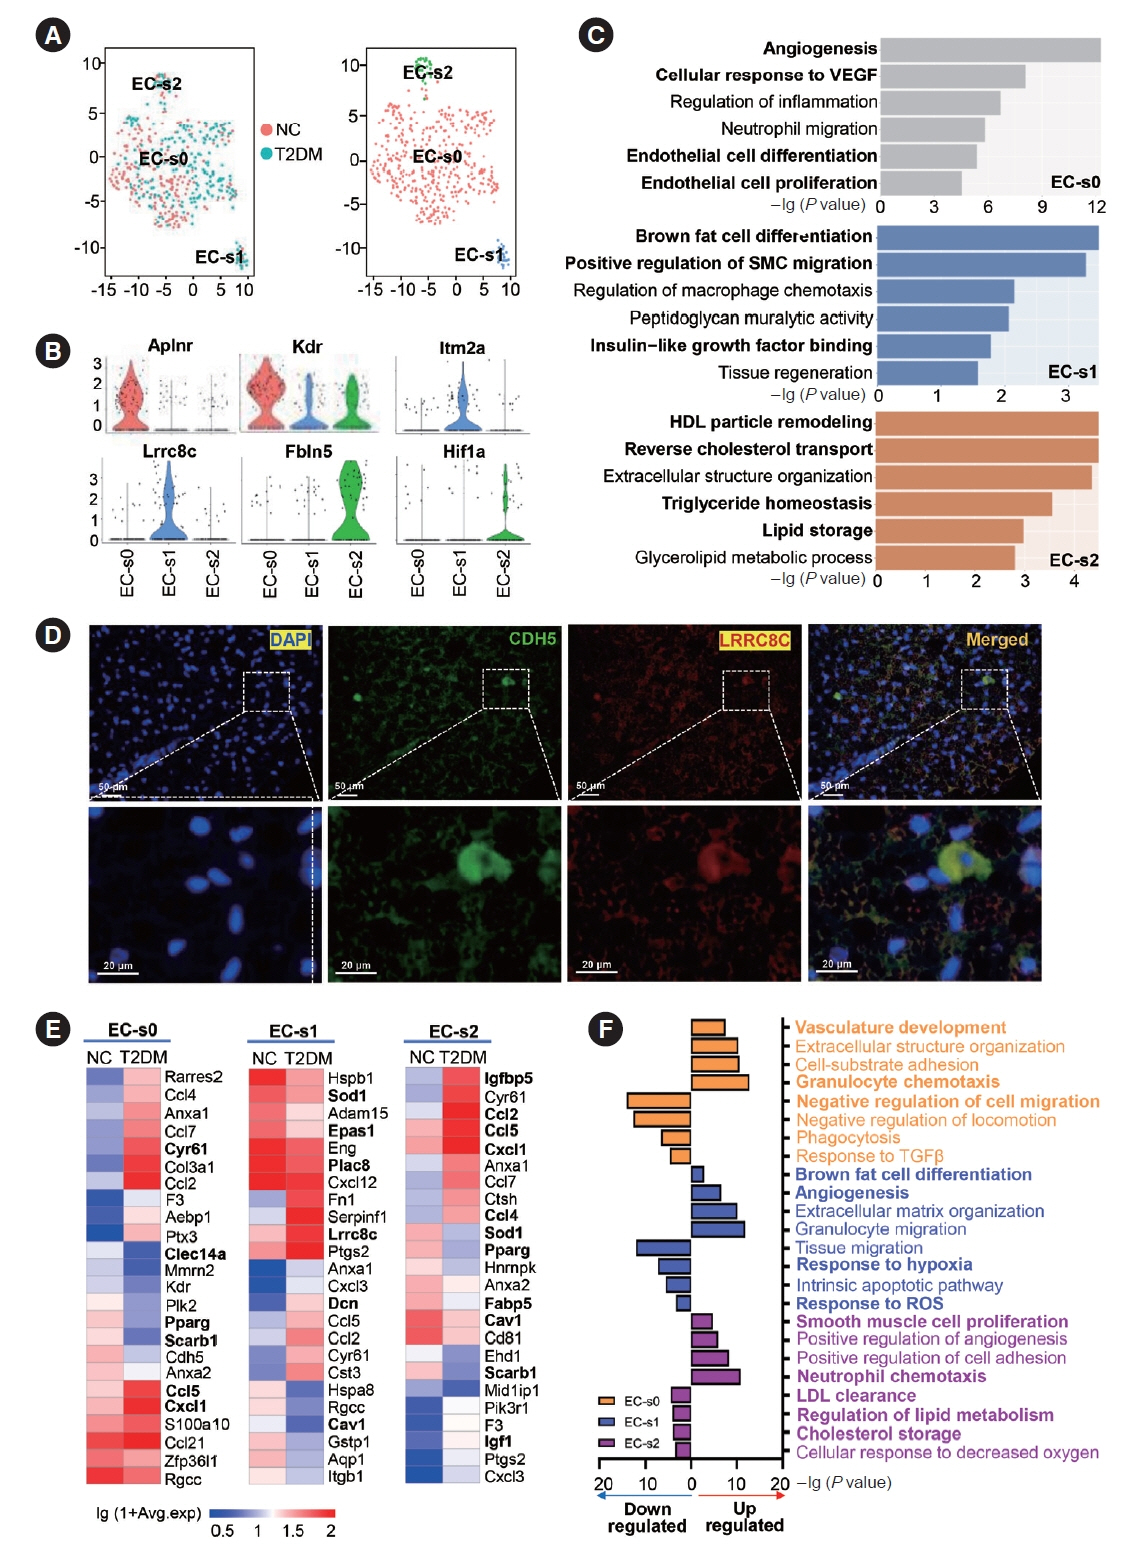
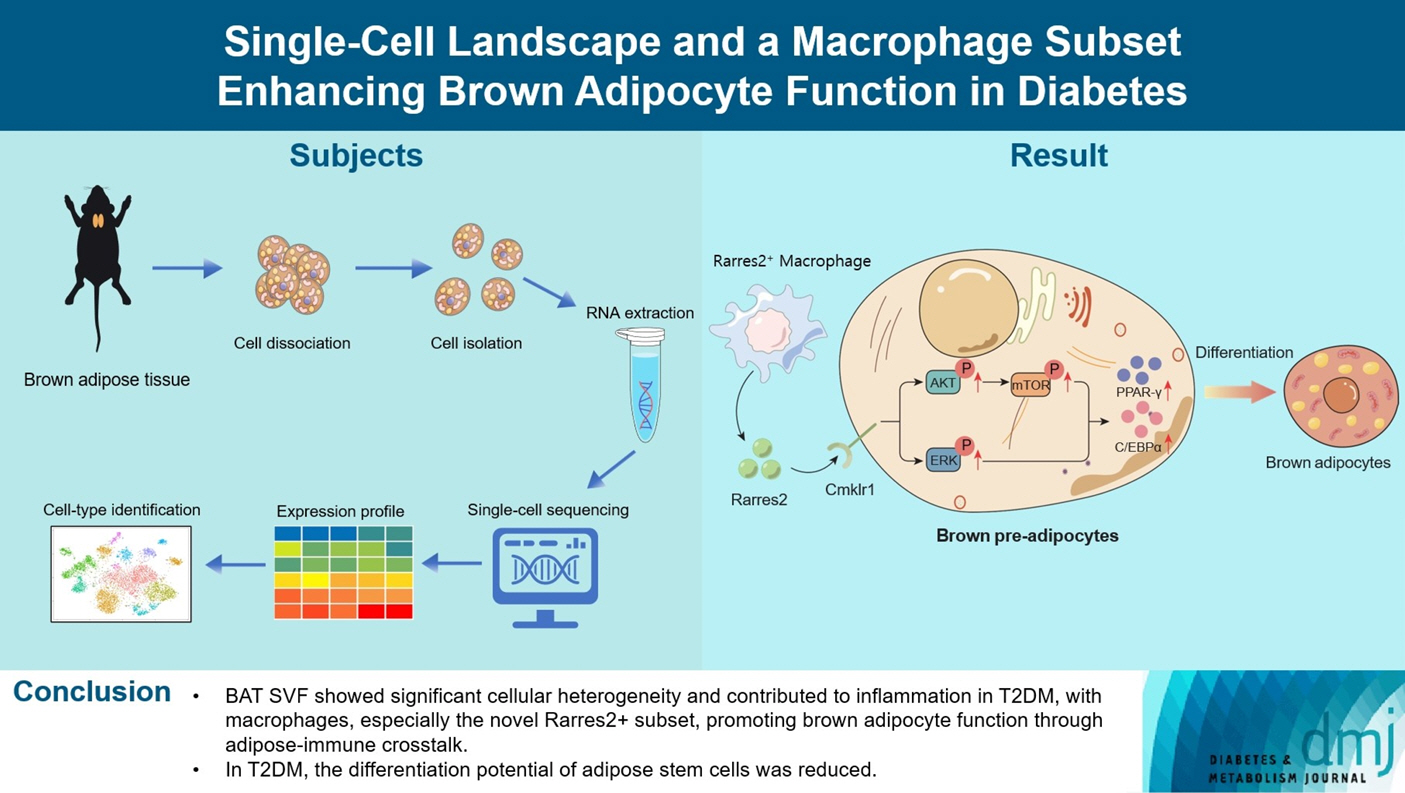
Almost all cell types in the BAT-derived SVF of T2DM rats exhibited enhanced inflammatory responses, increased angiogenesis, and disordered glucose and lipid metabolism. The multidirectional differentiation potential of adipose tissue-derived stem cells was also reduced. Moreover, macrophages played a pivotal role in intercellular crosstalk of BAT-derived SVF. A novel Rarres2+macrophage subset promoted the differentiation and metabolic function of brown adipocytes via adipose-immune crosstalk.
Conclusion
BAT SVF exhibited strong heterogeneity in cellular composition and function and contributed to T2DM as a significant inflammation source, in which a novel macrophage subset was identified that can promote brown adipocyte function.
Keyword
Figure
Cited by 2 articles
-
Single-Cell Landscape and a Macrophage Subset Enhancing Brown Adipocyte Function in Diabetes (
Diabetes Metab J 2024;48:885-900)
Yea Eun Kang, Ju Hee Lee
Diabetes Metab J. 2025;49(1):160-161. doi: 10.4093/dmj.2024.0739.Single-Cell Landscape and a Macrophage Subset Enhancing Brown Adipocyte Function in Diabetes (
Diabetes Metab J 2024;48:885-900)
Junfei Gu, Xinjie Zhang, Qunye Zhang, Zhe Wang
Diabetes Metab J. 2025;49(1):162-164. doi: 10.4093/dmj.2024.0785.
Reference
-
1. Brandon AE, Liao BM, Diakanastasis B, Parker BL, Raddatz K, McManus SA, et al. Protein kinase C epsilon deletion in adipose tissue, but not in liver, improves glucose tolerance. Cell Metab. 2019; 29:183–91.
Article2. Iwen KA, Backhaus J, Cassens M, Waltl M, Hedesan OC, Merkel M, et al. Cold-induced brown adipose tissue activity alters plasma fatty acids and improves glucose metabolism in men. J Clin Endocrinol Metab. 2017; 102:4226–34.
Article3. Villarroya F, Cereijo R, Villarroya J, Giralt M. Brown adipose tissue as a secretory organ. Nat Rev Endocrinol. 2017; 13:26–35.
Article4. Shimizu I, Walsh K. The whitening of brown fat and its implications for weight management in obesity. Curr Obes Rep. 2015; 4:224–9.
Article5. White JD, Dewal RS, Stanford KI. The beneficial effects of brown adipose tissue transplantation. Mol Aspects Med. 2019; 68:74–81.
Article6. Grunewald ZI, Winn NC, Gastecki ML, Woodford ML, Ball JR, Hansen SA, et al. Removal of interscapular brown adipose tissue increases aortic stiffness despite normal systemic glucose metabolism in mice. Am J Physiol Regul Integr Comp Physiol. 2018; 314:R584–97.
Article7. Cox N, Geissmann F. Macrophage ontogeny in the control of adipose tissue biology. Curr Opin Immunol. 2020; 62:1–8.
Article8. Rosina M, Ceci V, Turchi R, Chuan L, Borcherding N, Sciarretta F, et al. Ejection of damaged mitochondria and their removal by macrophages ensure efficient thermogenesis in brown adipose tissue. Cell Metab. 2022; 34:533–48.
Article9. Fischer K, Ruiz HH, Jhun K, Finan B, Oberlin DJ, van der Heide V, et al. Alternatively activated macrophages do not synthesize catecholamines or contribute to adipose tissue adaptive thermogenesis. Nat Med. 2017; 23:623–30.
Article10. Yang D, Yang L, Cai J, Hu X, Li H, Zhang X, et al. A sweet spot for macrophages: focusing on polarization. Pharmacol Res. 2021; 167:105576.
Article11. Russo L, Lumeng CN. Properties and functions of adipose tissue macrophages in obesity. Immunology. 2018; 155:407–17.
Article12. Mosser DM, Hamidzadeh K, Goncalves R. Macrophages and the maintenance of homeostasis. Cell Mol Immunol. 2021; 18:579–87.
Article13. Schwalie PC, Dong H, Zachara M, Russeil J, Alpern D, Akchiche N, et al. A stromal cell population that inhibits adipogenesis in mammalian fat depots. Nature. 2018; 559:103–8.
Article14. Song A, Dai W, Jang MJ, Medrano L, Li Z, Zhao H, et al. Low- and high-thermogenic brown adipocyte subpopulations coexist in murine adipose tissue. J Clin Invest. 2020; 130:247–57.
Article15. Nguyen HP, Lin F, Yi D, Xie Y, Dinh J, Xue P, et al. Aging-dependent regulatory cells emerge in subcutaneous fat to inhibit adipogenesis. Dev Cell. 2021; 56:1437–51.
Article16. Shao Q, Meng L, Lee S, Tse G, Gong M, Zhang Z, et al. Empagliflozin, a sodium glucose co-transporter-2 inhibitor, alleviates atrial remodeling and improves mitochondrial function in high-fat diet/streptozotocin-induced diabetic rats. Cardiovasc Diabetol. 2019; 18:165.
Article17. Tahan V, Yavuz D, Imeryuz N, Avsar E, Tozun N. Oral glucose tolerance deteriorates in rats fed with methionine choline deficient diet. J Hepatol. 2004; 41:352.
Article18. Todero J, Douillet C, Shumway AJ, Koller BH, Kanke M, Phuong DJ, et al. Molecular and metabolic analysis of arsenic-exposed humanized AS3MT mice. Environ Health Perspect. 2023; 131:127021.
Article19. Hu B, Jin C, Zeng X, Resch JM, Jedrychowski MP, Yang Z, et al. γδ T cells and adipocyte IL-17RC control fat innervation and thermogenesis. Nature. 2020; 578:610–4.
Article20. Gaydosik AM, Tabib T, Domsic R, Khanna D, Lafyatis R, Fuschiotti P. Single-cell transcriptome analysis identifies skin-specific T-cell responses in systemic sclerosis. Ann Rheum Dis. 2021; 80:1453–60.
Article21. Yang X, Liang M, Tang Y, Ma D, Li M, Yuan C, et al. KLF7 promotes adipocyte inflammation and glucose metabolism disorder by activating the PKCζ/NF-κB pathway. FASEB J. 2023; 37:e23033.
Article22. Brandt KJ, Burger F, Baptista D, Roth A, Fernandes da Silva R, Montecucco F, et al. Single-cell analysis uncovers osteoblast factor growth differentiation factor 10 as mediator of vascular smooth muscle cell phenotypic modulation associated with plaque rupture in human carotid artery disease. Int J Mol Sci. 2022; 23:1796.
Article23. Vallecillo-Garcia P, Orgeur M, Vom Hofe-Schneider S, Stumm J, Kappert V, Ibrahim DM, et al. Odd skipped-related 1 identifies a population of embryonic fibro-adipogenic progenitors regulating myogenesis during limb development. Nat Commun. 2017; 8:1218.
Article24. Kotsaris G, Qazi TH, Bucher CH, Zahid H, Pohle-Kronawitter S, Ugorets V, et al. Odd skipped-related 1 controls the pro-regenerative response of fibro-adipogenic progenitors. NPJ Regen Med. 2023; 8:19.
Article25. Ferby I, Reschke M, Kudlacek O, Knyazev P, Pante G, Amann K, et al. Mig6 is a negative regulator of EGF receptor-mediated skin morphogenesis and tumor formation. Nat Med. 2006; 12:568–73.
Article26. Comba A, Faisal SM, Dunn PJ, Argento AE, Hollon TC, AlHolou WN, et al. Spatiotemporal analysis of glioma heterogeneity reveals COL1A1 as an actionable target to disrupt tumor progression. Nat Commun. 2022; 13:3606.
Article27. Chavakis T, Alexaki VI, Ferrante AW Jr. Macrophage function in adipose tissue homeostasis and metabolic inflammation. Nat Immunol. 2023; 24:757–66.
Article28. Yu L, Zhang Y, Liu C, Wu X, Wang S, Sui W, et al. Heterogeneity of macrophages in atherosclerosis revealed by single-cell RNA sequencing. FASEB J. 2023; 37:e22810.
Article29. Burl RB, Ramseyer VD, Rondini EA, Pique-Regi R, Lee YH, Granneman JG. Deconstructing adipogenesis induced by β3-adrenergic receptor activation with single-cell expression profiling. Cell Metab. 2018; 28:300–9.
Article30. Nimmerjahn F, Ravetch JV. Fcgamma receptors as regulators of immune responses. Nat Rev Immunol. 2008; 8:34–47.31. Gallerand A, Stunault MI, Merlin J, Luehmann HP, Sultan DH, Firulyova MM, et al. Brown adipose tissue monocytes support tissue expansion. Nat Commun. 2021; 12:5255.
Article32. Burl RB, Rondini EA, Wei H, Pique-Regi R, Granneman JG. Deconstructing cold-induced brown adipocyte neogenesis in mice. Elife. 2022; 11:e80167.
Article33. Zhang Y, Shen WJ, Qiu S, Yang P, Dempsey G, Zhao L, et al. Chemerin regulates formation and function of brown adipose tissue: ablation results in increased insulin resistance with high fat challenge and aging. FASEB J. 2021; 35:e21687.
Article34. Jiang Y, Liu P, Jiao W, Meng J, Feng J. Gax suppresses chemerin/CMKLR1-induced preadipocyte biofunctions through the inhibition of Akt/mTOR and ERK signaling pathways. J Cell Physiol. 2018; 233:572–86.
Article35. Roh SG, Song SH, Choi KC, Katoh K, Wittamer V, Parmentier M, et al. Chemerin: a new adipokine that modulates adipogenesis via its own receptor. Biochem Biophys Res Commun. 2007; 362:1013–8.36. Lee M, Sorn SR, Lee Y, Kang I. Salt Induces Adipogenesis/lipogenesis and inflammatory adipocytokines secretion in adipocytes. Int J Mol Sci. 2019; 20:160.
Article37. Lowell BB. PPARgamma: an essential regulator of adipogenesis and modulator of fat cell function. Cell. 1999; 99:239–42.
Article38. Sha H, He Y, Chen H, Wang C, Zenno A, Shi H, et al. The IRE1-alpha-XBP1 pathway of the unfolded protein response is required for adipogenesis. Cell Metab. 2009; 9:556–64.39. Vijay J, Gauthier MF, Biswell RL, Louiselle DA, Johnston JJ, Cheung WA, et al. Single-cell analysis of human adipose tissue identifies depot and disease specific cell types. Nat Metab. 2020; 2:97–109.
Article40. Yamamoto M, Nagasawa Y, Fujimori K. Glycyrrhizic acid suppresses early stage of adipogenesis through repression of MEK/ERK-mediated C/EBPβ and C/EBPδ expression in 3T3-L1 cells. Chem Biol Interact. 2021; 346:109595.
Article41. Marcelin G, Ferreira A, Liu Y, Atlan M, Aron-Wisnewsky J, Pelloux V, et al. A PDGFRα-mediated switch toward CD9high adipocyte progenitors controls obesity-induced adipose tissue fibrosis. Cell Metab. 2017; 25:673–85.
Article42. Kalluri AS, Vellarikkal SK, Edelman ER, Nguyen L, Subramanian A, Ellinor PT, et al. Single-cell analysis of the normal mouse aorta reveals functionally distinct endothelial cell populations. Circulation. 2019; 140:147–63.
Article43. Yu L, Dai Y, Mineo C. Novel functions of endothelial scavenger receptor class B type I. Curr Atheroscler Rep. 2021; 23:6.
Article44. Nijhawans P, Behl T, Bhardwaj S. Angiogenesis in obesity. Biomed Pharmacother. 2020; 126:110103.
Article45. Gonzalez N, Moreno-Villegas Z, Gonzalez-Bris A, Egido J, Lorenzo O. Regulation of visceral and epicardial adipose tissue for preventing cardiovascular injuries associated to obesity and diabetes. Cardiovasc Diabetol. 2017; 16:44.
Article
- Full Text Links
- Actions
-
Cited
- CITED
-
- Close
- Share
- Similar articles
-
- Single-Cell Landscape and a Macrophage Subset Enhancing Brown Adipocyte Function in Diabetes (Diabetes Metab J 2024;48:885-900)
- Single-Cell Landscape and a Macrophage Subset Enhancing Brown Adipocyte Function in Diabetes (Diabetes Metab J 2024;48:885-900)
- Brown Adipocyte and Splenocyte Co-Culture Maintains Regulatory T Cell Subset in Intermittent Hypobaric Conditions
- The Mechanism of White and Brown Adipocyte Differentiation
- Brown Fat and Browning for the Treatment of Obesity and Related Metabolic Disorders

