It is normal to be “not-normal”: reporting of correct descriptive statistics in dental research
- Affiliations
-
- 1Department of Dentistry, Ramkrishna Sarada Mission Matri Bhawan Hospital, Kolkata, West Bengal, India
- KMID: 2556548
- DOI: http://doi.org/10.5395/rde.2024.49.e19
Figure
-
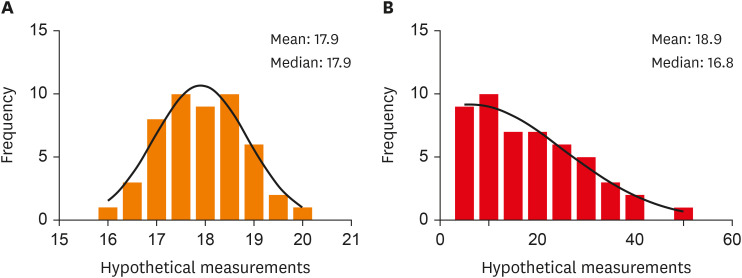
Figure 1 Histograms of normally distributed and skewed data (hypothetical data generated digitally with n = 50 each). (A) Normally distributed data and (B) skewed data.
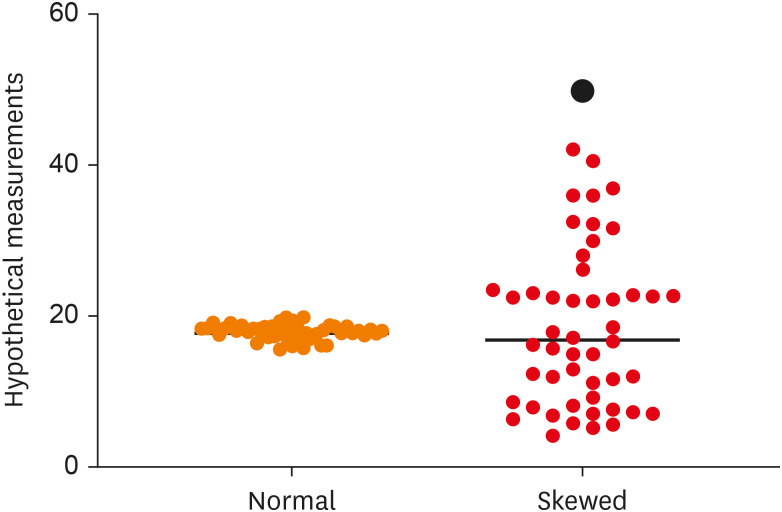
Figure 2 Scatter Dot Plot showing the data dispersion in normally distributed data (blue) and skewed data (red) with the black horizontal line at the median. Note the amount of clustering of observations around the median value in the case of normally distributed data and the amount of dispersion in skewed data with an outlier (black dot).
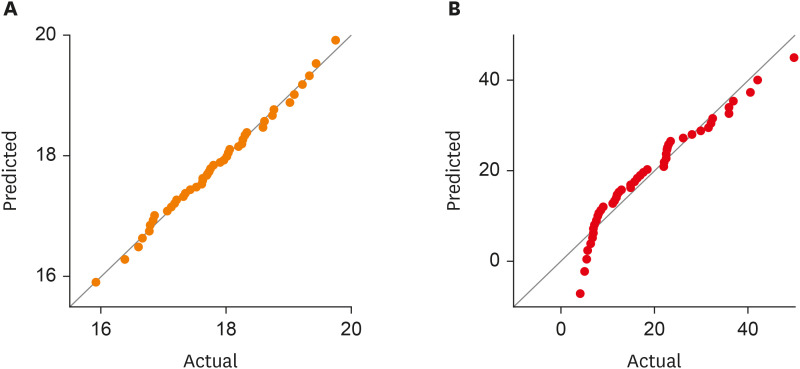
Figure 3 Quantile-Quantile(Q-Q) Plot of two hypothetical data sets. (A) Normally distributed data and (B) skewed data. Note that observations lie on or around the theoretical normal line in the case of normally distributed data, while in skewed data, the observations form a curve or an “S”-shape around the theoretical normal line.
Reference
-
1. Bono R, Blanca MJ, Arnau J, Gómez-Benito J. Non-normal distributions commonly used in health, education, and Social Sciences: A systematic review. Front Psychol. 2017; 8:1602. PMID: 28959227.2. Sainani KL. Dealing with non-normal data. PM R. 2012; 4:1001–1005. PMID: 23245662.3. Madadizadeh F, Ezati Asar M, Hosseini M. Common statistical mistakes in descriptive statistics reports of normal and non-normal variables in biomedical sciences research. Iran J Public Health. 2015; 44:1557–1558. PMID: 26744717.
- Full Text Links
-
- Actions
-
Cited
- CITED
-
- Close
- Share
-
- Similar articles
-
- Dental radiology reporting status and recording frequency of reporting items in Korea
- The Analysis of Research Trends of Elderly in the Dental Hygiene Discipline
- A study on the dental arch by occlusogram in normal occlusion
- Statistical Data Editing in Scientific Articles
- Suggestion of more suitable study designs and the corresponding reporting guidelines in articles published in the Journal of Educational Evaluation for Health Professions from 2021 to September 2022: a descriptive study
