In search of subcortical and cortical morphologic alterations of a normal brain through aging: an investigation by computed tomography scan
- Affiliations
-
- 1Department of Anatomical Sciences, Faculty of Medicine, AJA University of Medical Sciences, Tehran, Iran
- 2Department of Anatomy, School of Medicine, Iran University of Medical Sciences, Tehran, Iran
- 3Department of Social Medicine, Faculty of Medicine, AJA University of Medical Sciences, Tehran, Iran
- KMID: 2554240
- DOI: http://doi.org/10.5115/acb.23.219
Abstract
- Morphologic changes in the brain through aging, as a physiologic process, may involve a wide range of variables including ventricular dilation, and sulcus widening. This study reports normal ranges of these changes as standard criteria. Normal brain computed tomography scans of 400 patients (200 males, 200 females) in every decade of life (20 groups each containing 20 participants) were investigated for subcortical/cortical atrophy (bicaudate width [BCW], third ventricle width [ThVW], maximum length of lateral ventricle at cella media [MLCM], bicaudate index [BCI], third ventricle index [ThVI], and cella media index 3 [CMI3], interhemispheric sulcus width [IHSW], right hemisphere sulci diameter [RHSD], and left hemisphere sulci diameter [LHSD]), ventricular symmetry. Distribution and correlation of all the variables were demonstrated with age and a multiple linear regression model was reported for age prediction. Among the various parameters of subcortical atrophy, BCW, ThVW, MLCM, and the corresponding indices of BCI, ThVI, and CMI3 demonstrated a significant correlation with age (R 2 ≥0.62). All the cortical atrophy parameters including IHSW, RHSD, and LHSD demonstrated a significant correlation with age (R 2 ≥0.63). This study is a thorough investigation of variables in a normal brain which can be affected by aging disclosing normal ranges of variables including major ventricular variables, derived ventricular indices, lateral ventricles asymmetry, cortical atrophy, in every decade of life introducing BW, ThVW, MLCM, BCI, ThVI, CMI3 as most significant ventricular parameters, and IHSW, RHSD, LHSD as significant cortical parameters associated with age.
Figure
-
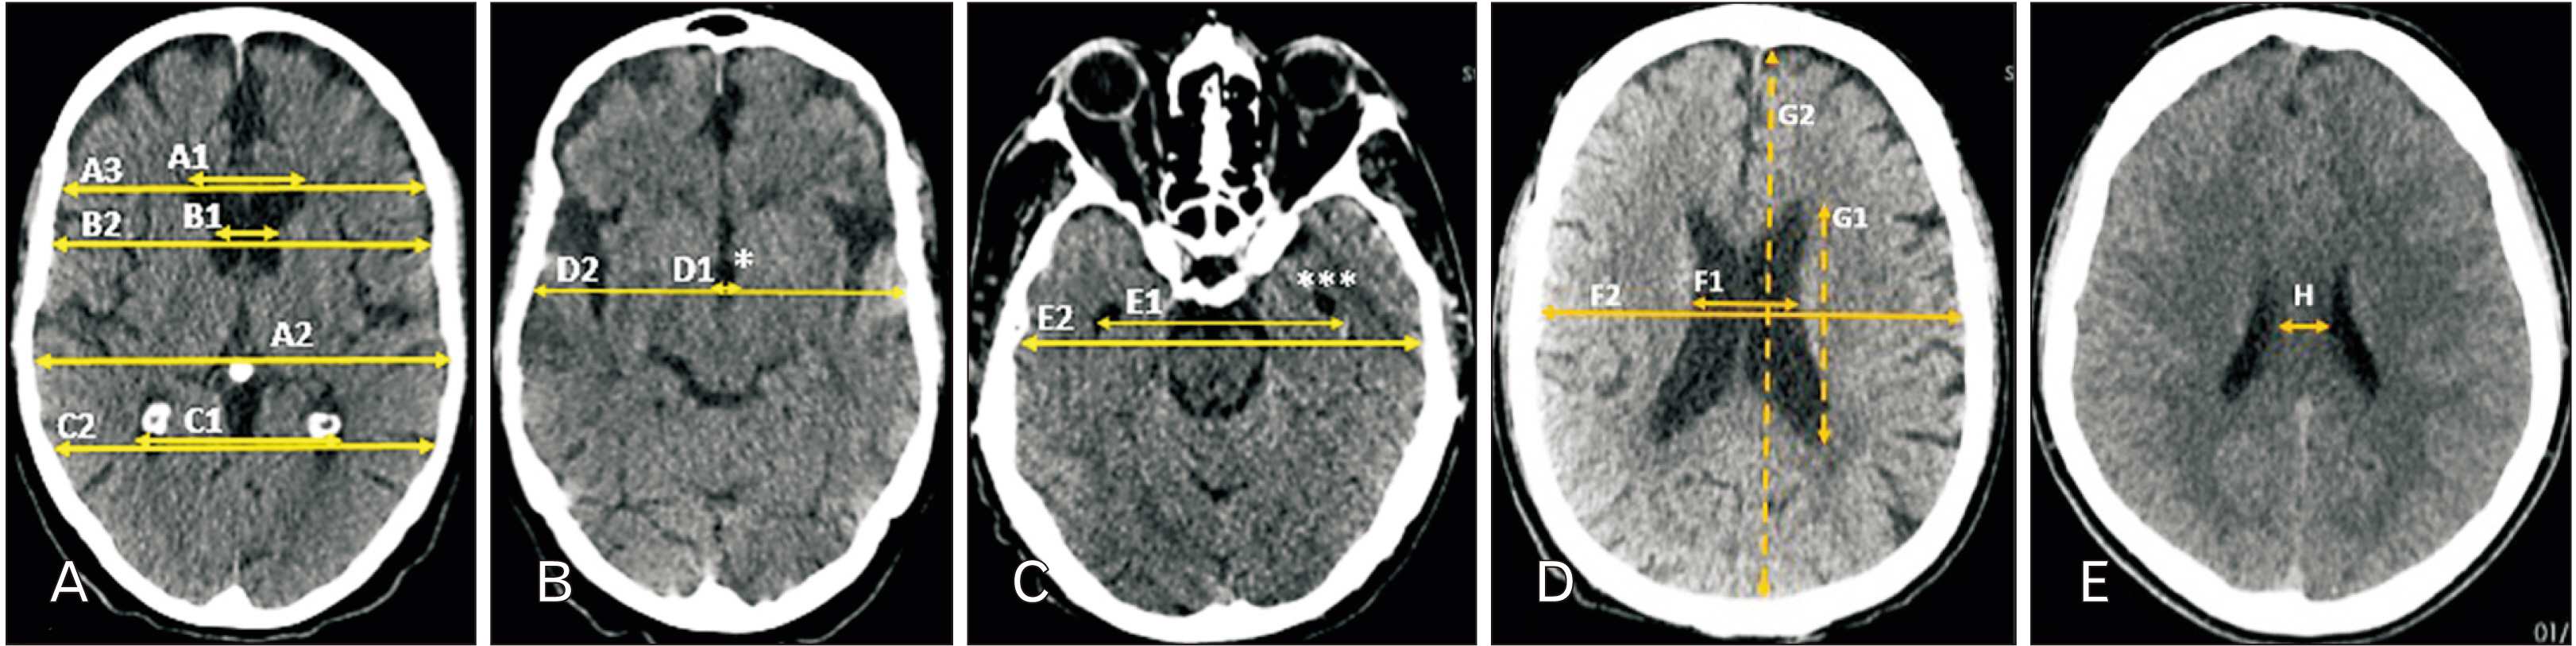
Fig. 1 Ventricular parameters. A1, maximum width of frontal horns; A2, maximum inner diameter of cranium; A3, maximum inner diameter of cranium at the level of A1; B1, minimum bicaudate width at the level of A1; B2, maximum inner diameter of cranium at the level of B1; C1, bioccipital width of occipital horns of lateral ventricles; C2, maximum inner diameter of cranium at the level of C1; D1, maximum width of third ventricle; D2, maximum inner diameter of cranium at the level of D1; E1, bitemporal width of temporal horns of lateral ventricles; E2, maximum inner diameter of cranium at the level of E1; F1, maximum width of lateral ventricles at the level of cella media; F2, maximum inner diameter of cranium at the level of F1; G1, maximum length of lateral ventricles at the level of cella media; G2, maximum inner diameter of cranium at the level of G1; H, width of neural tissue between lateral ventricles at cella media. *Third ventricle, ***temporal horn of left lateral ventricle.

Fig. 2 Symmetry of frontal horn of lateral ventricles. a, width of right frontal horn; b, width of left frontal horn.

Fig. 3 Cortical atrophy (sulcus widening). a, interhemispheric sulcus; b–f, right hemisphere sulci width.

Fig. 4 Distribution of three significant major ventricular parameter with age. (A) Total bicaudate width distribution with age (R2=0.67), (B) bicaudate width distribution within age groups (*vs. 1–9 yr [P≤0.05]), (C) computed tomography (CT) images showing bicaudate width through aging (double head dashed arrow shows bicaudate width in an 85 year old male). (D) Total third ventricle width distribution with age (R2=0.64), (E) third ventricle width distribution within age groups (*vs. 1–9 yr, 10–19 yr, and 20–29 yr; #vs. 30–39 yr, 40–49 yr, and 50–59 yr; @vs. 60–69 yr and 70–79 yr [P≤0.05]), (F) CT images showing third ventricle width through aging (double head dashed arrow shows third ventricle width in a 92 year old male). (G) Total maximum length of lateral ventricle at cella media distribution with age (R2=0.62), (H) maximum length of lateral ventricle at cella media distribution within age groups (*vs. 1–9 yr, #vs. 10–19 yr, 20–29 yr, 30–39 yr, and 40–49 yr [P≤0.05]), (I) CT images showing maximum length of lateral ventricle at cella media through aging (double head dashed arrow shows maximum length of lateral ventricle at cella media in a 92 year old male). Left column diagrams demonstrate linear interpolation and line of best fit from linear regression. Right column diagrams demonstrate male, female, and mean distribution within age groups (data are shown as mean±SD).

Fig. 5 Frontal horn asymmetry.

Fig. 6 Distribution of six significant derived ventricular indices with age. (A) Total Evans’ index distribution with age (R2=0.56), (B) Evans’ index distribution within age groups (*vs. 1–9 yr, #vs. 10–19 yr, @vs. 20–29 yr, 30–39 yr, and 40–49 yr [P≤0.05]), (C) total bifrontal index distribution with age (R2=0.44), (D) bifrontal index width distribution within age groups (*vs. 1–9 yr, #vs. 10–19 yr, 20–29 yr, and 30–39 yr (P≤0.05]), (E) total bicaudate width distribution with age (R2=0.70), (F) bicaudate width distribution within age groups (*vs. 1–9 yr; #vs. 10–19 yr, 20–29 yr, 30–39 yr, and 40–49 yr; @vs. 50–59 yr, 60–69 yr, and 70–79 yr [P≤0.05]). (G) Total cella media index 3 distribution with age (R2=0.64), (H) cella media index 3 distribution within age groups (*vs. 1–9 yr; #vs. 10–19 yr, 20–29 yr, and 30–39 yr; @vs. 40–49 yr, 50–59 yr, and 60–69 yr [P≤0.05]). (I) Total cella media index 4 distribution with age (R2=0.60), (J) cella media index 4 within age groups (*vs. 1–9 yr; #vs. 10–19 yr, 20–29 yr, and 30–39 yr [P≤0.05]). (K) Total third ventricle index distribution with age (R2=0.65), (L) third ventricle index distribution within age groups (*vs. 1–9 yr; #vs. 10–19 yr, 20–29 yr, 30–39 yr, and 40–49 yr; @vs. 50–59 yr and 60–69 yr [P≤0.05]). Left column diagrams demonstrates linear interpolation and line of best fit from linear regression. Right column diagrams demonstrate male, female, and mean distribution within age groups (data are shown as mean±SD).

Fig. 7 Distribution of cortical atrophy parameters with age. (A) Total interhemispheric sulcus width distribution with age (R2=0.63), (B) interhemispheric sulcus width distribution within age groups (*vs. 1–9 yr; #vs. 10–19 yr, 20–29 yr, and 30–39 yr; @vs. 40–49 yr and 50–59 yr [P≤0.05]). (C) Total right hemisphere sulci diameter distribution with age (R2=0.74), (D) right hemisphere sulci diameter distribution within age groups (*vs. 1–9 yr; #vs. 10–19 yr, 20–29 yr, and 30–39 yr; @vs. 40–49 yr and 50–59 yr [P≤0.05]). (E) Total left hemisphere sulci diameter distribution with age (R2=0.73), (F) left hemisphere sulci diameter distribution within age groups (*vs. 1–9 yr; #vs. 10–19 yr, 20–29 yr, and 30–39 yr; @vs. 40–49 yr and 50–59 yr [P≤0.05]). Left column diagrams demonstrates linear interpolation and line of best fit from linear regression. Right column diagrams demonstrate male, female, and mean of male and female distribution within age groups.
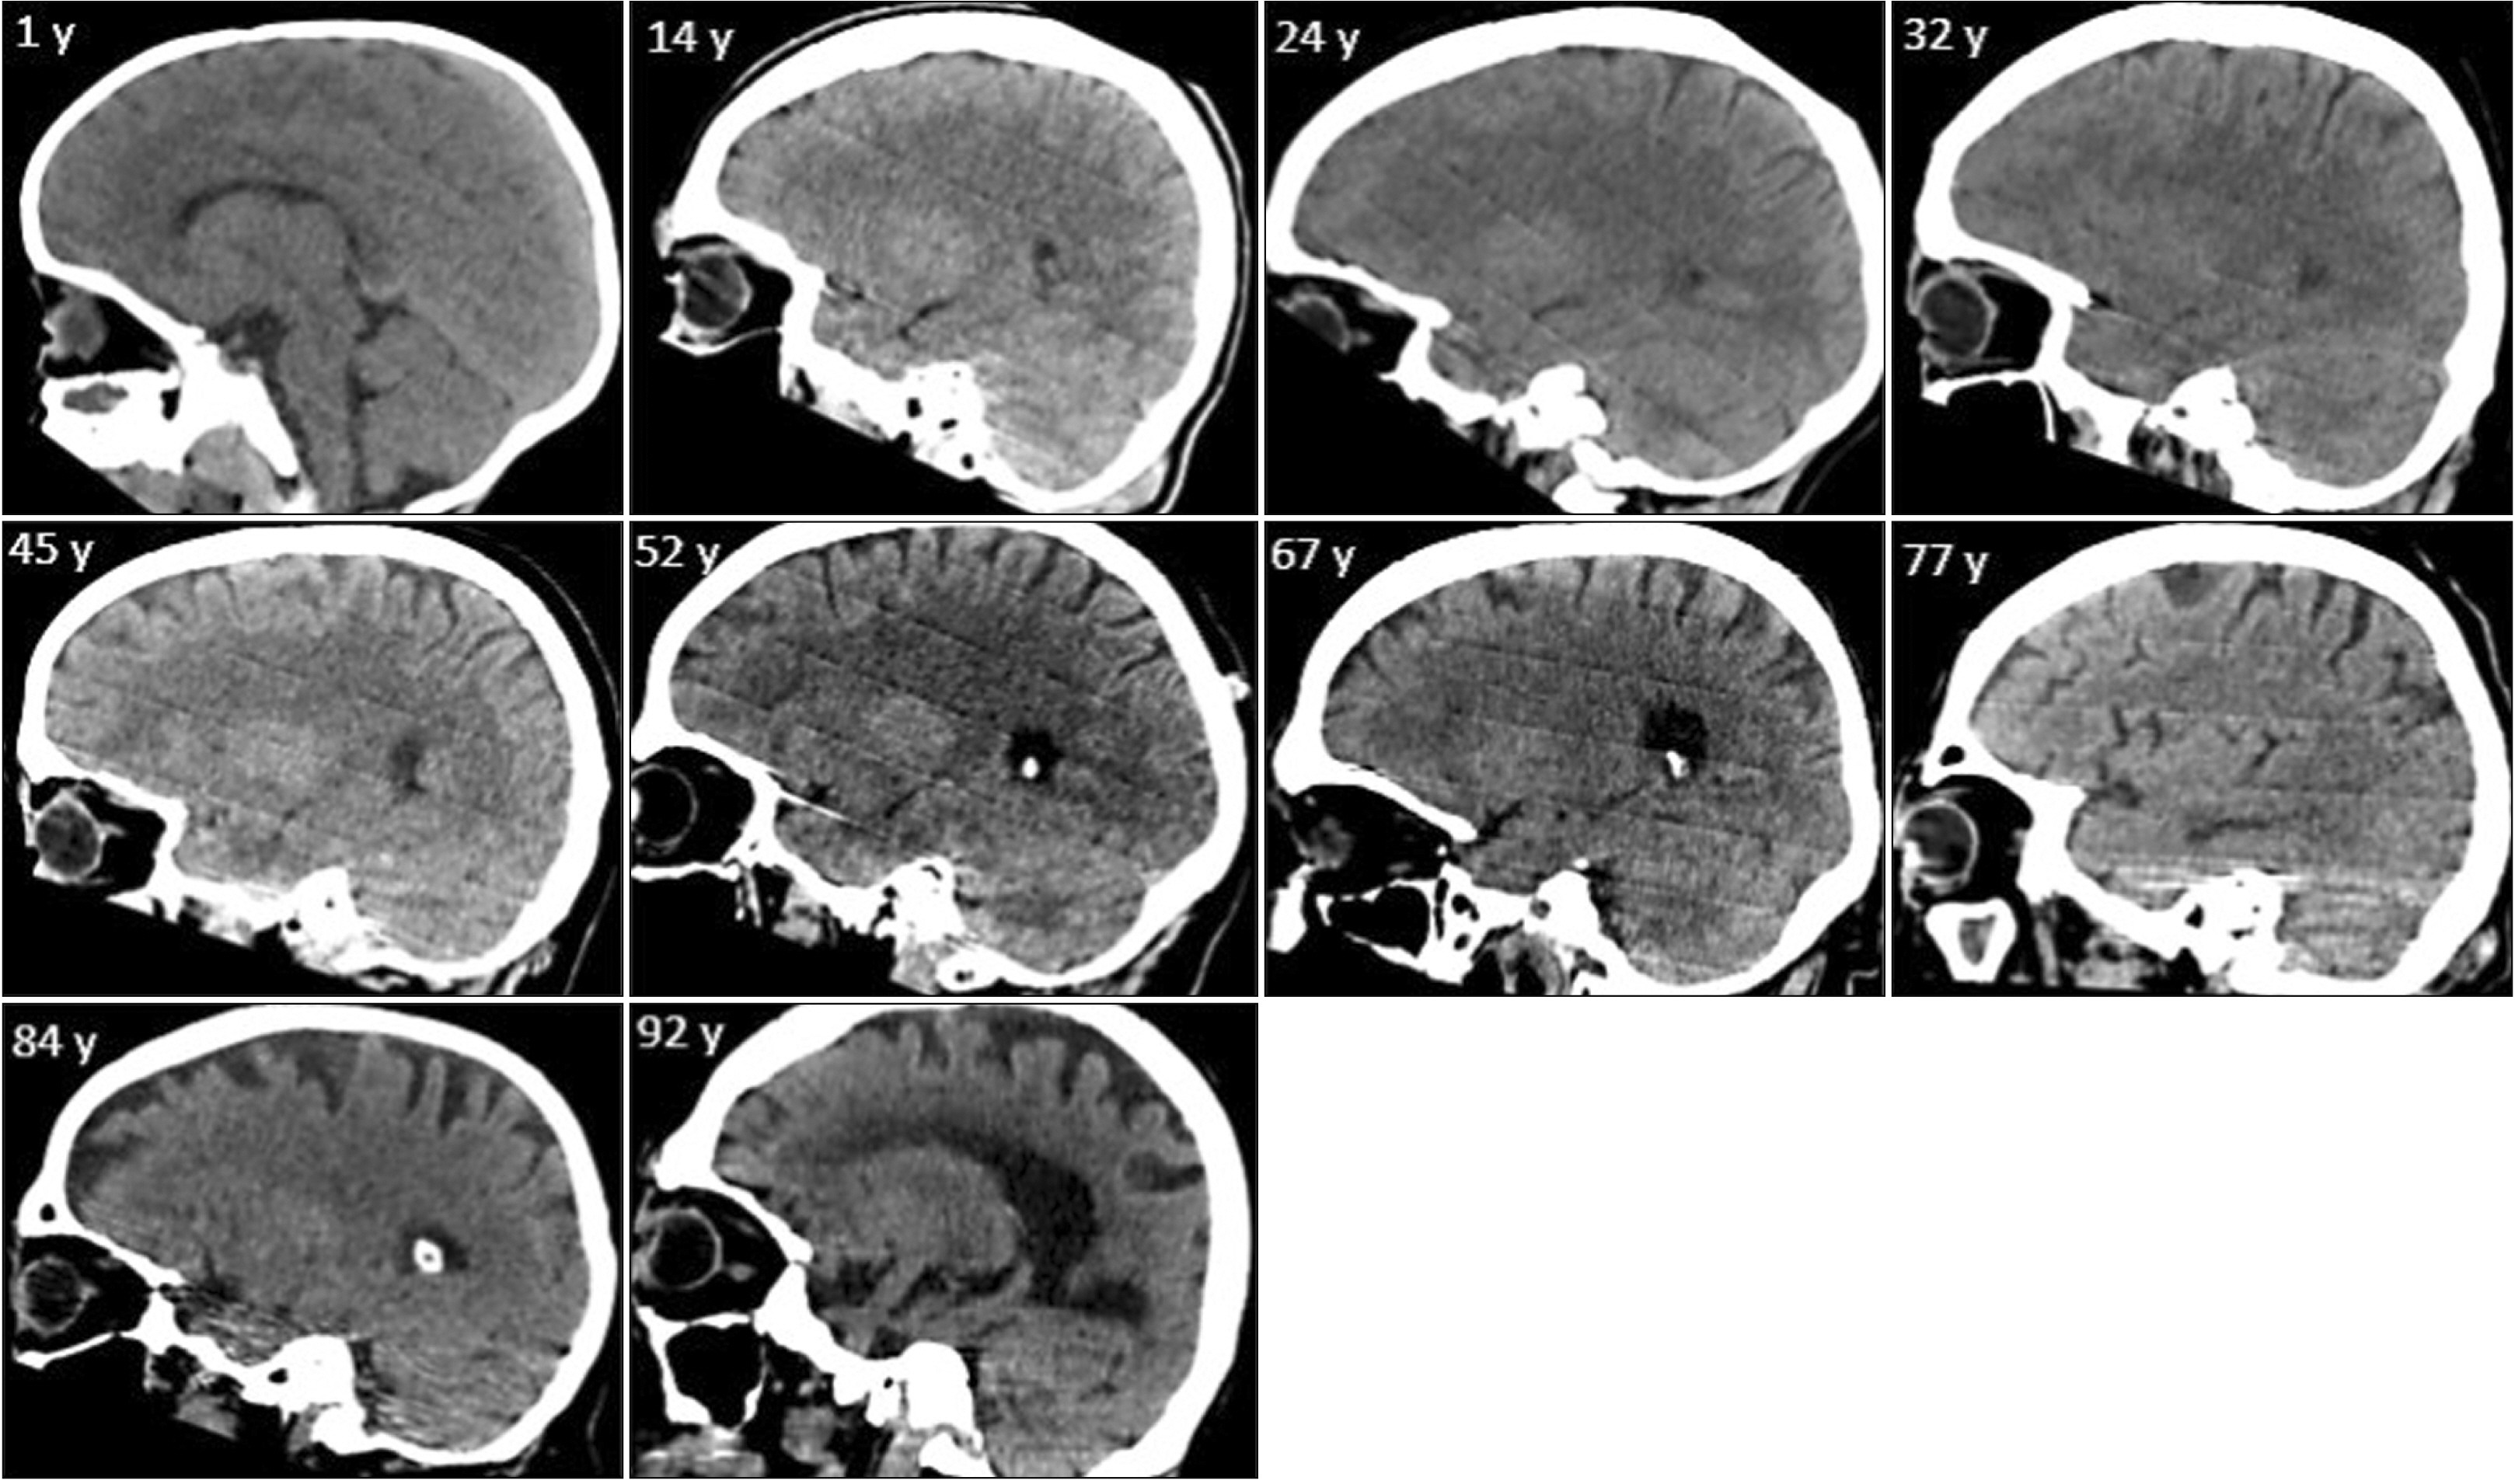
Fig. 8 Cortical atrophy in right hemisphere in each decade of life.
Reference
-
References
1. Berrington de Gonzalez A, Pasqual E, Veiga L. 2021; Epidemiological studies of CT scans and cancer risk: the state of the science. Br J Radiol. 94:20210471. Erratum in: Br J Radiol 2022;95: 20210471c. DOI: 10.1259/bjr.20210471. PMID: 34545766. PMCID: PMC9328069.
Article2. Ghorbanlou M, Moradi F, Mehdizadeh M. 2022; Frequency, shape, and estimated volume of intracranial physiologic calcification in different age groups investigated by brain computed tomography scan: a retrospective study. Anat Cell Biol. 55:63–71. DOI: 10.5115/acb.21.137. PMID: 34866062. PMCID: PMC8968236.
Article3. Ugwuanyi DC, Sibeudu TF, Irole CP, Ogolodom MP, Nwagbara CT, Ibekwe AM, Mbaba AN. 2020; Evaluation of common findings in brain computerized tomography (CT) scan: a single center study. AIMS Neurosci. 7:311–8. DOI: 10.3934/Neuroscience.2020017. PMID: 32995488. PMCID: PMC7519969.
Article4. Currà A, Pierelli F, Gasbarrone R, Mannarelli D, Nofroni I, Matone V, Marinelli L, Trompetto C, Fattapposta F, Missori P. 2019; The ventricular system enlarges abnormally in the seventies, earlier in men, and first in the frontal horn: a study based on more than 3,000 scans. Front Aging Neurosci. 11:294. DOI: 10.3389/fnagi.2019.00294. PMID: 31749695. PMCID: PMC6848156.
Article5. Chrzan R, Gleń A, Bryll A, Urbanik A. 2019; Computed tomography assessment of brain atrophy in centenarians. Int J Environ Res Public Health. 16:3659. DOI: 10.3390/ijerph16193659. PMID: 31569457. PMCID: PMC6801833.
Article6. Ghorbanlou M, Moradi F, Asgari HR. 2022; Morphometric study of sternum by computed tomography in an Iranian population: a method to discriminate between male and female. Forensic Imaging. 28:200501. DOI: 10.1016/j.fri.2022.200501.
Article7. Kolsur N, PM R, Shetty S, Kumar A. 2018; Morphometric study of ventricular indices in human brain using computed tomography scans in Indian population. Int J Anat Res. 6:5574–80. DOI: 10.16965/ijar.2018.286.8. Sungura R, Onyambu C, Mpolya E, Sauli E, Vianney JM. 2021; The extended scope of neuroimaging and prospects in brain atrophy mitigation: a systematic review. Interdiscip Neurosurg. 23:100875. DOI: 10.1016/j.inat.2020.100875.
Article9. Xiong YY, Mok V. 2011; Age-related white matter changes. J Aging Res. 2011:617927. DOI: 10.4061/2011/617927. PMID: 21876810. PMCID: PMC3163144.
Article10. Bagarinao E, Watanabe H, Maesawa S, Mori D, Hara K, Kawabata K, Yoneyama N, Ohdake R, Imai K, Masuda M, Yokoi T, Ogura A, Wakabayashi T, Kuzuya M, Ozaki N, Hoshiyama M, Isoda H, Naganawa S, Sobue G. 2018; An unbiased data-driven age-related structural brain parcellation for the identification of intrinsic brain volume changes over the adult lifespan. Neuroimage. 169:134–44. DOI: 10.1016/j.neuroimage.2017.12.014. PMID: 29225065.
Article11. He W, Fang X, Wang X, Gao P, Gao X, Zhou X, Mao R, Hu J, Hua Y, Xia J. 2020; A new index for assessing cerebral ventricular volume in idiopathic normal-pressure hydrocephalus: a comparison with Evans' index. Neuroradiology. 62:661–7. DOI: 10.1007/s00234-020-02361-8. PMID: 32008047.
Article12. Yang WJ, Wasserman BA, Zheng L, Huang ZQ, Li J, Abrigo J, Wong SS, Ying MT, Chu WC, Wong LK, Leung TW, Chen XY. 2021; Understanding the clinical implications of intracranial arterial calcification using brain CT and vessel wall imaging. Front Neurol. 12:619233. DOI: 10.3389/fneur.2021.619233. PMID: 34335434. PMCID: PMC8319500.
Article13. Dzefi-Tettey K, Edzie EKM, Gorleku PN, Brakohiapa EK, Osei B, Asemah AR, Kusodzi H. 2021; Evans index among adult Ghanaians on normal head computerized tomography scan. Heliyon. 7:e06982. DOI: 10.1016/j.heliyon.2021.e06982. PMID: 34027182. PMCID: PMC8129941.
Article14. Cherbuin N, Réglade-Meslin C, Kumar R, Sachdev P, Anstey KJ. 2010; Mild cognitive disorders are associated with different patterns of brain asymmetry than normal aging: the path through life study. Front Psychiatry. 1:11. DOI: 10.3389/fpsyt.2010.00011. PMID: 21423423. PMCID: PMC3059654.
Article15. Kiroğlu Y, Karabulut N, Oncel C, Yagci B, Sabir N, Ozdemir B. 2008; Cerebral lateral ventricular asymmetry on CT: how much asymmetry is representing pathology? Surg Radiol Anat. 30:249–55. DOI: 10.1007/s00276-008-0314-9. PMID: 18253688.
Article16. Selkoe DJ, Hardy J. 2016; The amyloid hypothesis of Alzheimer's disease at 25 years. EMBO Mol Med. 8:595–608. DOI: 10.15252/emmm.201606210. PMID: 27025652. PMCID: PMC4888851.
Article17. Anderson VM, Fox NC, Miller DH. 2006; Magnetic resonance imaging measures of brain atrophy in multiple sclerosis. J Magn Reson Imaging. 23:605–18. DOI: 10.1002/jmri.20550. PMID: 16596564.
Article18. Madan CR. 2017; Advances in studying brain morphology: the benefits of open-access data. Front Hum Neurosci. 11:405. DOI: 10.3389/fnhum.2017.00405. PMID: 28824407. PMCID: PMC5543094.
Article19. Ritter A, Hawley N, Banks SJ, Miller JB. 2017; The association between Montreal Cognitive Assessment memory scores and hippocampal volume in a neurodegenerative disease sample. J Alzheimers Dis. 58:695–9. DOI: 10.3233/JAD-161241. PMID: 28453481. PMCID: PMC5467712.
Article20. Ferreira D, Hansson O, Barroso J, Molina Y, Machado A, Hernández-Cabrera JA, Muehlboeck JS, Stomrud E, Nägga K, Lindberg O, Ames D, Kalpouzos G, Fratiglioni L, Bäckman L, Graff C, Mecocci P, Vellas B, Tsolaki M, Kłoszewska I, Soininen H, Lovestone S, Ahlström H, Lind L, Larsson EM, Wahlund LO, Simmons A, Westman E. 2017; The interactive effect of demographic and clinical factors on hippocampal volume: a multicohort study on 1958 cognitively normal individuals. Hippocampus. 27:653–67. DOI: 10.1002/hipo.22721. PMID: 28394034.
Article21. Wang Y, Leiberg K, Ludwig T, Little B, Necus JH, Winston G, Vos SB, Tisi J, Duncan JS, Taylor PN, Mota B. 2021; Independent components of human brain morphology. Neuroimage. 226:117546. DOI: 10.1016/j.neuroimage.2020.117546. PMID: 33186714. PMCID: PMC7836233.
Article
- Full Text Links
-
- Actions
-
Cited
- CITED
-
- Close
- Share
-
- Similar articles
-
- Clinical study of subcortical aphasia using brain SPECT and neurolinguistical methods
- Significance of frontal cortical atrophy in Parkinson's disease: computed tomographic study
- Subcortical Aphasia in Stroke Patients
- Abnormalities of Brain Computed Tomographic Scan and Magnetic Resonance Imaging in Headache Patients with Normal Neurologic Examination
- The bone density of mandible as the aging process in Koreans
