Korean J Orthod.
2022 Nov;52(6):420-431. 10.4041/kjod22.123.
Periodontal parameters in orthodontically tractioned teeth: A systematic review and meta-analysis
- Affiliations
-
- 1Postgraduate Program in Dentistry, Pontifícia Universidade Católica do Paraná, Curitiba, Paraná, Brazil
- 2Postgraduate Program in Communication Disorders, Tuiuti University of Paraná, Curitiba, Brazil
- 3Center for Advanced Studies in Systematic Review and Meta-analysis -NARSM, Curitiba, Paraná, Brazil
- 4Undergraduate Dentistry Program, Tuiuti University of Paraná, Curitiba, Brazil
- 5Department of Orthodontics, Pontifícia Universidade Católica do Paraná, Curitiba, Paraná, Brazil
- KMID: 2536335
- DOI: http://doi.org/10.4041/kjod22.123
Abstract
Objective
This systematic review aimed to evaluate periodontal parameters in orthodontically tractioned teeth compared with the respective non-tractioned contralateral teeth.
Methods
Search strategies were developed for six electronic databases and gray literature. Random-effects meta-analyses were performed for the outcomes of interest. Furthermore, the certainty of the evidence was assessed using the GRADE (Grading of Recommendations Assessment, Development, and Evaluation) tool.
Results
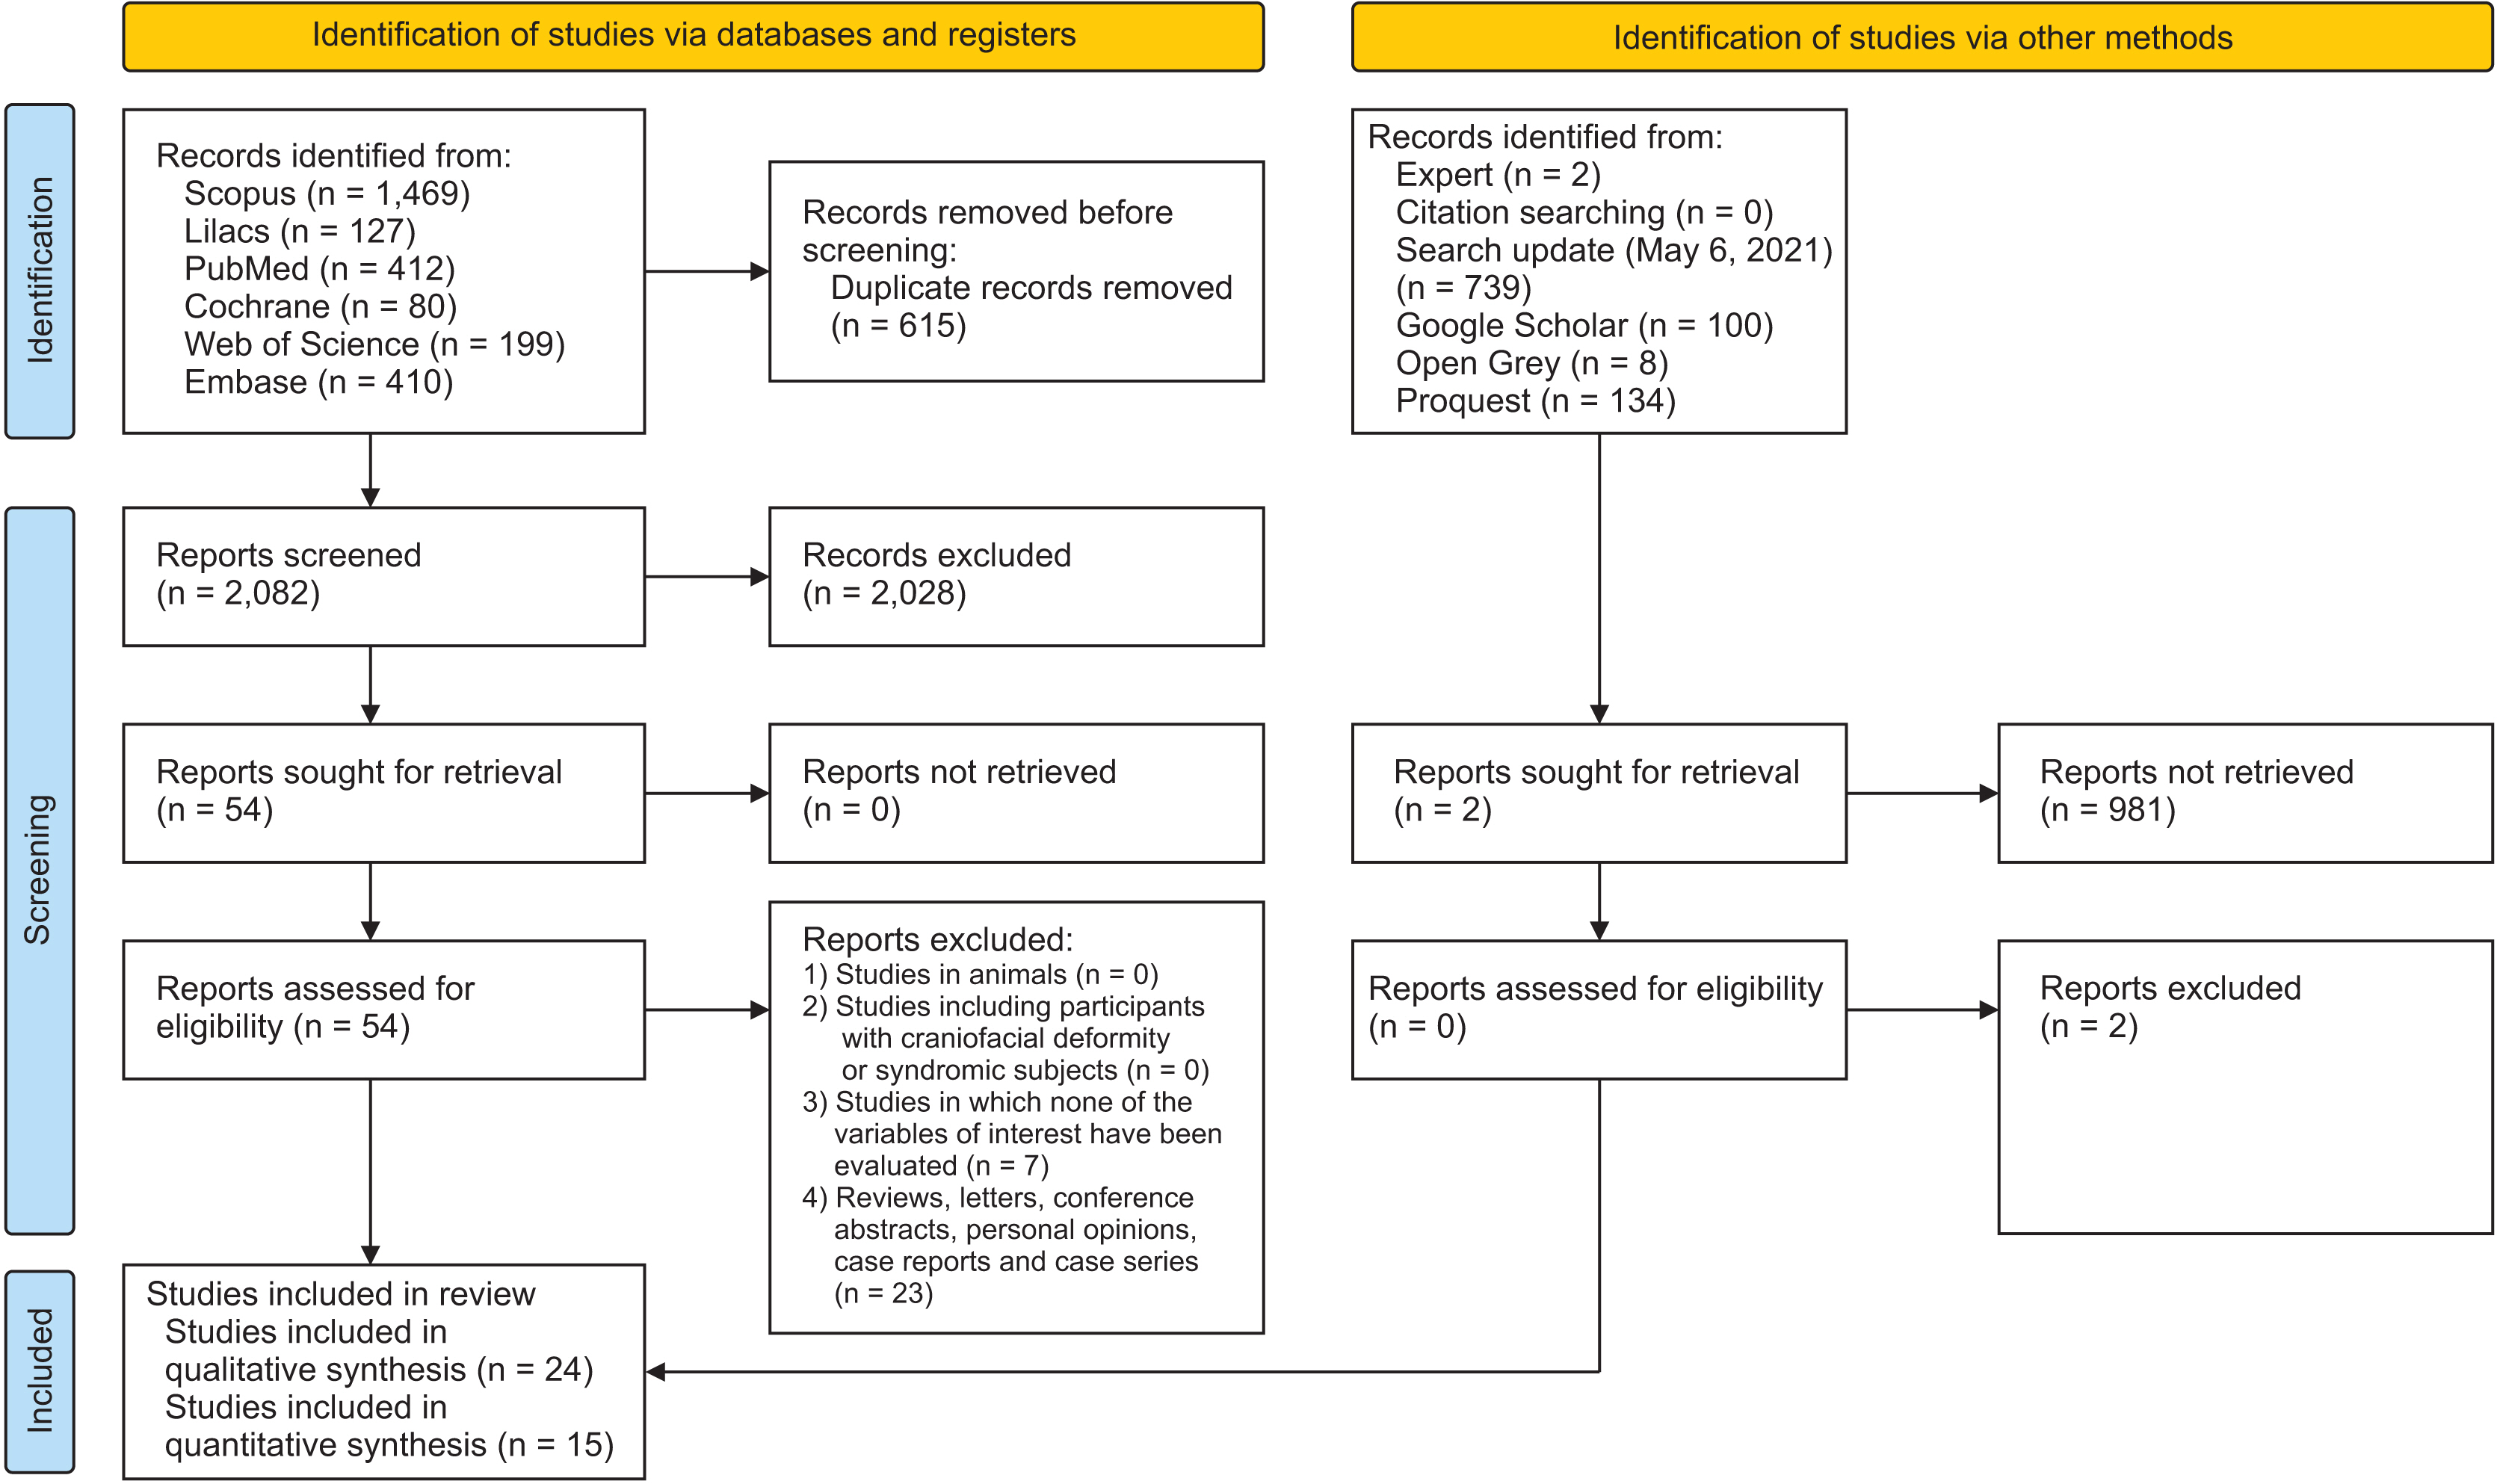
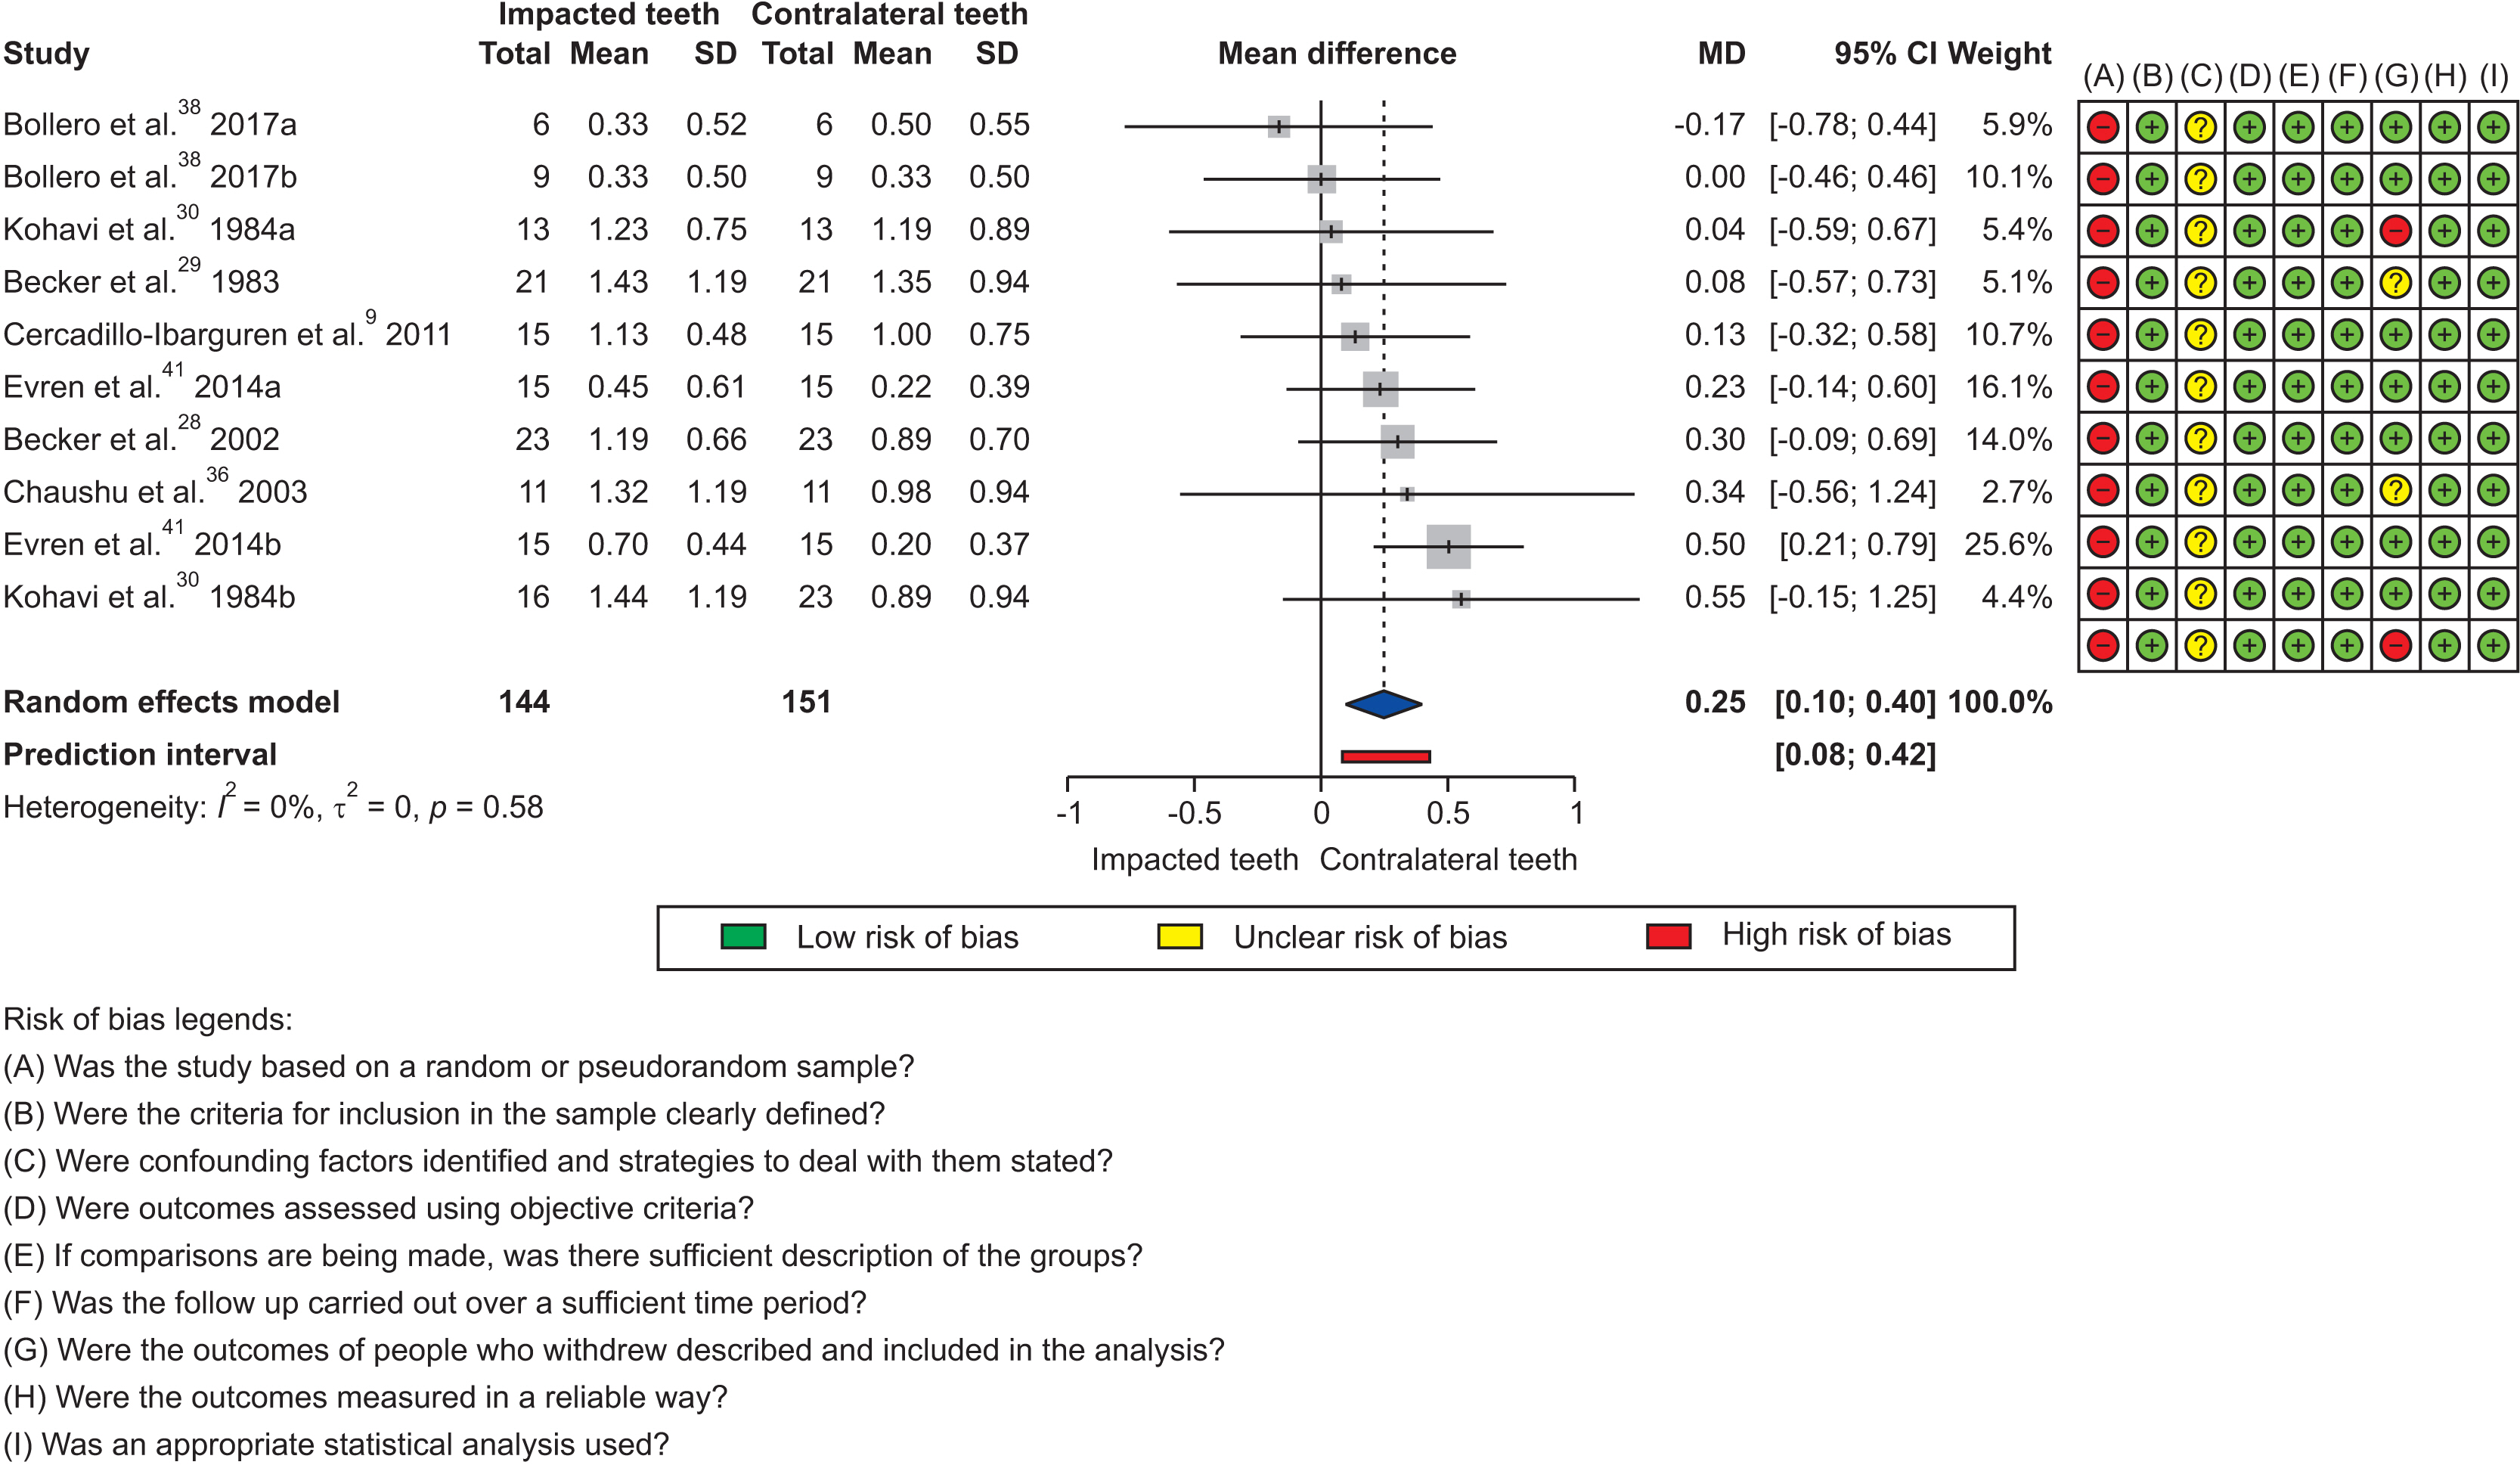
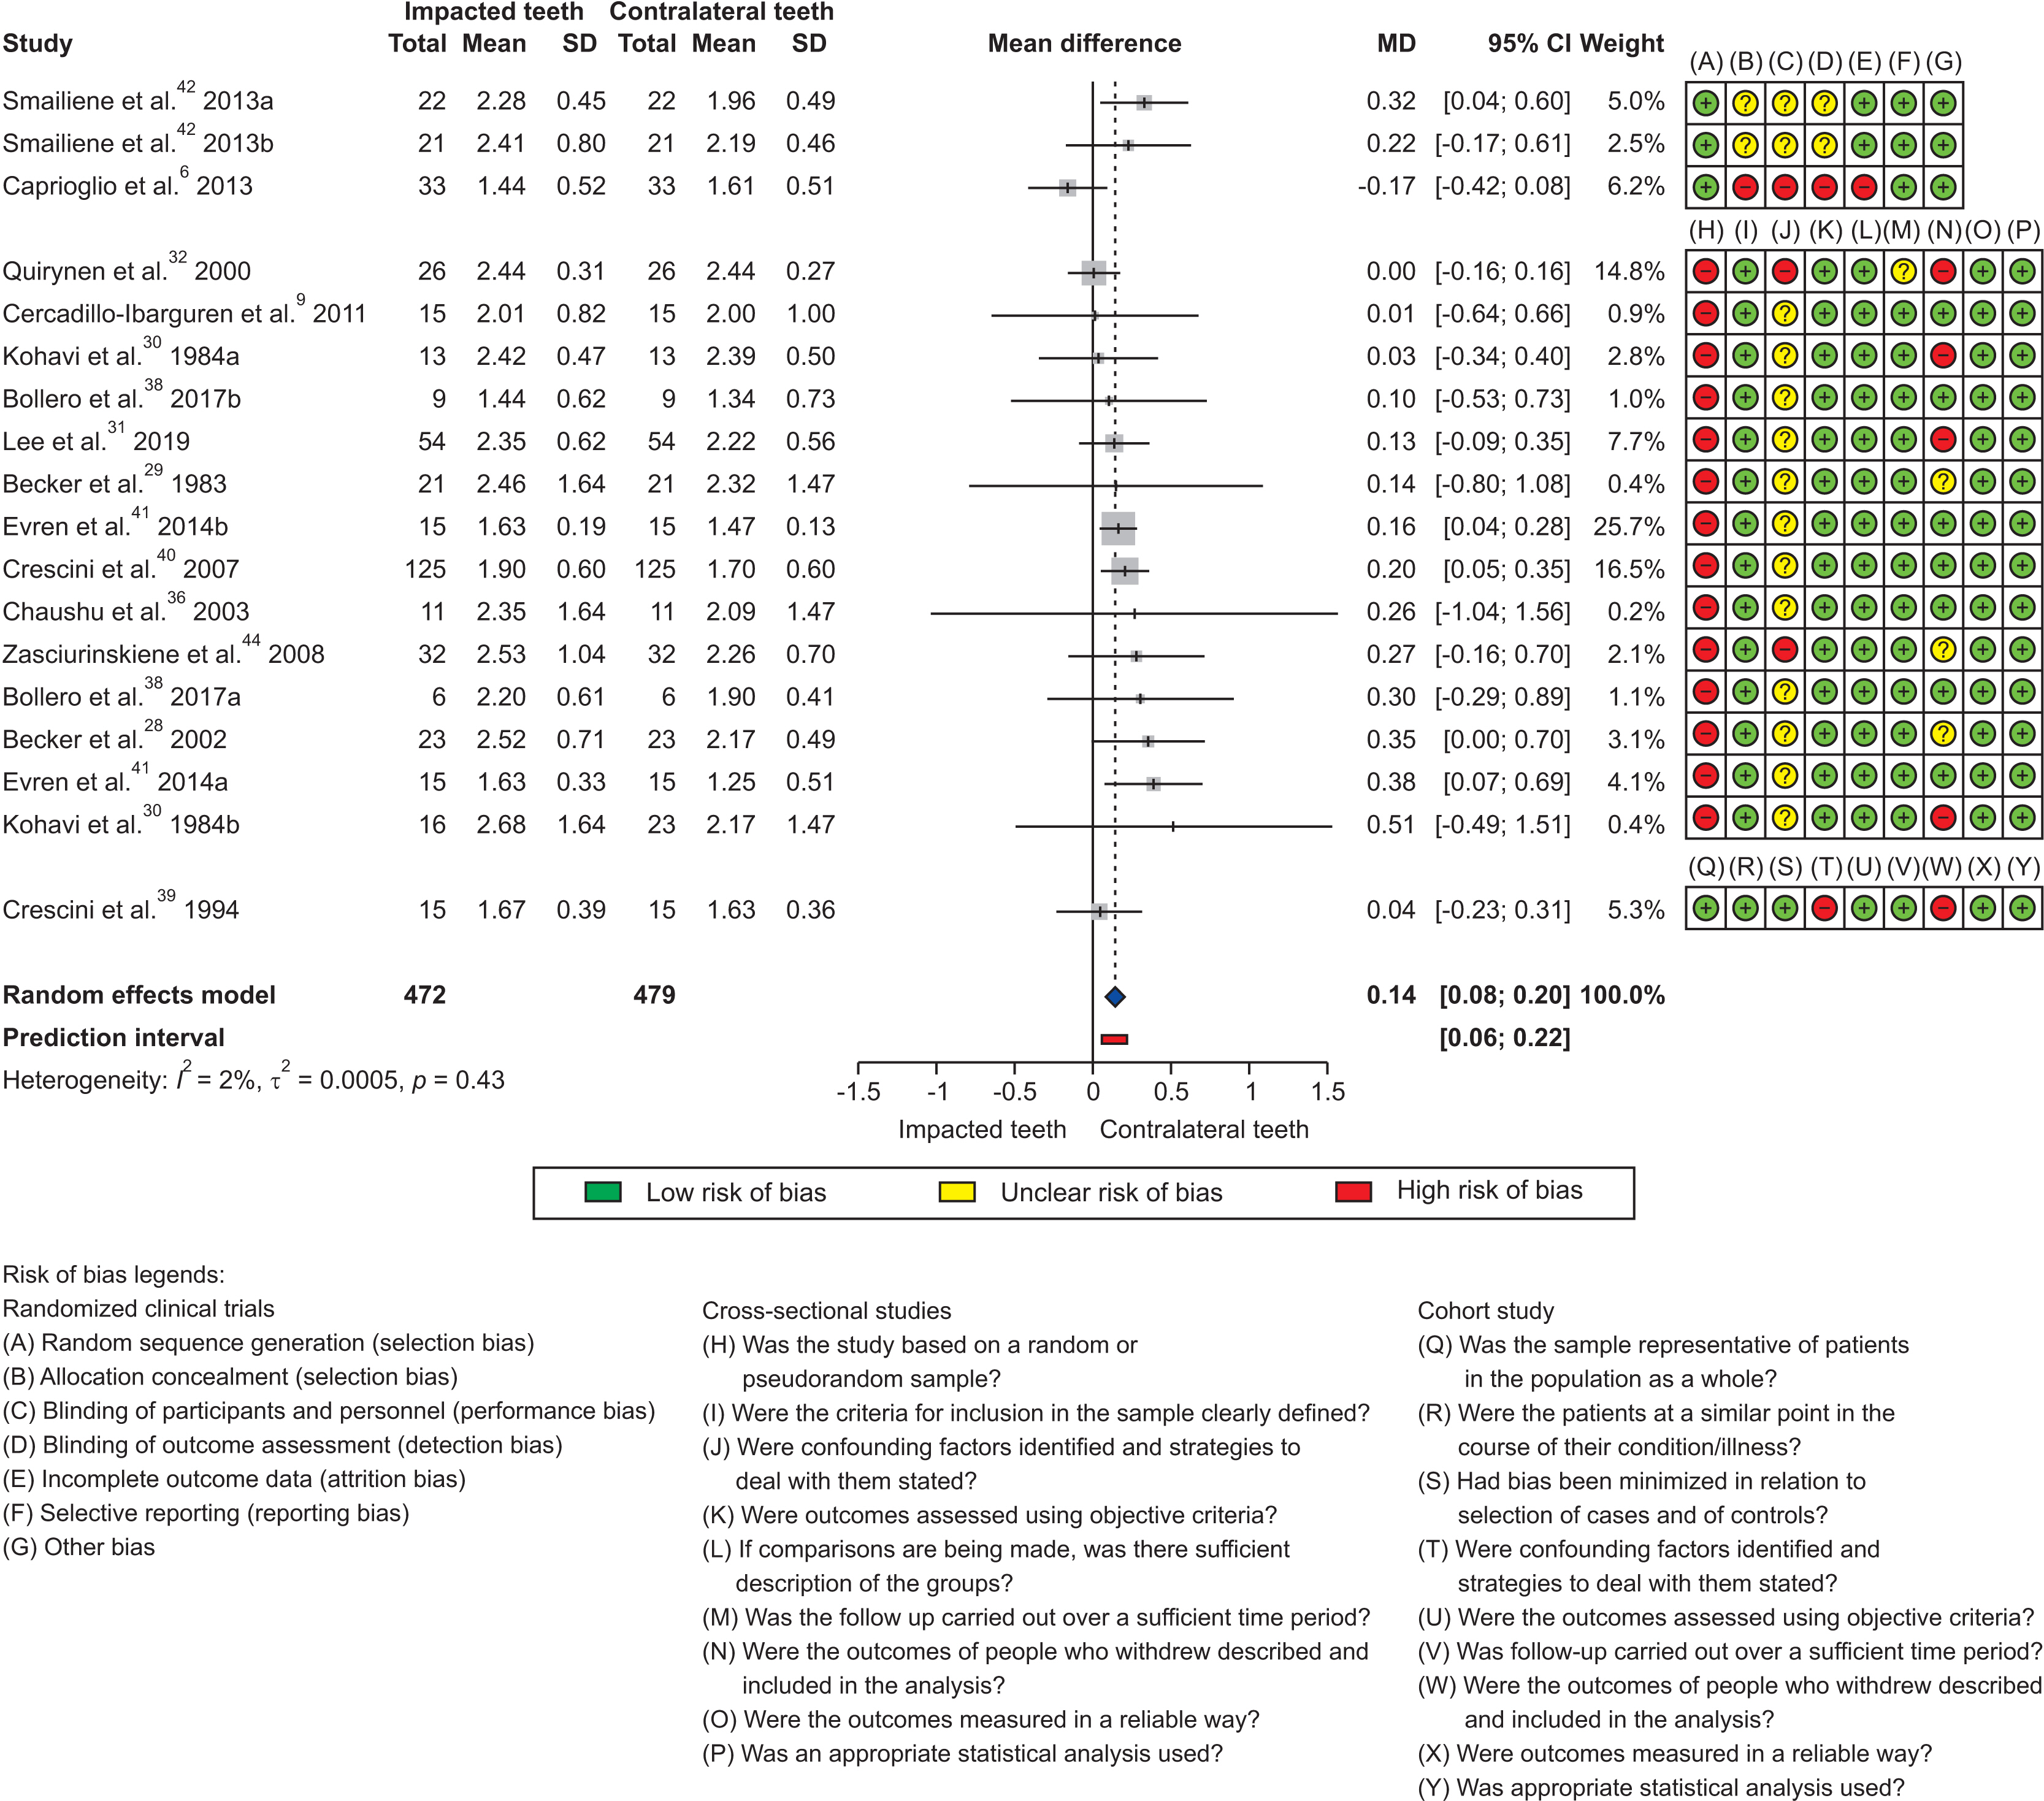
Overall, 2,082 articles were identified, of which 24 were selected for the qualitative synthesis. A significant difference was observed between the impacted and contralateral teeth (mean difference [MD] = 0.25; 95% confidence interval [CI] = 0.10–0.40; I 2 = 0%) when the gingival index was evaluated. Additionally, impacted teeth showed a greater probing depth, with a significant mean difference between the groups (MD = 0.14; 95% CI = 0.07–0.20; I 2 = 6%). Most studies had a low risk of bias; however, the certainty of the evidence was very low owing to the design of existing studies.
Conclusions
The evidence in the literature indicated that tractioned teeth might show worsening of periodontal parameters related to the gingival index and probing depth; however, the evidence remains uncertain about this outcome. Furthermore, probing depth should be considered regarding its clinical significance because of the small effect size observed.
Keyword
Figure
Reference
-
1. Thilander B, Myrberg N. 1973; The prevalence of malocclusion in Swedish schoolchildren. Scand J Dent Res. 81:12–21. DOI: 10.1111/j.1600-0722.1973.tb01489.x. PMID: 4510864. PMID: https://www.scopus.com/inward/record.uri?partnerID=HzOxMe3b&scp=84984483775&origin=inward.2. Campbell CM, DiBiase A, Fleming PS. 2014; Concomitant dilaceration, transposition, and intraosseous migration: report of a patient treated with maxillary canine-central incisor substitution. Am J Orthod Dentofacial Orthop. 146:514–21. DOI: 10.1016/j.ajodo.2013.11.024. PMID: 25263154. PMID: https://www.scopus.com/inward/record.uri?partnerID=HzOxMe3b&scp=84908014602&origin=inward.3. Cavuoti S, Matarese G, Isola G, Abdolreza J, Femiano F, Perillo L. 2016; Combined orthodontic-surgical management of a transmigrated mandibular canine. Angle Orthod. 86:681–91. DOI: 10.2319/050615-309.1. PMID: 26502299. PMCID: PMC8601488. PMID: https://www.scopus.com/inward/record.uri?partnerID=HzOxMe3b&scp=84976412689&origin=inward.4. Kokich VG. 2004; Surgical and orthodontic management of impacted maxillary canines. Am J Orthod Dentofacial Orthop. 126:278–83. DOI: 10.1016/j.ajodo.2004.06.009. PMID: 15356485. PMID: https://www.scopus.com/inward/record.uri?partnerID=HzOxMe3b&scp=4444226191&origin=inward.5. Stellzig A, Basdra EK, Komposch G. 1994; The etiology of canine tooth impaction--a space analysis. Fortschr Kieferorthop. 55:97–103. German. DOI: 10.1007/BF02341481. PMID: 8045486. PMID: https://www.scopus.com/inward/record.uri?partnerID=HzOxMe3b&scp=0028456980&origin=inward.6. Caprioglio A, Vanni A, Bolamperti L. 2013; Long-term periodontal response to orthodontic treatment of palatally impacted maxillary canines. Eur J Orthod. 35:323–8. DOI: 10.1093/ejo/cjs020. PMID: 22531665. PMID: https://www.scopus.com/inward/record.uri?partnerID=HzOxMe3b&scp=84878558810&origin=inward.7. Chu FC, Li TK, Lui VK, Newsome PR, Chow RL, Cheung LK. 2003; Prevalence of impacted teeth and associated pathologies--a radiographic study of the Hong Kong Chinese population. Hong Kong Med J. 9:158–63. PMID: 12777649. PMID: https://www.scopus.com/inward/record.uri?partnerID=HzOxMe3b&scp=0038352250&origin=inward.8. Hattab FN, Rawashdeh MA, Fahmy MS. 1995; Impaction status of third molars in Jordanian students. Oral Surg Oral Med Oral Pathol Oral Radiol Endod. 79:24–9. DOI: 10.1016/S1079-2104(05)80068-X. PMID: 7614155. PMID: https://www.scopus.com/inward/record.uri?partnerID=HzOxMe3b&scp=0029186007&origin=inward.9. Cercadillo-Ibarguren I, Gargallo-Albiol J, Abad-Sánchez D, Echeverría-García JJ, Berini-Aytés L, Gay-Escoda C. 2011; Periodontal health and esthetic results in impacted teeth exposed by apically positioned flap technique. Med Oral Patol Oral Cir Bucal. 16:e89–95. DOI: 10.4317/medoral.16.e89. PMID: 20711131. PMID: https://www.scopus.com/inward/record.uri?partnerID=HzOxMe3b&scp=78751661441&origin=inward.10. Hashemipour MA, Tahmasbi-Arashlow M, Fahimi-Hanzaei F. 2013; Incidence of impacted mandibular and maxillary third molars: a radiographic study in a Southeast Iran population. Med Oral Patol Oral Cir Bucal. 18:e140–5. DOI: 10.4317/medoral.18028. PMID: 23229243. PMCID: PMC3548634. PMID: https://www.scopus.com/inward/record.uri?partnerID=HzOxMe3b&scp=84871888774&origin=inward.11. Hugoson A, Kugelberg CF. 1988; The prevalence of third molars in a Swedish population. An epidemiological study. Community Dent Health. 5:121–38. PMID: 3165039. PMID: https://www.scopus.com/inward/record.uri?partnerID=HzOxMe3b&scp=0024026048&origin=inward.12. Aydin U, Yilmaz HH, Yildirim D. 2004; Incidence of canine impaction and transmigration in a patient population. Dentomaxillofac Radiol. 33:164–9. DOI: 10.1259/dmfr/15470658. PMID: 15371316. PMID: https://www.scopus.com/inward/record.uri?partnerID=HzOxMe3b&scp=7944224758&origin=inward.13. Oliver RG, Mannion JE, Robinson JM. 1989; Morphology of the maxillary lateral incisor in cases of unilateral impaction of the maxillary canine. Br J Orthod. 16:9–16. DOI: 10.1179/bjo.16.1.9. PMID: 2923851. PMID: https://www.scopus.com/inward/record.uri?partnerID=HzOxMe3b&scp=0024616613&origin=inward.14. Crescini A, Nieri M, Buti J, Baccetti T, Pini Prato GP. 2007; Pre-treatment radiographic features for the periodontal prognosis of treated impacted canines. J Clin Periodontol. 34:581–7. DOI: 10.1111/j.1600-051X.2007.01094.x. PMID: 17555411. PMID: https://www.scopus.com/inward/record.uri?partnerID=HzOxMe3b&scp=34250008744&origin=inward.15. Axelsson P, Lindhe J. 1978; Effect of controlled oral hygiene procedures on caries and periodontal disease in adults. J Clin Periodontol. 5:133–51. DOI: 10.1111/j.1600-051X.1978.tb01914.x. PMID: 275282. PMID: https://www.scopus.com/inward/record.uri?partnerID=HzOxMe3b&scp=0017875739&origin=inward.16. Pearson MH, Robinson SN, Reed R, Birnie DJ, Zaki GA. 1997; Management of palatally impacted canines: the findings of a collaborative study. Eur J Orthod. 19:511–5. DOI: 10.1093/ejo/19.5.511. PMID: 9386337. PMID: https://www.scopus.com/inward/record.uri?partnerID=HzOxMe3b&scp=0031255497&origin=inward.17. Cutroneo G, Piancino MG, Ramieri G, Bracco P, Vita G, Isola G, et al. 2012; Expression of muscle-specific integrins in masseter muscle fibers during malocclusion disease. Int J Mol Med. 30:235–42. DOI: 10.3892/ijmm.2012.986. PMID: 22552408. PMID: https://www.scopus.com/inward/record.uri?partnerID=HzOxMe3b&scp=84863558404&origin=inward.18. Piancino MG, Isola G, Merlo A, Dalessandri D, Debernardi C, Bracco P. 2012; Chewing pattern and muscular activation in open bite patients. J Electromyogr Kinesiol. 22:273–9. DOI: 10.1016/j.jelekin.2011.12.003. PMID: 22236764. PMID: https://www.scopus.com/inward/record.uri?partnerID=HzOxMe3b&scp=84857030884&origin=inward.19. Alamri A, Alshahrani N, Al-Madani A, Shahin S, Nazir M. 2020; Prevalence of impacted teeth in Saudi patients attending dental clinics in the Eastern province of Saudi Arabia: a radiographic retrospective study. ScientificWorldJournal. 2020:8104904. DOI: 10.1155/2020/8104904. PMID: 32952455. PMCID: PMC7481944. PMID: https://www.scopus.com/inward/record.uri?partnerID=HzOxMe3b&scp=85091266390&origin=inward.20. de Araujo CM, Trannin PD, Schroder AGD, Stechman-Neto J, Cavalcante-Leão BL, Mattos NHR, et al. 2020; Surgical-periodontal aspects in orthodontic traction of palatally displaced canines: a meta-analysis. Jpn Dent Sci Rev. 56:164–76. DOI: 10.1016/j.jdsr.2020.10.001. PMID: 33294059. PMCID: PMC7701265. PMID: https://www.scopus.com/inward/record.uri?partnerID=HzOxMe3b&scp=85097434912&origin=inward.21. Page MJ, Moher D, Bossuyt PM, Boutron I, Hoffmann TC, Mulrow CD, et al. 2021; PRISMA 2020 explanation and elaboration: updated guidance and exemplars for reporting systematic reviews. BMJ. 372:n160. DOI: 10.1136/bmj.n160. PMID: 33781993. PMCID: PMC8005925. PMID: https://www.scopus.com/inward/record.uri?partnerID=HzOxMe3b&scp=85103235741&origin=inward.22. Silness J, Loe H. 1964; Periodontal disease in pregnancy. II. Correlation between oral hygiene and periodontal condtion. Acta Odontol Scand. 22:121–35. DOI: 10.3109/00016356408993968. PMID: 14158464. PMID: https://www.scopus.com/inward/record.uri?partnerID=HzOxMe3b&scp=75949163484&origin=inward.23. Carter HG, Barnes GP. 1974; The Gingival Bleeding Index. J Periodontol. 45:801–5. DOI: 10.1902/jop.1974.45.11.801. PMID: 4547795. PMID: https://www.scopus.com/inward/record.uri?partnerID=HzOxMe3b&scp=0016296301&origin=inward.24. The Joanna Briggs Institute. 2014. Joanna Briggs Institute reviewers' manual. The Joanna Briggs Institute;Adelaide: PMID: https://www.scopus.com/inward/record.uri?partnerID=HzOxMe3b&scp=0024026048&origin=inward.25. Higgins JP, Altman DG, Gøtzsche PC, Jüni P, Moher D, Oxman AD, et al. 2011; The Cochrane Collaboration's tool for assessing risk of bias in randomised trials. BMJ. 343:d5928. DOI: 10.1136/bmj.d5928. PMID: 22008217. PMCID: PMC3196245. PMID: https://www.scopus.com/inward/record.uri?partnerID=HzOxMe3b&scp=84859001212&origin=inward.26. Viechtbauer W, Cheung MW. 2010; Outlier and influence diagnostics for meta-analysis. Res Synth Methods. 1:112–25. DOI: 10.1002/jrsm.11. PMID: 26061377.27. Manheimer E. 2012; Summary of findings tables: presenting the main findings of Cochrane complementary and alternative medicine-related reviews in a transparent and simple tabular format. Glob Adv Health Med. 1:90–1. DOI: 10.7453/gahmj.2012.1.1.015. PMID: 24278805. PMCID: PMC3833472. PMID: https://www.scopus.com/inward/record.uri?partnerID=HzOxMe3b&scp=85115900710&origin=inward.28. Becker A, Brin I, Ben-Bassat Y, Zilberman Y, Chaushu S. 2002; Closed-eruption surgical technique for impacted maxillary incisors: a postorthodontic periodontal evaluation. Am J Orthod Dentofacial Orthop. 122:9–14. DOI: 10.1067/mod.2002.124998. PMID: 12142887. PMID: https://www.scopus.com/inward/record.uri?partnerID=HzOxMe3b&scp=0036633860&origin=inward.29. Becker A, Kohavi D, Zilberman Y. 1983; Periodontal status following the alignment of palatally impacted canine teeth. Am J Orthod. 84:332–6. DOI: 10.1016/S0002-9416(83)90349-4. PMID: 6578683. PMID: https://www.scopus.com/inward/record.uri?partnerID=HzOxMe3b&scp=0021073065&origin=inward.30. Kohavi D, Zilberman Y, Becker A. 1984; Periodontal status following the alignment of buccally ectopic maxillary canine teeth. Am J Orthod. 85:78–82. DOI: 10.1016/0002-9416(84)90125-8. PMID: 6581729. PMID: https://www.scopus.com/inward/record.uri?partnerID=HzOxMe3b&scp=0021300914&origin=inward.31. Lee JY, Choi YJ, Choi SH, Chung CJ, Yu HS, Kim KH. 2019; Labially impacted maxillary canines after the closed eruption technique and orthodontic traction: a split-mouth comparison of periodontal recession. J Periodontol. 90:35–43. DOI: 10.1002/JPER.18-0034. PMID: 30001475. PMID: https://www.scopus.com/inward/record.uri?partnerID=HzOxMe3b&scp=85059383279&origin=inward.32. Quirynen M, Op Heij DG, Adriansens A, Opdebeeck HM, van Steenberghe D. 2000; Periodontal health of orthodontically extruded impacted teeth. A split-mouth, long-term clinical evaluation. J Periodontol. 71:1708–14. DOI: 10.1902/jop.2000.71.11.1708. PMID: 11128918. PMID: https://www.scopus.com/inward/record.uri?partnerID=HzOxMe3b&scp=0034324086&origin=inward.33. Landim FS, de Freitas GB, Rocha NS, Caubi AF, Vasconcellos RJH. 2010; Clinical-radiographic analysis of canines after orthodonthic-surgical treatment. Rev Cir Traumatol Buco Maxilo Fac. 10:103–10. Português. PMID: https://www.scopus.com/inward/record.uri?partnerID=HzOxMe3b&scp=0024026048&origin=inward.34. Odenrick L, Modéer T. 1978; Peridontal status following surgical-orthodontic alignment of impacted teeth. Acta Odontol Scand. 36:233–6. DOI: 10.3109/00016357809004673. PMID: 280118. PMID: https://www.scopus.com/inward/record.uri?partnerID=HzOxMe3b&scp=0017869506&origin=inward.35. Caminiti MF, Sandor GK, Giambattistini C, Tompson B. 1998; Outcomes of the surgical exposure, bonding and eruption of 82 impacted maxillary canines. J Can Dent Assoc. 64:572–4. 576–9. PMID: 9785687. PMID: https://www.scopus.com/inward/record.uri?partnerID=HzOxMe3b&scp=0032150081&origin=inward.36. Chaushu S, Brin I, Ben-Bassat Y, Zilberman Y, Becker A. 2003; Periodontal status following surgical-orthodontic alignment of impacted central incisors with an open-eruption technique. Eur J Orthod. 25:579–84. DOI: 10.1093/ejo/25.6.579. PMID: 14700263. PMID: https://www.scopus.com/inward/record.uri?partnerID=HzOxMe3b&scp=1542577976&origin=inward.37. Chaushu S, Dykstein N, Ben-Bassat Y, Becker A. 2009; Periodontal status of impacted maxillary incisors uncovered by 2 different surgical techniques. J Oral Maxillofac Surg. 67:120–4. DOI: 10.1016/j.joms.2008.08.012. PMID: 19070757. PMID: https://www.scopus.com/inward/record.uri?partnerID=HzOxMe3b&scp=57349113198&origin=inward.38. Bollero P, Danesi C, Ricchiuti MR, Milazzo A, Mampieri G, Agrestini C, et al. 2017; Long-term periodontal status of palatally and buccally impacted canines after closed surgical-orthodontic approach. Oral Implantol (Rome). 10:162–71. DOI: 10.11138/orl/2017.10.2.162. PMID: 29876041. PMCID: PMC5965064. PMID: https://www.scopus.com/inward/record.uri?partnerID=HzOxMe3b&scp=85030634264&origin=inward.39. Crescini A, Clauser C, Giorgetti R, Cortellini P, Pini Prato GP. 1994; Tunnel traction of infraosseous impacted maxillary canines. A three-year periodontal follow-up. Am J Orthod Dentofacial Orthop. 105:61–72. DOI: 10.1016/S0889-5406(94)70100-8. PMID: 8291494. PMID: https://www.scopus.com/inward/record.uri?partnerID=HzOxMe3b&scp=0028058603&origin=inward.40. Crescini A, Nieri M, Buti J, Baccetti T, Mauro S, Prato GP. 2007; Short- and long-term periodontal evaluation of impacted canines treated with a closed surgical-orthodontic approach. J Clin Periodontol. 34:232–42. DOI: 10.1111/j.1600-051X.2006.01042.x. PMID: 17257160. PMID: https://www.scopus.com/inward/record.uri?partnerID=HzOxMe3b&scp=33846925506&origin=inward.41. Evren AD, Nevzatoğlu Ş, Arun T, Acar A. 2014; Periodontal status of ectopic canines after orthodontic treatment. Angle Orthod. 84:18–23. DOI: 10.2319/041513-290.1. PMID: 23841541. PMCID: PMC8683066. PMID: https://www.scopus.com/inward/record.uri?partnerID=HzOxMe3b&scp=84891957738&origin=inward.42. Smailienė D, Kavaliauskienė A, Pacauskienė I. 2013; Posttreatment status of palatally impacted maxillary canines treated applying 2 different surgical-orthodontic methods. Medicina (Kaunas). 49:354–60. DOI: 10.3390/medicina49080055. PMID: 24509145. PMID: https://www.scopus.com/inward/record.uri?partnerID=HzOxMe3b&scp=84897664576&origin=inward.43. Smailiene D, Kavaliauskiene A, Pacauskiene I, Zasciurinskiene E, Bjerklin K. 2013; Palatally impacted maxillary canines: choice of surgical-orthodontic treatment method does not influence post-treatment periodontal status. A controlled prospective study. Eur J Orthod. 35:803–10. DOI: 10.1093/ejo/cjs102. PMID: 23349422. PMID: https://www.scopus.com/inward/record.uri?partnerID=HzOxMe3b&scp=84890477800&origin=inward.44. Zasciurinskiene E, Bjerklin K, Smailiene D, Sidlauskas A, Puisys A. 2008; Initial vertical and horizontal position of palatally impacted maxillary canine and effect on periodontal status following surgical-orthodontic treatment. Angle Orthod. 78:275–80. DOI: 10.2319/010907-8.1. PMID: 18251594. PMID: https://www.scopus.com/inward/record.uri?partnerID=HzOxMe3b&scp=40749133303&origin=inward.45. Worthington HV, MacDonald L, Poklepovic Pericic T, Sambunjak D, Johnson TM, Imai P, et al. 2019; Home use of interdental cleaning devices, in addition to toothbrushing, for preventing and controlling periodontal diseases and dental caries. Cochrane Database Syst Rev. 4:CD012018. DOI: 10.1002/14651858.CD012018.pub2. PMID: 30968949. PMCID: PMC6953268. PMID: https://www.scopus.com/inward/record.uri?partnerID=HzOxMe3b&scp=85064427986&origin=inward.46. Cerroni S, Pasquantonio G, Condò R, Cerroni L. 2018; Orthodontic fixed appliance and periodontal status: an updated systematic review. Open Dent J. 12:614–22. DOI: 10.2174/1745017901814010614. PMID: 30369970. PMCID: PMC6182882. PMID: https://www.scopus.com/inward/record.uri?partnerID=HzOxMe3b&scp=85055743238&origin=inward.47. Vlachodimou E, Fragkioudakis I, Vouros I. 2021; Is there an association between the gingival phenotype and the width of keratinized gingiva? A systematic review. Dent J (Basel). 9:34. DOI: 10.3390/dj9030034. PMID: 33806934. PMCID: PMC8004949. PMID: 116b2d9e3ec846d09bc6a6d4a022041f. PMID: https://www.scopus.com/inward/record.uri?partnerID=HzOxMe3b&scp=85107790527&origin=inward.48. Damasceno YSS, Espinosa DG, Normando D. 2020; Is the extraction of third molars a risk factor for the temporomandibular disorders? A systematic review. Clin Oral Investig. 24:3325–34. DOI: 10.1007/s00784-020-03277-6. PMID: 32776170. PMID: https://www.scopus.com/inward/record.uri?partnerID=HzOxMe3b&scp=85089142235&origin=inward.49. Matarese G, Isola G, Alibrandi A, Lo Gullo A, Bagnato G, Cordasco G, et al. 2016; Occlusal and MRI characterizations in systemic sclerosis patients: a prospective study from Southern Italian cohort. Joint Bone Spine. 83:57–62. DOI: 10.1016/j.jbspin.2015.04.014. PMID: 26552635. PMID: https://www.scopus.com/inward/record.uri?partnerID=HzOxMe3b&scp=84959194802&origin=inward.50. Caprioglio A, Comaglio I, Siani L, Fastuca R. 2019; Effects of impaction severity of treated palatally displaced canines on periodontal outcomes: a retrospective study. Prog Orthod. 20:5. DOI: 10.1186/s40510-018-0256-7. PMID: 30714076. PMCID: PMC6361313. PMID: 703b64983db04a47a6119585152ad8b6. PMID: https://www.scopus.com/inward/record.uri?partnerID=HzOxMe3b&scp=85061067551&origin=inward.
- Full Text Links
- Actions
-
Cited
- CITED
-
- Close
- Share
- Similar articles
-
- An Introduction of the Systematic Review and Meta-Analysis
- Enamel matrix derivative for replanted teeth in animal models: a systematic review and meta-analysis
- Systematic Review and Meta-analysis in Digestive Cancer Research
- Critical Appraisal of Systematic Review/Meta-analysis
- Introduction to systematic review and meta-analysis


