In Vivo and In Vitro Quantification of Glucose Kinetics: From Bedside to Bench
- Affiliations
-
- 1Department of Molecular Medicine, College of Medicine, Gachon University, Incheon, Korea
- 2Korea Mouse Metabolic Phenotyping Center, Lee Gil Ya Cancer and Diabetes Institute, Gachon University, Incheon, Korea
- 3Department of Health Sciences and Technology, Gachon Advanced Institute for Health Sciences & Technology (GAIHST), Gachon University, Incheon, Korea
- 4Department of Physical Education, Yonsei University, Seoul, Korea
- 5Department of Geriatrics, the Center for Translational Research in Aging & Longevity, Donald W. Reynolds Institute on Aging, University of Arkansas for Medical Sciences, Little Rock, AR, USA
- KMID: 2511000
- DOI: http://doi.org/10.3803/EnM.2020.406
Abstract
- Like other substrates, plasma glucose is in a dynamic state of constant turnover (i.e., rates of glucose appearance [Ra glucose] into and disappearance [Rd glucose] from the plasma) while staying within a narrow range of normal concentrations, a physiological priority. Persistent imbalance of glucose turnover leads to elevations (i.e., hyperglycemia, Ra>Rd) or falls (i.e., hypoglycemia, Ra<Rd) in the pool size, leading to clinical conditions such as diabetes. Endogenous Ra glucose is divided into hepatic glucose production via glycogenolysis and gluconeogenesis (GNG) and renal GNG. On the other hand, Rd glucose, the summed rate of glucose uptake by tissues/organs, involves various intracellular metabolic pathways including glycolysis, the tricarboxylic acid (TCA) cycle, and oxidation at varying rates depending on the metabolic status. Despite the dynamic nature of glucose metabolism, metabolic studies typically rely on measurements of static, snapshot information such as the abundance of mRNAs and proteins and (in)activation of implicated signaling networks without determining actual flux rates. In this review, we will discuss the importance of obtaining kinetic information, basic principles of stable isotope tracer methodology, calculations of in vivo glucose kinetics, and assessments of metabolic flux in experimental models in vivo and in vitro.
Figure
-
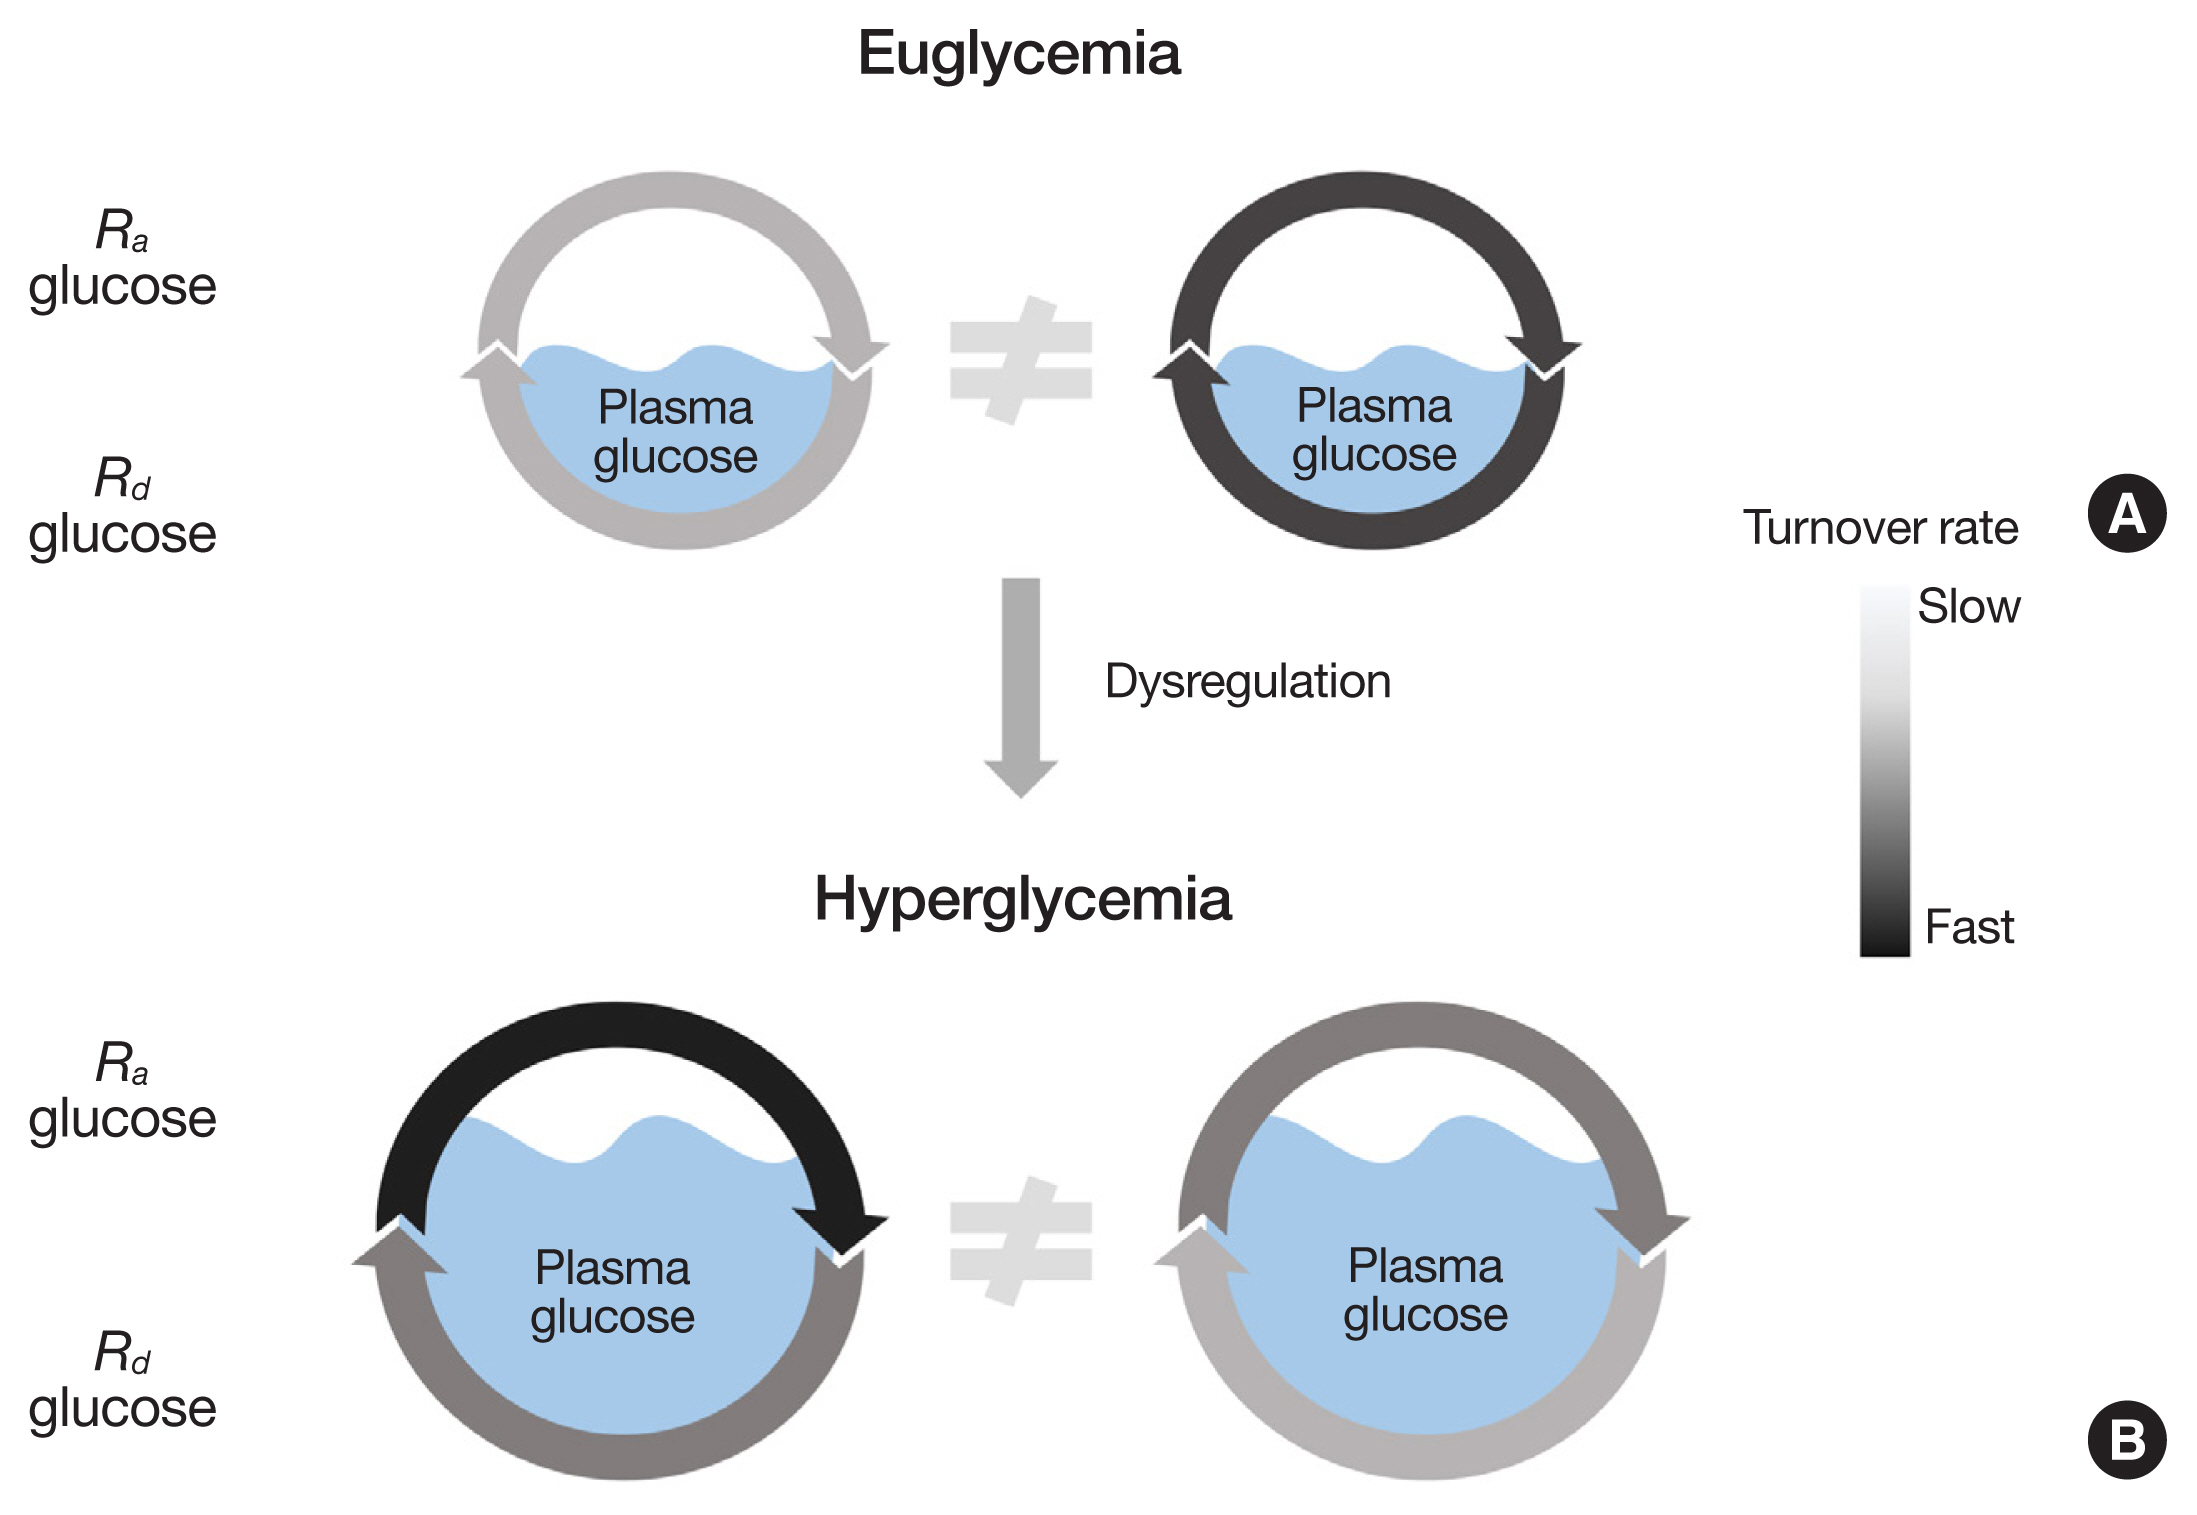
Fig. 1 Static information does not reveal the dynamic nature of glucose metabolism. The plasma glucose pool size is determined by the balance between the rate of glucose appearance (Ra glucose) into and the rate of glucose disappearance (Rd glucose) from the plasma compartment. The glucose pool size, whether normal (i.e., euglycemia, A) or abnormal (e.g., hyperglycemia, B), does not reveal the dynamic status of glucose metabolism (i.e., actual metabolic flux rates).

Fig. 2 Stable isotope tracer and its enrichment. Due to the existence of heavier stable isotopes, natural compounds such as glucose have a number of isotopomers with varying masses (A). Typically, M+0, the lowest mass, is the most abundant isotopomer of tracee with a mass less than 500 MW (e.g., glucose). Glucose heavier than M+0 can be used as a tracer for tracing the fates of the glucose (B) by introducing the tracer into the compartment(s) of a biological system (e.g., blood, tissue, cell, etc.), typically intravenously (C). The magnitude of tracer enrichment (i.e., the relative abundance of tracer that is exogenously introduced into the system to the abundance of the tracee of an identical compound that is endogenously produced) can typically be determined on GC-MS or LC-MS, which is used to calculate metabolic flux. Panels (C, D) were created with BioRender.com. GC-MS, gas chromatography mass spectrometry; LC-MS, liquid chromatography mass spectrometry.

Fig. 3 Basic models of tracer methodology. Calculations of substrate kinetics are predicated on two tracer models: tracer dilution and tracer incorporation models. The tracer dilution model (A) is used to determine Ra tracee (e.g., glucose) into a compartment (e.g., blood) based on the magnitude of the dilution of tracer introduced exogenously by the endogenously produced tracee (A). The tracer incorporation model (B) is used to determine the fractional rate of polymer synthesis based on the rate of incorporation of the tracer precursor into the product (e.g., the synthesis of new glucose from a 3-carbon precursor such as alanine, gluconeogenesis). To obtain the absolute rate of synthesis of the product of interest, the value must be multiplied by the pool size (e.g., muscle protein mass) or total production (e.g., hepatic glucose production in the case of gluconeogenesis calculation). FSR, fractional synthesis rate.
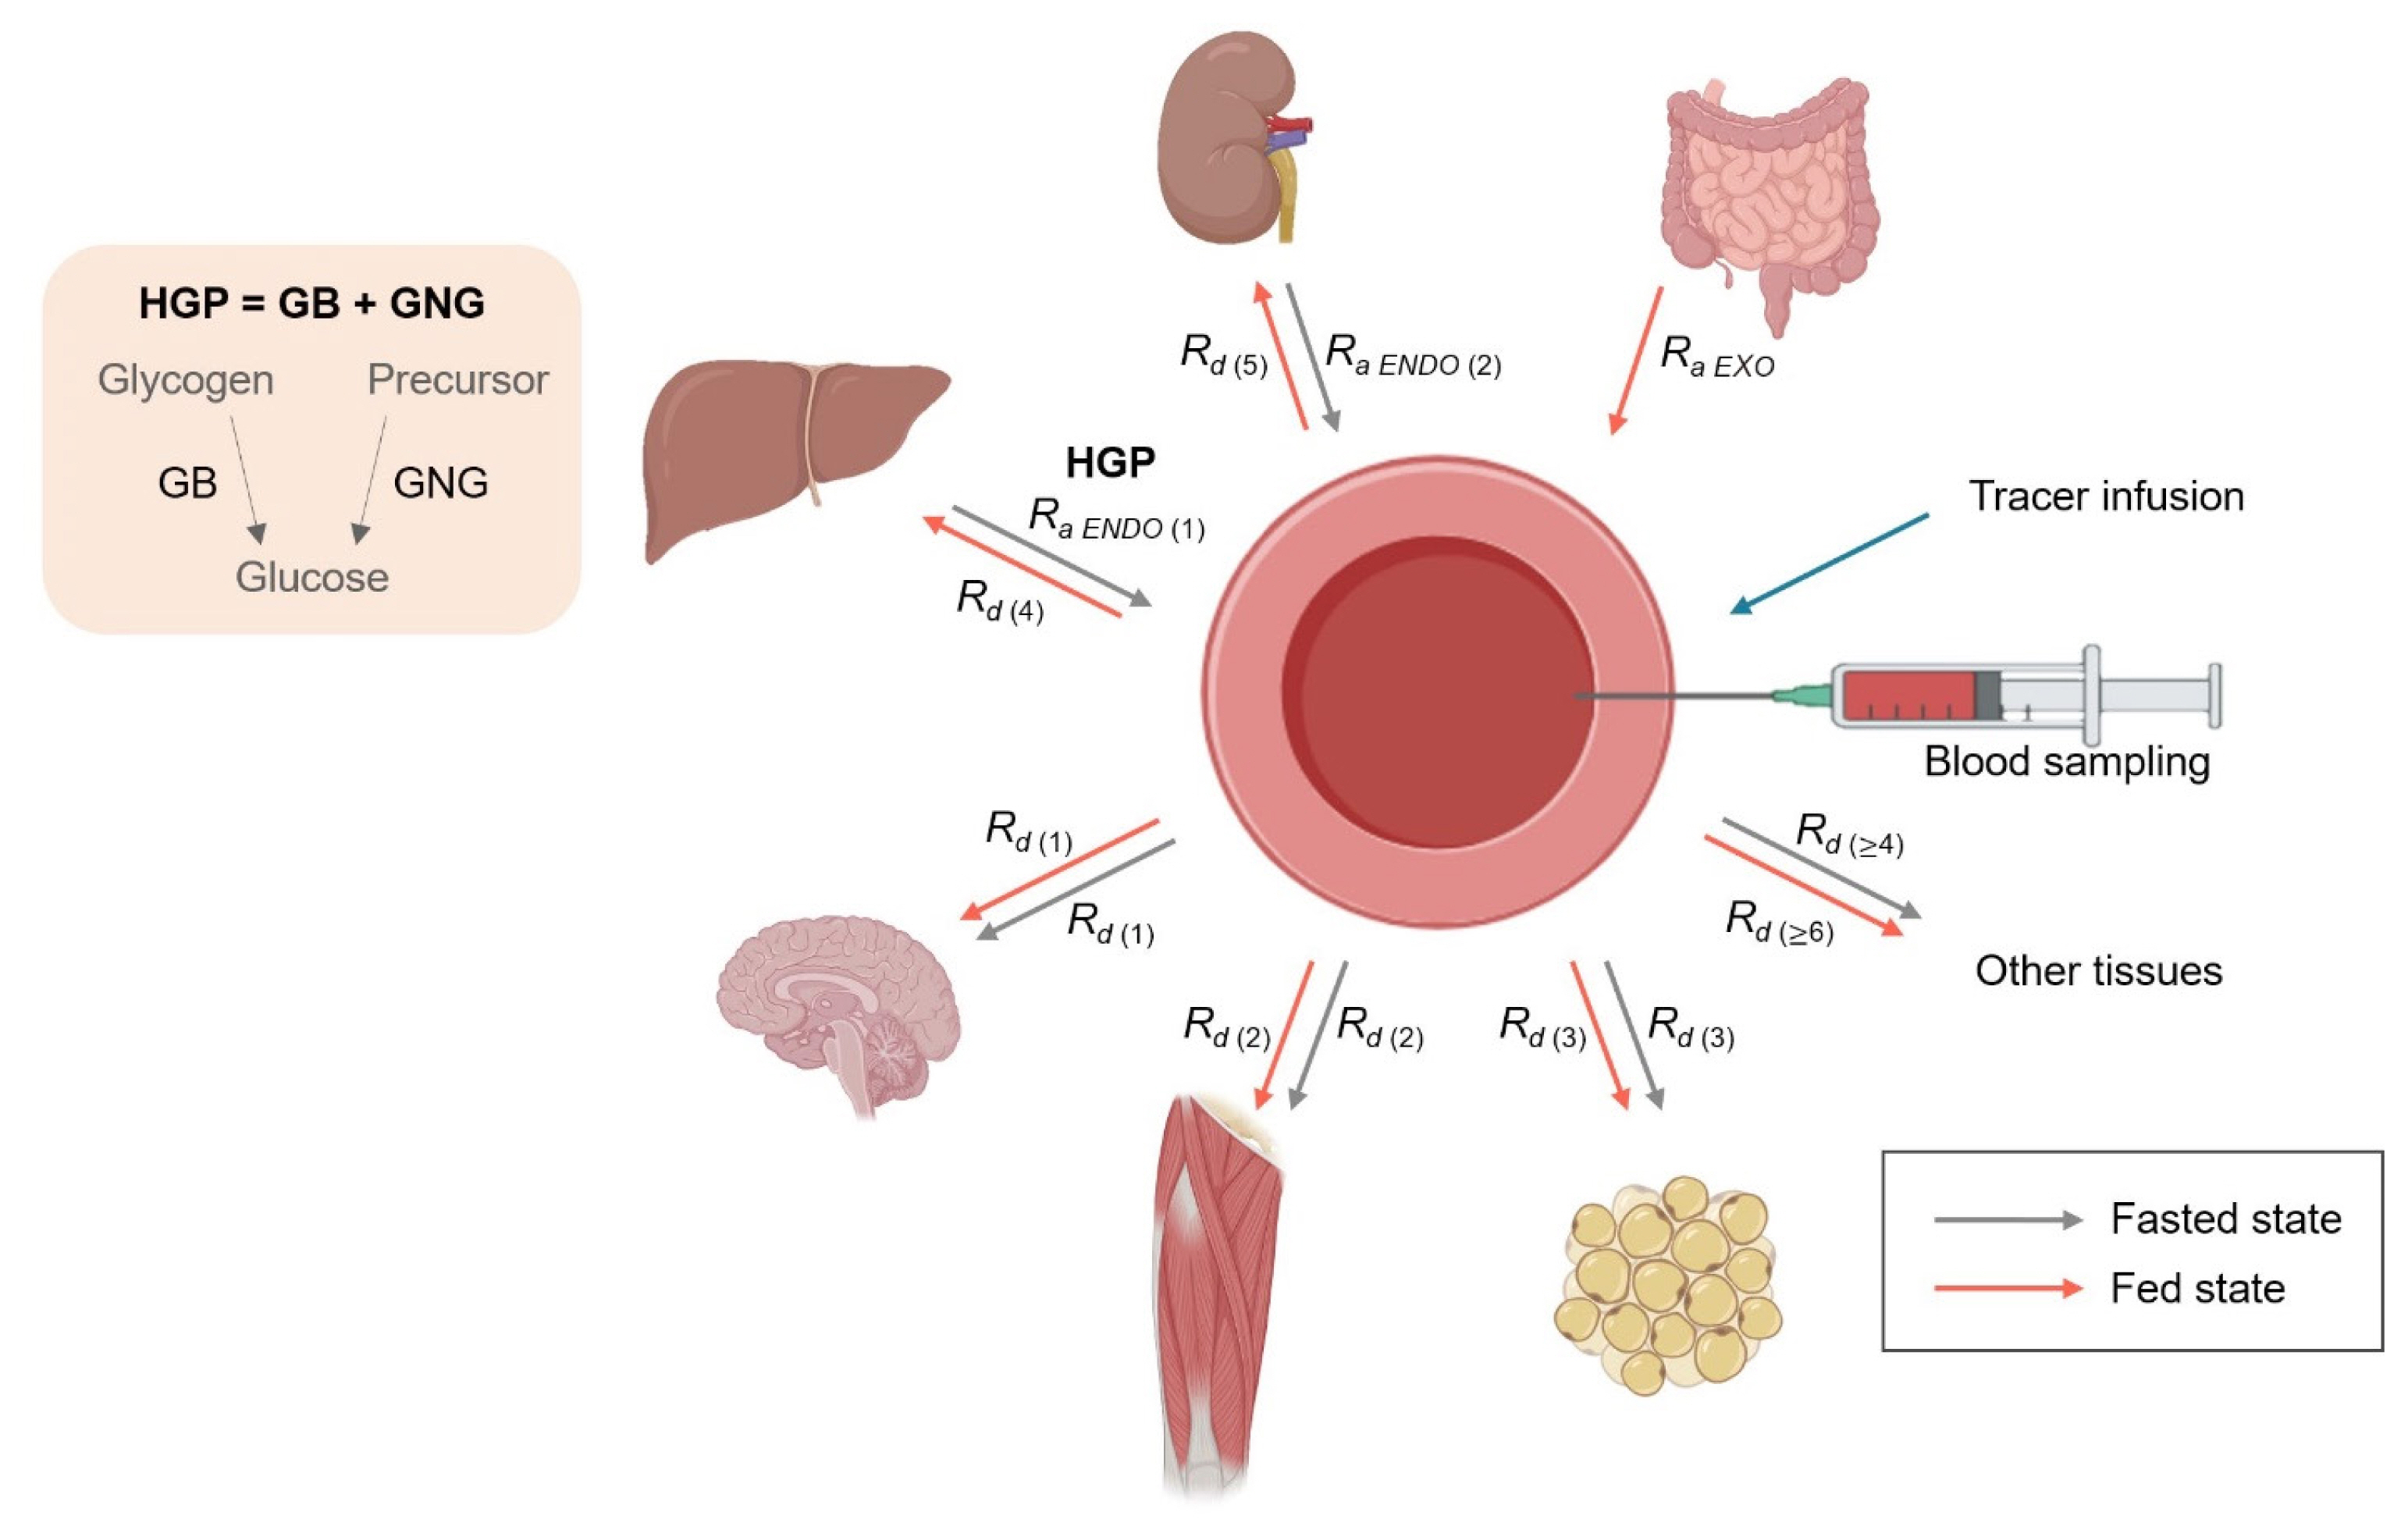
Fig. 4 Overview of systemic glucose metabolism from the kinetic perspective. In the fasted state (gray lines), Ra glucose into the blood from the liver (i.e., hepatic glucose production [HGP]=glycogenolysis [GB] and gluconeogenesis [GNG]) and to a minor extent from the kidneys (renal GNG) reflects endogenous glucose production (EGP). Rd glucose reflects the rate of peripheral glucose uptake, which is the sum of all of Rd glucose into different tissues/organs both in fasted (gray lines) and fed (red lines) states ( ∑ k = 1 n R d ( k )). Unlike the fasted states, Ra glucose in the fed states reflects the rate of exogenously introduced glucose (i.e., Ra EXO, the rate of glucose appearance from the gut after intake of glucose-containing nutrition) in addition to EGP from the liver and kidneys, which become net glucose consumers, during which time skeletal muscle becomes the largest consumer of glucose. The figure was created with BioRender.com

Fig. 5 Principles of “true” precursor enrichment determination using mass isotopomer distribution analysis for estimation of gluconeogenesis (GNG). In the process of GNG, two 3-carbon precursors (labeled and unlabeled) are combined to make a new glucose molecule, and the magnitude of enrichment of the product is determined by the precursor enrichment (p), rate of GNG and the rate of glycogenolysis (GB), latter of which dilutes the product enrichment (A). For a given hepatic glucose production (HGP) and given glucose pool size, “true” precursor enrichment can be back-calculated from the labeling patterns (singly labeled glucose, S vs. doubly labeled glucose, D) of the product (glucose) based on combinatorial probabilities with a binomial expansion, irrespective of the magnitude of GB (B).
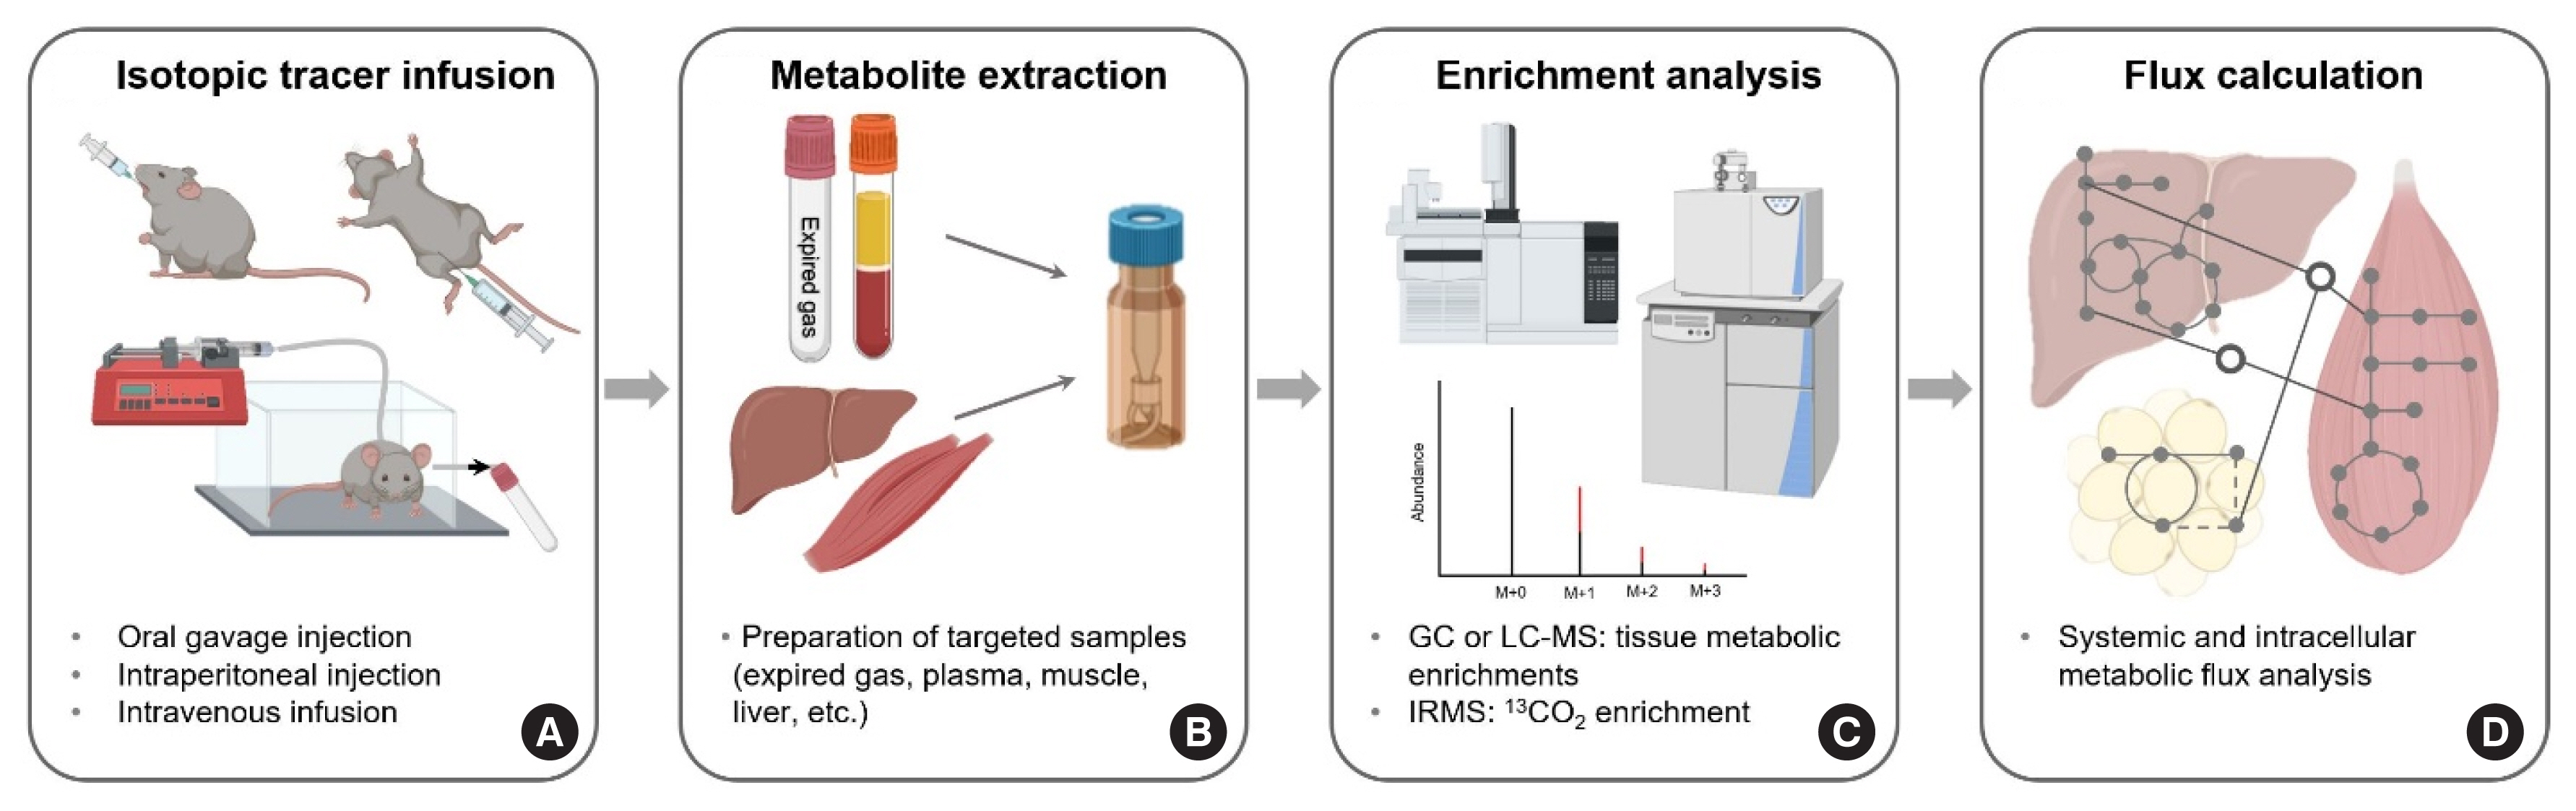
Fig. 6 Overview of the assessment of metabolic flux in a mouse model in vivo. Calculations of metabolic flux rates in vivo in a mouse model is accomplished similarly to the corresponding calculations in humans. Compared to human tracer intravenous (IV) infusion, surgical catheterization for IV infusion via the jugular vein requires an experienced technician in mouse metabolic studies (A). After an appropriate preparation of targeted samples (B), intracellular metabolic rates in addition to the determination of systemic flux rates (such as Ra tracee) can be also explored by examining the patterns of mass isotopomer distribution (MID) of downstream metabolites (C, D). The figure was created with BioRender.com. GC-MS, gas chromatography mass spectrometry; LC-MS, liquid chromatography mass spectrometry; IRMS, isotope ratio mass spectrometry.

Fig. 7 Overview of the assessment of metabolic flux in vitro using metabolic flux analysis (MFA). The intracellular flux rates of specific metabolic pathways (such as glycolysis, the tricarboxylic acid [TCA] cycle, etc.) can be estimated in vitro through the examination of mass isotopomer distribution (MID) patterns of metabolites (on gas chromatography mass spectrometry [GC-MS]) and external flux rates (e.g., rates of glucose uptake and secretion of lactate) following treatment with tracer(s) (e.g., [U-13C6]glucose) (A–F). Differences between the estimated MIDs and measured MIDs are adjusted through iterative repetitions of model reconstruction and statistical validation processes (back and forth between E and B). Panels (C, D) were created with BioRender.com. SSR, sum-of-squared residual
Reference
-
1. Suh SH, Casazza GA, Horning MA, Miller BF, Brooks GA. Effects of oral contraceptives on glucose flux and substrate oxidation rates during rest and exercise. J Appl Physiol (1985). 2003; 94:285–94.2. Suh SH, Casazza GA, Horning MA, Miller BF, Brooks GA. Luteal and follicular glucose fluxes during rest and exercise in 3-h postabsorptive women. J Appl Physiol (1985). 2002; 93:42–50.
Article3. Weber JM, Klein S, Wolfe RR. Role of the glucose cycle in control of net glucose flux in exercising humans. J Appl Physiol (1985). 1990; 68:1815–9.
Article4. Brooks GA. The precious few grams of glucose during exercise. Int J Mol Sci. 2020; 21:5733.
Article5. Wolfe RR, Nadel ER, Shaw JH, Stephenson LA, Wolfe MH. Role of changes in insulin and glucagon in glucose homeostasis in exercise. J Clin Invest. 1986; 77:900–7.
Article6. Romijn JA, Coyle EF, Sidossis LS, Rosenblatt J, Wolfe RR. Substrate metabolism during different exercise intensities in endurance-trained women. J Appl Physiol (1985). 2000; 88:1707–14.
Article7. Romijn JA, Coyle EF, Sidossis LS, Gastaldelli A, Horowitz JF, Endert E, et al. Regulation of endogenous fat and carbohydrate metabolism in relation to exercise intensity and duration. Am J Physiol. 1993; 265(3 Pt 1):E380–91.
Article8. Wardle SL, Macnaughton LS, McGlory C, Witard OC, Dick JR, Whitfield PD, et al. Human skeletal muscle metabolic responses to 6 days of high-fat overfeeding are associated with dietary n-3PUFA content and muscle oxidative capacity. Physiol Rep. 2020; 8:e14529.
Article9. Meyer C, Dostou JM, Welle SL, Gerich JE. Role of human liver, kidney, and skeletal muscle in postprandial glucose homeostasis. Am J Physiol Endocrinol Metab. 2002; 282:E419–27.
Article10. Nathan DM, Davidson MB, DeFronzo RA, Heine RJ, Henry RR, Pratley R, et al. Impaired fasting glucose and impaired glucose tolerance: implications for care. Diabetes Care. 2007; 30:753–9.11. Kim IY, Schutzler SE, Azhar G, Wolfe RR, Ferrando AA, Coker RH. Short term elevation in dietary protein intake does not worsen insulin resistance or lipids in older adults with metabolic syndrome: a randomized-controlled trial. BMC Nutr. 2017; 3:33.
Article12. van Haeften TW, Dubbeldam S, Zonderland ML, Erkelens DW. Insulin secretion in normal glucose-tolerant relatives of type 2 diabetic subjects. Assessments using hyperglycemic glucose clamps and oral glucose tolerance tests. Diabetes Care. 1998; 21:278–82.
Article13. Gumbiner B, Polonsky KS, Beltz WF, Griver K, Wallace P, Brechtel G, et al. Effects of weight loss and reduced hyperglycemia on the kinetics of insulin secretion in obese non-insulin dependent diabetes mellitus. J Clin Endocrinol Metab. 1990; 70:1594–602.
Article14. Rosen ED, Spiegelman BM. Adipocytes as regulators of energy balance and glucose homeostasis. Nature. 2006; 444:847–53.
Article15. Wolfe RR, Chinkes DL. Isotope tracers in metabolic research: principles and practice of kinetic analysis. New York: Wiley-Liss;2005.16. Kim IY, Suh SH, Lee IK, Wolfe RR. Applications of stable, nonradioactive isotope tracers in in vivo human metabolic research. Exp Mol Med. 2016; 48:e203.
Article17. Umpierrez GE, Isaacs SD, Bazargan N, You X, Thaler LM, Kitabchi AE. Hyperglycemia: an independent marker of in-hospital mortality in patients with undiagnosed diabetes. J Clin Endocrinol Metab. 2002; 87:978–82.
Article18. Qiao Q, Pyorala K, Pyorala M, Nissinen A, Lindstrom J, Tilvis R, et al. Two-hour glucose is a better risk predictor for incident coronary heart disease and cardiovascular mortality than fasting glucose. Eur Heart J. 2002; 23:1267–75.
Article19. Reaven GM, Hollenbeck C, Jeng CY, Wu MS, Chen YD. Measurement of plasma glucose, free fatty acid, lactate, and insulin for 24 h in patients with NIDDM. Diabetes. 1988; 37:1020–4.
Article20. Neinast MD, Jang C, Hui S, Murashige DS, Chu Q, Morscher RJ, et al. Quantitative analysis of the whole-body metabolic fate of branched-chain amino acids. Cell Metab. 2019; 29:417–29.
Article21. Perry RJ, Wang Y, Cline GW, Rabin-Court A, Song JD, Dufour S, et al. Leptin mediates a glucose-fatty acid cycle to maintain glucose homeostasis in starvation. Cell. 2018; 172:234–48.
Article22. Robinson MM, Dasari S, Konopka AR, Johnson ML, Manjunatha S, Esponda RR, et al. Enhanced protein translation underlies improved metabolic and physical adaptations to different exercise training modes in young and old humans. Cell Metab. 2017; 25:581–92.
Article23. Bukhari SS, Phillips BE, Wilkinson DJ, Limb MC, Rankin D, Mitchell WK, et al. Intake of low-dose leucine-rich essential amino acids stimulates muscle anabolism equivalently to bolus whey protein in older women at rest and after exercise. Am J Physiol Endocrinol Metab. 2015; 308:E1056–65.
Article24. Greenhaff PL, Karagounis LG, Peirce N, Simpson EJ, Hazell M, Layfield R, et al. Disassociation between the effects of amino acids and insulin on signaling, ubiquitin ligases, and protein turnover in human muscle. Am J Physiol Endocrinol Metab. 2008; 295:E595–604.
Article25. Chubukov V, Uhr M, Le Chat L, Kleijn RJ, Jules M, Link H, et al. Transcriptional regulation is insufficient to explain substrate-induced flux changes in Bacillus subtilis. Mol Syst Biol. 2013; 9:709.
Article26. Kim IY, Park S, Jang J, Wolfe RR. Understanding muscle protein dynamics: technical considerations for advancing sarcopenia research. Ann Geriatr Med Res. 2020; 24:157–65.
Article27. Kim IY, Deutz NEP, Wolfe RR. Update on maximal anabolic response to dietary protein. Clin Nutr. 2018; 37:411–8.
Article28. Kim JK. Hyperinsulinemic-euglycemic clamp to assess insulin sensitivity in vivo. Methods Mol Biol. 2009; 560:221–38.
Article29. Pietzsch J, Julius U, Nitzsche S, Hanefeld M. In vivo evidence for increased apolipoprotein A-I catabolism in subjects with impaired glucose tolerance. Diabetes. 1998; 47:1928–34.
Article30. Hellerstein MK, Neese RA, Linfoot P, Christiansen M, Turner S, Letscher A. Hepatic gluconeogenic fluxes and glycogen turnover during fasting in humans. A stable isotope study. J Clin Invest. 1997; 100:1305–19.
Article31. Kim IY, Schutzler SE, Schrader A, Spencer HJ, Azhar G, Deutz NE, et al. Acute ingestion of citrulline stimulates nitric oxide synthesis but does not increase blood flow in healthy young and older adults with heart failure. Am J Physiol Endocrinol Metab. 2015; 309:E915–24.
Article32. Kim IY, Schutzler S, Schrader AM, Spencer HJ, Azhar G, Wolfe RR, et al. Protein intake distribution pattern does not affect anabolic response, lean body mass, muscle strength or function over 8 weeks in older adults: a randomized-controlled trial. Clin Nutr. 2018; 37:488–93.
Article33. Kim IY, Shin YA, Schutzler SE, Azhar G, Wolfe RR, Ferrando AA. Quality of meal protein determines anabolic response in older adults. Clin Nutr. 2018; 37(6 Pt A):2076–83.
Article34. Berryman CE, Young AJ, Karl JP, Kenefick RW, Margolis LM, Cole RE, et al. Severe negative energy balance during 21 d at high altitude decreases fat-free mass regardless of dietary protein intake: a randomized controlled trial. FASEB J. 2018; 32:894–905.
Article35. Horowitz JF, Mora-Rodriguez R, Byerley LO, Coyle EF. Lipolytic suppression following carbohydrate ingestion limits fat oxidation during exercise. Am J Physiol. 1997; 273:E768–75.
Article36. Coker RH, Shin K, Scholten K, Johannsen M, Tsigonis J, Kim IY, et al. Essential amino acid-enriched meal replacement promotes superior net protein balance in older, overweight adults. Clin Nutr. 2019; 38:2821–6.
Article37. Kim IY, Park S, Smeets ETHC, Schutzler S, Azhar G, Wei JY, et al. Consumption of a specially-formulated mixture of essential amino acids promotes gain in whole-body protein to a greater extent than a complete meal replacement in older women with heart failure. Nutrients. 2019; 11:1360.
Article38. Deja S, Fu X, Fletcher JA, Kucejova B, Browning JD, Young JD, et al. Simultaneous tracers and a unified model of positional and mass isotopomers for quantification of metabolic flux in liver. Metab Eng. 2020; 59:1–14.
Article39. Chaumeil MM, Najac C, Ronen SM. Studies of metabolism using (13)C MRS of hyperpolarized probes. Methods Enzymol. 2015; 561:1–71.
Article40. Cobelli C, Foster D, Toffolo G. Tracer kinetics in biomedical research. Boston: Springer;2002.41. Jang C, Chen L, Rabinowitz JD. Metabolomics and isotope tracing. Cell. 2018; 173:822–37.
Article42. Liu S, Dai Z, Cooper DE, Kirsch DG, Locasale JW. Quantitative analysis of the physiological contributions of glucose to the TCA cycle. Cell Metab. 2020; 32:619–28.
Article43. Kim IY, Park S, Jang J, Wolfe RR. Quantifications of lipid kinetics in vivo using stable isotope tracer methodology. J Lipid Atheroscler. 2020; 9:110–23.
Article44. Park S, Jang J, Choi MD, Shin YA, Schutzler S, Azhar G, et al. The anabolic response to dietary protein is not limited by the maximal stimulation of protein synthesis in healthy older adults: a randomized crossover trial. Nutrients. 2020; 12:E3276.
Article45. Park S, Church DD, Azhar G, Schutzler SE, Ferrando AA, Wolfe RR. Anabolic response to essential amino acid plus whey protein composition is greater than whey protein alone in young healthy adults. J Int Soc Sports Nutr. 2020; 17:9.
Article46. Kim IY, Schutzler S, Schrader A, Spencer HJ, Azhar G, Ferrando AA, et al. The anabolic response to a meal containing different amounts of protein is not limited by the maximal stimulation of protein synthesis in healthy young adults. Am J Physiol Endocrinol Metab. 2016; 310:E73–80.
Article47. Sidossis LS, Stuart CA, Shulman GI, Lopaschuk GD, Wolfe RR. Glucose plus insulin regulate fat oxidation by controlling the rate of fatty acid entry into the mitochondria. J Clin Invest. 1996; 98:2244–50.
Article48. Goodpaster BH, Wolfe RR, Kelley DE. Effects of obesity on substrate utilization during exercise. Obes Res. 2002; 10:575–84.
Article49. Jacobs KA, Casazza GA, Suh SH, Horning MA, Brooks GA. Fatty acid reesterification but not oxidation is increased by oral contraceptive use in women. J Appl Physiol (1985). 2005; 98:1720–31.
Article50. Baba H, Zhang XJ, Wolfe RR. Glycerol gluconeogenesis in fasting humans. Nutrition. 1995; 11:149–53.51. Qi J, Lang W, Geisler JG, Wang P, Petrounia I, Mai S, et al. The use of stable isotope-labeled glycerol and oleic acid to differentiate the hepatic functions of DGAT1 and -2. J Lipid Res. 2012; 53:1106–16.
Article52. Marjanska M, Iltis I, Shestov AA, Deelchand DK, Nelson C, Ugurbil K, et al. In vivo 13C spectroscopy in the rat brain using hyperpolarized [1-(13)C]pyruvate and [2-(13)C]pyruvate. J Magn Reson. 2010; 206:210–8.
Article53. Miller BF, Fattor JA, Jacobs KA, Horning MA, Navazio F, Lindinger MI, et al. Lactate and glucose interactions during rest and exercise in men: effect of exogenous lactate infusion. J Physiol. 2002; 544:963–75.
Article54. Romijn JA, Chinkes DL, Schwarz JM, Wolfe RR. Lactate-pyruvate interconversion in blood: implications for in vivo tracer studies. Am J Physiol. 1994; 266(3 Pt 1):E334–40.
Article55. Henderson GC, Horning MA, Lehman SL, Wolfel EE, Bergman BC, Brooks GA. Pyruvate shuttling during rest and exercise before and after endurance training in men. J Appl Physiol (1985). 2004; 97:317–25.
Article56. Kim IY, Williams RH, Schutzler SE, Lasley CJ, Bodenner DL, Wolfe RR, et al. Acute lysine supplementation does not improve hepatic or peripheral insulin sensitivity in older, overweight individuals. Nutr Metab (Lond). 2014; 11:49.
Article57. Chopra S, Rathore A, Younas H, Pham LV, Gu C, Beselman A, et al. Obstructive sleep apnea dynamically increases nocturnal plasma free fatty acids, glucose, and cortisol during sleep. J Clin Endocrinol Metab. 2017; 102:3172–81.
Article58. Park S, Church DD, Starck C, Schutzler SE, Azhar G, Kim IY, et al. The impact of Hayward green kiwifruit on dietary protein digestion and protein metabolism. Eur J Nutr. 2020. Sep. 24. [Epub]. https://doi.org/10.1007/s00394-020-02363-5.
Article59. Hellerstein MK. New stable isotope-mass spectrometric techniques for measuring fluxes through intact metabolic pathways in mammalian systems: introduction of moving pictures into functional genomics and biochemical phenotyping. Metab Eng. 2004; 6:85–100.
Article60. Martini WZ, Chinkes DL, Wolfe RR. Quantification of DNA synthesis from different pathways in cultured human fibroblasts and myocytes. Metabolism. 2004; 53:128–33.
Article61. Brook MS, Wilkinson DJ, Mitchell WK, Lund JL, Phillips BE, Szewczyk NJ, et al. A novel D2O tracer method to quantify RNA turnover as a biomarker of de novo ribosomal biogenesis, in vitro, in animal models, and in human skeletal muscle. Am J Physiol Endocrinol Metab. 2017; 313:E681–9.62. Zhang XJ, Rodriguez NA, Wang L, Tuvdendorj D, Wu Z, Tan A, et al. Measurement of precursor enrichment for calculating intramuscular triglyceride fractional synthetic rate. J Lipid Res. 2012; 53:119–25.
Article63. Asghar R, Chondronikola M, Dillon EL, Durham WJ, Porter C, Wu Z, et al. Quantification of muscle triglyceride synthesis rate requires an adjustment for total triglyceride content. J Lipid Res. 2018; 59:2018–24.
Article64. Katanik J, McCabe BJ, Brunengraber DZ, Chandramouli V, Nishiyama FJ, Anderson VE, et al. Measuring gluconeogenesis using a low dose of 2H2O: advantage of isotope fractionation during gas chromatography. Am J Physiol Endocrinol Metab. 2003; 284:E1043–8.65. Wang Y, Kwon H, Su X, Wondisford FE. Glycerol not lactate is the major net carbon source for gluconeogenesis in mice during both short and prolonged fasting. Mol Metab. 2020; 31:36–44.
Article66. Sunny NE, Parks EJ, Browning JD, Burgess SC. Excessive hepatic mitochondrial TCA cycle and gluconeogenesis in humans with nonalcoholic fatty liver disease. Cell Metab. 2011; 14:804–10.
Article67. Vatner DF, Majumdar SK, Kumashiro N, Petersen MC, Rahimi Y, Gattu AK, et al. Insulin-independent regulation of hepatic triglyceride synthesis by fatty acids. Proc Natl Acad Sci U S A. 2015; 112:1143–8.
Article68. Gasier HG, Riechman SE, Wiggs MP, Previs SF, Fluckey JD. A comparison of 2H2O and phenylalanine flooding dose to investigate muscle protein synthesis with acute exercise in rats. Am J Physiol Endocrinol Metab. 2009; 297:E252–9.69. Wang SP, Zhou D, Yao Z, Satapati S, Chen Y, Daurio NA, et al. Quantifying rates of glucose production in vivo following an intraperitoneal tracer bolus. Am J Physiol Endocrinol Metab. 2016; 311:E911–21.
Article70. Wojtaszewski JF, Nielsen JN, Richter EA. Invited review: effect of acute exercise on insulin signaling and action in humans. J Appl Physiol (1985). 2002; 93:384–92.
Article71. Burd NA, West DW, Rerecich T, Prior T, Baker SK, Phillips SM. Validation of a single biopsy approach and bolus protein feeding to determine myofibrillar protein synthesis in stable isotope tracer studies in humans. Nutr Metab (Lond). 2011; 8:15.
Article72. Jaleel A, Short KR, Asmann YW, Klaus KA, Morse DM, Ford GC, et al. In vivo measurement of synthesis rate of individual skeletal muscle mitochondrial proteins. Am J Physiol Endocrinol Metab. 2008; 295:E1255–68.
Article73. Miller BF, Wolff CA, Peelor FF 3rd, Shipman PD, Hamilton KL. Modeling the contribution of individual proteins to mixed skeletal muscle protein synthetic rates over increasing periods of label incorporation. J Appl Physiol (1985). 2015; 118:655–61.
Article74. Kim IY, Schutzler S, Schrader A, Spencer H, Kortebein P, Deutz NE, et al. Quantity of dietary protein intake, but not pattern of intake, affects net protein balance primarily through differences in protein synthesis in older adults. Am J Physiol Endocrinol Metab. 2015; 308:E21–8.
Article75. Burd NA, Andrews RJ, West DW, Little JP, Cochran AJ, Hector AJ, et al. Muscle time under tension during resistance exercise stimulates differential muscle protein sub-fractional synthetic responses in men. J Physiol. 2012; 590:351–62.
Article76. Biolo G, Chinkes D, Zhang XJ, Wolfe RR, Harry M. Vars Research Award. A new model to determine in vivo the relationship between amino acid transmembrane transport and protein kinetics in muscle. JPEN J Parenter Enteral Nutr. 1992; 16:305–15.
Article77. Hines KM, Ford GC, Klaus KA, Irving BA, Ford BL, Johnson KL, et al. Application of high-resolution mass spectrometry to measure low abundance isotope enrichment in individual muscle proteins. Anal Bioanal Chem. 2015; 407:4045–52.
Article78. Groennebaek T, Jespersen NR, Jakobsgaard JE, Sieljacks P, Wang J, Rindom E, et al. Skeletal muscle mitochondrial protein synthesis and respiration increase with low-load blood flow restricted as well as high-load resistance training. Front Physiol. 2018; 9:1796.
Article79. Drake JC, Yan Z. Mitophagy in maintaining skeletal muscle mitochondrial proteostasis and metabolic health with ageing. J Physiol. 2017; 595:6391–9.
Article80. Fernandez-Calleja JMS, Bouwman LMS, Swarts HJM, Oosting A, Keijer J, van Schothorst EM. Extended indirect calorimetry with isotopic CO2 sensors for prolonged and continuous quantification of exogenous vs. total substrate oxidation in mice. Sci Rep. 2019; 9:11507.
Article81. Coyle EF, Jeukendrup AE, Oseto MC, Hodgkinson BJ, Zderic TW. Low-fat diet alters intramuscular substrates and reduces lipolysis and fat oxidation during exercise. Am J Physiol Endocrinol Metab. 2001; 280:E391–8.
Article82. Romijn JA, Coyle EF, Hibbert J, Wolfe RR. Comparison of indirect calorimetry and a new breath 13C/12C ratio method during strenuous exercise. Am J Physiol. 1992; 263(1 Pt 1):E64–71.
Article83. Luiking YC, Poeze M, Deutz NE. Arginine infusion in patients with septic shock increases nitric oxide production without haemodynamic instability. Clin Sci (Lond). 2015; 128:57–67.
Article84. Castillo L, Beaumier L, Ajami AM, Young VR. Whole body nitric oxide synthesis in healthy men determined from [15N] arginine-to-[15N]citrulline labeling. Proc Natl Acad Sci U S A. 1996; 93:11460–5.
Article85. Lau T, Owen W, Yu YM, Noviski N, Lyons J, Zurakowski D, et al. Arginine, citrulline, and nitric oxide metabolism in end-stage renal disease patients. J Clin Invest. 2000; 105:1217–25.
Article86. Marini JC. Arginine and ornithine are the main precursors for citrulline synthesis in mice. J Nutr. 2012; 142:572–80.
Article87. Chung ST, Chacko SK, Sunehag AL, Haymond MW. Measurements of gluconeogenesis and glycogenolysis: a methodological review. Diabetes. 2015; 64:3996–4010.
Article88. Ekberg K, Landau BR, Wajngot A, Chandramouli V, Efendic S, Brunengraber H, et al. Contributions by kidney and liver to glucose production in the postabsorptive state and after 60 h of fasting. Diabetes. 1999; 48:292–8.
Article89. Tigas S, Sunehag A, Haymond MW. Metabolic adaptation to feeding and fasting during lactation in humans. J Clin Endocrinol Metab. 2002; 87:302–7.
Article90. Kaplan W, Sunehag AL, Dao H, Haymond MW. Short-term effects of recombinant human growth hormone and feeding on gluconeogenesis in humans. Metabolism. 2008; 57:725–32.
Article91. Sun RC, Fan TW, Deng P, Higashi RM, Lane AN, Le AT, et al. Noninvasive liquid diet delivery of stable isotopes into mouse models for deep metabolic network tracing. Nat Commun. 2017; 8:1646.
Article92. Lee WN, Boros LG, Puigjaner J, Bassilian S, Lim S, Cascante M. Mass isotopomer study of the nonoxidative pathways of the pentose cycle with [1,2–13C2]glucose. Am J Physiol. 1998; 274:E843–51.93. Brooks GA, Wolfel EE, Groves BM, Bender PR, Butterfield GE, Cymerman A, et al. Muscle accounts for glucose disposal but not blood lactate appearance during exercise after acclimatization to 4,300m. J Appl Physiol (1985). 1992; 72:2435–45.94. Song JD, Alves TC, Befroy DE, Perry RJ, Mason GF, Zhang XM, et al. Dissociation of muscle insulin resistance from alterations in mitochondrial substrate preference. Cell Metab. 2020; 32:726–35.
Article95. Wolfe RR. The underappreciated role of muscle in health and disease. Am J Clin Nutr. 2006; 84:475–82.
Article96. Hellerstein MK, Neese RA. Mass isotopomer distribution analysis: a technique for measuring biosynthesis and turnover of polymers. Am J Physiol. 1992; 263(5 Pt 1):E988–1001.
Article97. Waterlow JC, Garlick PJ, Millward DJ. Protein turnover in mammalian tissues and in the whole body. Amsterdam: North-Holland Pub. Co;1978.98. Ackermans MT, Pereira Arias AM, Bisschop PH, Endert E, Sauerwein HP, Romijn JA. The quantification of gluconeogenesis in healthy men by (2)H2O and [2-(13)C]glycerol yields different results: rates of gluconeogenesis in healthy men measured with (2)H2O are higher than those measured with [2-(13)C]glycerol. J Clin Endocrinol Metab. 2001; 86:2220–6.
Article99. Mazzeo RS, Brooks GA, Schoeller DA, Budinger TF. Disposal of blood [1–13C]lactate in humans during rest and exercise. J Appl Physiol (1985). 1986; 60:232–41.
Article100. Hasenour CM, Rahim M, Young JD. In vivo estimates of liver metabolic flux assessed by 13c-propionate and 13c-lactate are impacted by tracer recycling and equilibrium assumptions. Cell Rep. 2020; 32:107986.
Article101. Perry RJ, Peng L, Cline GW, Butrico GM, Wang Y, Zhang XM, et al. Non-invasive assessment of hepatic mitochondrial metabolism by positional isotopomer NMR tracer analysis (PINTA). Nat Commun. 2017; 8:798.
Article102. Previs SF, Brunengraber H. Methods for measuring gluconeogenesis in vivo. Curr Opin Clin Nutr Metab Care. 1998; 1:461–5.
Article103. Hellerstein MK, Neese RA. Mass isotopomer distribution analysis at eight years: theoretical, analytic, and experimental considerations. Am J Physiol. 1999; 276:E1146–70.
Article104. Lee WN, Bassilian S, Ajie HO, Schoeller DA, Edmond J, Bergner EA, et al. In vivo measurement of fatty acids and cholesterol synthesis using D2O and mass isotopomer analysis. Am J Physiol. 1994; 266(5 Pt 1):E699–708.
Article105. Shankaran M, King CL, Angel TE, Holmes WE, Li KW, Colangelo M, et al. Circulating protein synthesis rates reveal skeletal muscle proteome dynamics. J Clin Invest. 2016; 126:288–302.
Article106. Toffolo G, Basu R, Dalla Man C, Rizza R, Cobelli C. Assessment of postprandial glucose metabolism: conventional dual- vs. triple-tracer method. Am J Physiol Endocrinol Metab. 2006; 291:E800–6.
Article107. Steele R. Influences of glucose loading and of injected insulin on hepatic glucose output. Ann N Y Acad Sci. 1959; 82:420–30.
Article108. Jeukendrup AE, Raben A, Gijsen A, Stegen JH, Brouns F, Saris WH, et al. Glucose kinetics during prolonged exercise in highly trained human subjects: effect of glucose ingestion. J Physiol. 1999; 515(Pt 2):579–89.
Article109. Coggan AR, Kohrt WM, Spina RJ, Bier DM, Holloszy JO. Endurance training decreases plasma glucose turnover and oxidation during moderate-intensity exercise in men. J Appl Physiol (1985). 1990; 68:990–6.
Article110. Romijn JA, Klein S, Coyle EF, Sidossis LS, Wolfe RR. Strenuous endurance training increases lipolysis and triglyceride-fatty acid cycling at rest. J Appl Physiol (1985). 1993; 75:108–13.
Article111. Klein S, Weber JM, Coyle EF, Wolfe RR. Effect of endurance training on glycerol kinetics during strenuous exercise in humans. Metabolism. 1996; 45:357–61.
Article112. Messonnier LA, Emhoff CA, Fattor JA, Horning MA, Carlson TJ, Brooks GA. Lactate kinetics at the lactate threshold in trained and untrained men. J Appl Physiol (1985). 2013; 114:1593–602.
Article113. Kouw IW, Cermak NM, Burd NA, Churchward-Venne TA, Senden JM, Gijsen AP, et al. Sodium nitrate co-ingestion with protein does not augment postprandial muscle protein synthesis rates in older, type 2 diabetes patients. Am J Physiol Endocrinol Metab. 2016; 311:E325–34.
Article114. MacDonald AJ, Johns N, Stephens N, Greig C, Ross JA, Small AC, et al. Habitual myofibrillar protein synthesis is normal in patients with upper GI cancer cachexia. Clin Cancer Res. 2015; 21:1734–40.
Article115. Fabbrini E, Magkos F, Conte C, Mittendorfer B, Patterson BW, Okunade AL, et al. Validation of a novel index to assess insulin resistance of adipose tissue lipolytic activity in obese subjects. J Lipid Res. 2012; 53:321–4.
Article116. Schricker T, Lattermann R, Fiset P, Wykes L, Carli F. Integrated analysis of protein and glucose metabolism during surgery: effects of anesthesia. J Appl Physiol (1985). 2001; 91:2523–30.
Article117. Kowalski GM, De Souza DP, Burch ML, Hamley S, Kloehn J, Selathurai A, et al. Application of dynamic metabolomics to examine in vivo skeletal muscle glucose metabolism in the chronically high-fat fed mouse. Biochem Biophys Res Commun. 2015; 462:27–32.
Article118. Hui S, Ghergurovich JM, Morscher RJ, Jang C, Teng X, Lu W, et al. Glucose feeds the TCA cycle via circulating lactate. Nature. 2017; 551:115–8.
Article119. Bowe JE, Franklin ZJ, Hauge-Evans AC, King AJ, Persaud SJ, Jones PM. Metabolic phenotyping guidelines: assessing glucose homeostasis in rodent models. J Endocrinol. 2014; 222:G13–25.
Article120. Young JD. (13)C metabolic flux analysis of recombinant expression hosts. Curr Opin Biotechnol. 2014; 30:238–45.
Article121. Buescher JM, Antoniewicz MR, Boros LG, Burgess SC, Brunengraber H, Clish CB, et al. A roadmap for interpreting (13)C metabolite labeling patterns from cells. Curr Opin Biotechnol. 2015; 34:189–201.122. Antoniewicz MR. 13C metabolic flux analysis: optimal design of isotopic labeling experiments. Curr Opin Biotechnol. 2013; 24:1116–21.
Article123. Antoniewicz MR, Kelleher JK, Stephanopoulos G. Determination of confidence intervals of metabolic fluxes estimated from stable isotope measurements. Metab Eng. 2006; 8:324–37.
Article
- Full Text Links
-
- Actions
-
Cited
- CITED
-
- Close
- Share
-
- Similar articles
-
- Permeation Pharmacokinetics of Hyperosmolar Glucose Through Stratum Corneum
- Alternating Acquisition Technique for Quantification of in vitro Hyperpolarized [1-13C] Pyruvate Metabolism
- Role of Intestinal Microbiota in Metabolism of Voglibose In Vitro and In Vivo
- Influence of the Culture Media and the Organic Matter in the Growth of Paxillus ammoniavirescens (Contu & Dessi)
- Quantifications of Lipid Kinetics In Vivo Using Stable Isotope Tracer Methodology
