Individual-Level Lesion-Network Mapping to Visualize the Effects of a Stroke Lesion on the Brain Network: Connectograms in Stroke Syndromes
- Affiliations
-
- 1Department of Neurology, Hallym University Sacred Heart Hospital, Hallym Neurological Institute, Hallym University College of Medicine, Anyang, Korea. jaesunglim@hallym.ac.kr
- 2Department of Biomedical Engineering, Sungkyunkwan University, Suwon, Korea.
- 3Center for Neuroscience Imaging Research, Institute for Basic Science, Suwon, Korea.
- KMID: 2467793
- DOI: http://doi.org/10.3988/jcn.2020.16.1.116
Abstract
- BACKGROUND AND PURPOSE
Similar-sized stroke lesions at similar locations can have different prognoses in clinical practice. Lesion-network mapping elucidates network-level effects of lesions that cause specific neurologic symptoms and signs, and also provides a group-level understanding. This study visualized the effects of stroke lesions on the functional brain networks of individual patients.
METHODS
We enrolled patients with ischemic stroke who were hospitalized within 1 week of the stroke occurrence. Resting-state functional magnetic resonance imaging was performed 3 months after the index stroke. For image preprocessing, acute stroke lesions were visually delineated based on diffusion-weighted images obtained at admission, and the lesion mask was drawn using MRIcron software. Correlation matrices were calculated from 280 brain regions using the Brainnetome Atlas, and connectograms were visualized using in-house MATLAB code.
RESULTS
We found characteristic differences in connectograms between pairs of patients who had comparable splenial, frontal cortical, cerebellar, and thalamocapsular lesions. Two representative patients with bilateral thalamic infarctions showed significant differences in their reconstructed connectograms. The cognitive function had recovered well at 3 months after stroke occurrence in patients with well-maintained interhemispheric and intrahemispheric connectivities.
CONCLUSIONS
This pilot study has visualized the effects of stroke lesions on the functional brain networks of individual patients. Consideration of the neurobiologic mechanisms underlying the differences between their connectograms has yielded new hypotheses about differences in the effects of stroke lesions.
MeSH Terms
Figure
-
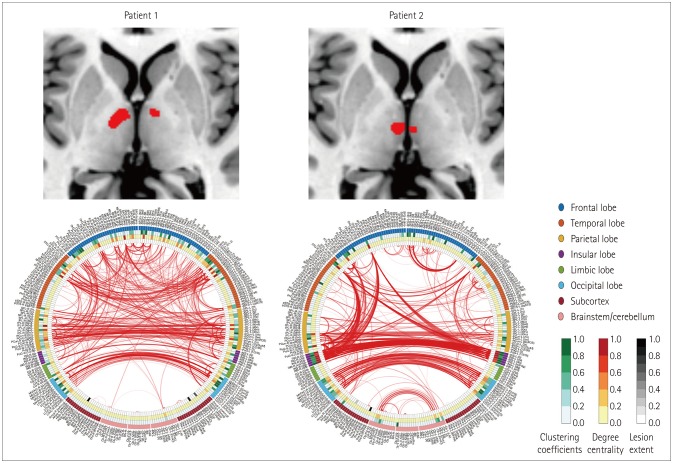
Fig. 1 Representative functional connectivity patterns from patients 1 and 2. The left and right sides of each circle represent the left and right brain hemispheres, respectively. The parcellated cortical area is defined outside the circle. Lesions are shown in black on the innermost circle. Representative network attributes are shown at each point on the circle, and the connectivity of each part is visualized by a line inside the circle. The presence or absence of a line indicates the presence or absence of suprathreshold functional connections, and the thickness of the line indicates the strength of the connection. To reduce noise and find meaningful connections, the global threshold density was set to the highest 1% of values of the network density.
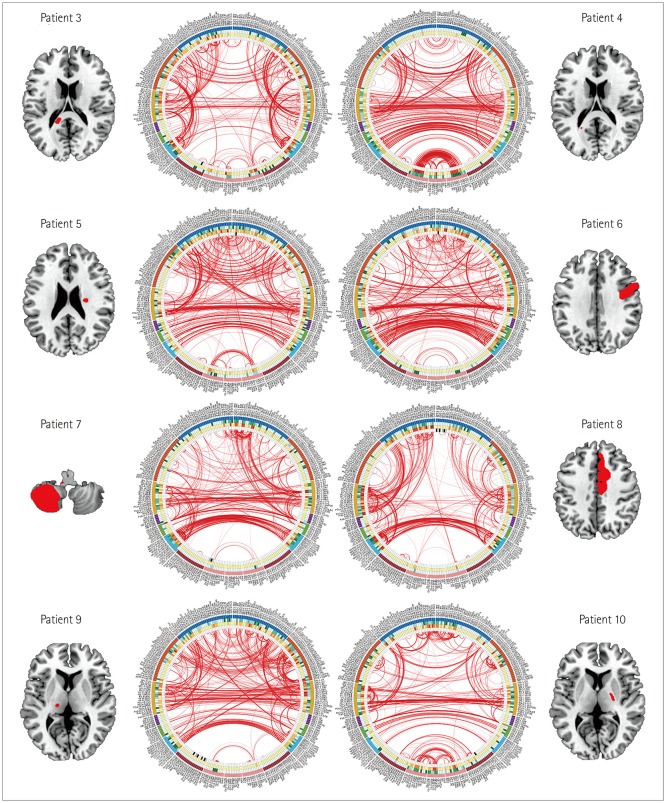
Fig. 2 Comparison of the connectograms of representative patients. Index-stroke lesions are shown in red on the standard template.
Reference
-
1. Wernicke C. The symptom-complex of aphasia. In : Church A, editor. Disease of the nervous system. New York: Appleton;1908. p. 265–324.2. Sporns O, Tononi G, Kötter R. The human connectome: a structural description of the human brain. PLoS Comput Biol. 2005; 1:e42. PMID: 16201007.
Article3. Fox MD. Mapping symptoms to brain networks with the human connectome. N Engl J Med. 2018; 379:2237–2245. PMID: 30575457.
Article4. Boes AD, Prasad S, Liu H, Liu Q, Pascual-Leone A, Caviness VS Jr, et al. Network localization of neurological symptoms from focal brain lesions. Brain. 2015; 138:3061–3075. PMID: 26264514.
Article5. Margulies DS, Böttger J, Watanabe A, Gorgolewski KJ. Visualizing the human connectome. Neuroimage. 2013; 80:445–461. PMID: 23660027.
Article6. Rorden C, Brett M. Stereotaxic display of brain lesions. Behav Neurol. 2000; 12:191–200. PMID: 11568431.
Article7. Ashburner J, Friston KJ. Unified segmentation. Neuroimage. 2005; 26:839–851. PMID: 15955494.
Article8. Friston KJ, Williams S, Howard R, Frackowiak RS, Turner R. Movement-related effects in fMRI time-series. Magn Reson Med. 1996; 35:346–355. PMID: 8699946.
Article9. Muschelli J, Nebel MB, Caffo BS, Barber AD, Pekar JJ, Mostofsky SH. Reduction of motion-related artifacts in resting state fMRI using aCompCor. Neuroimage. 2014; 96:22–35. PMID: 24657780.
Article10. Diedrichsen J, Maderwald S, Küper M, Thürling M, Rabe K, Gizewski ER, et al. Imaging the deep cerebellar nuclei: a probabilistic atlas and normalization procedure. Neuroimage. 2011; 54:1786–1794. PMID: 20965257.
Article11. Fan L, Li H, Zhuo J, Zhang Y, Wang J, Chen L, et al. The human brainnetome atlas: a new brain atlas based on connectional architecture. Cereb Cortex. 2016; 26:3508–3526. PMID: 27230218.
Article12. Rubinov M, Sporns O. Complex network measures of brain connectivity: uses and interpretations. Neuroimage. 2010; 52:1059–1069. PMID: 19819337.
Article13. Kim BJ, Park JM, Kang K, Lee SJ, Ko Y, Kim JG, et al. Case characteristics, hyperacute treatment, and outcome information from the clinical research center for stroke-fifth division registry in South Korea. J Stroke. 2015; 17:38–53. PMID: 25692106.
Article14. Lim JS, Noh M, Kim BJ, Han MK, Kim S, Jang MS, et al. A methodological perspective on the longitudinal cognitive change after stroke. Dement Geriatr Cogn Disord. 2017; 44:311–319. PMID: 29393166.
Article15. Scheltens P, Barkhof F, Leys D, Pruvo JP, Nauta JJ, Vermersch P, et al. A semiquantative rating scale for the assessment of signal hyperintensities on magnetic resonance imaging. J Neurol Sci. 1993; 114:7–12. PMID: 8433101.
Article16. Scheltens P, Leys D, Barkhof F, Huglo D, Weinstein HC, Vermersch P, et al. Atrophy of medial temporal lobes on MRI in “probable” Alzheimer's disease and normal ageing: diagnostic value and neuropsychological correlates. J Neurol Neurosurg Psychiatry. 1992; 55:967–972. PMID: 1431963.
Article17. Duering M, Righart R, Csanadi E, Jouvent E, Hervé D, Chabriat H, et al. Incident subcortical infarcts induce focal thinning in connected cortical regions. Neurology. 2012; 79:2025–2028. PMID: 23054230.
Article18. Lambert C, Simon H, Colman J, Barrick TR. Defining thalamic nuclei and topographic connectivity gradients in vivo. Neuroimage. 2017; 158:466–479. PMID: 27639355.
Article19. Reijmer YD, Freeze WM, Leemans A, Biessels GJ. Utrecht Vascular Cognitive Impairment Study Group. The effect of lacunar infarcts on white matter tract integrity. Stroke. 2013; 44:2019–2021. PMID: 23686971.
Article20. Heinen R, Vlegels N, De Bresser J, Leemans A, Biessels GJ, Reijmer YD. Utrecht Vascular Cognitive Impairment study group. The cumulative effect of small vessel disease lesions is reflected in structural brain networks of memory clinic patients. Neuroimage Clin. 2018; 19:963–969. PMID: 30003033.
Article21. Perry A, Wen W, Kochan NA, Thalamuthu A, Sachdev PS, Breakspear M. The independent influences of age and education on functional brain networks and cognition in healthy older adults. Hum Brain Mapp. 2017; 38:5094–5114. PMID: 28685910.
Article22. Ryu WS, Woo SH, Schellingerhout D, Jang MU, Park KJ, Hong KS, et al. Stroke outcomes are worse with larger leukoaraiosis volumes. Brain. 2017; 140:158–170. PMID: 28008000.
Article23. Ingalhalikar M, Smith A, Parker D, Satterthwaite TD, Elliott MA, Ruparel K, et al. Sex differences in the structural connectome of the human brain. Proc Natl Acad Sci U S A. 2014; 111:823–828. PMID: 24297904.
Article24. Crofts JJ, Higham DJ, Bosnell R, Jbabdi S, Matthews PM, Behrens TE, et al. Network analysis detects changes in the contralesional hemisphere following stroke. Neuroimage. 2011; 54:161–169. PMID: 20728543.
Article25. Carrera E, Tononi G. Diaschisis: past, present, future. Brain. 2014; 137:2408–2422. PMID: 24871646.
Article27. Gallen CL, D'Esposito M. Brain modularity: a biomarker of intervention-related plasticity. Trends Cogn Sci. 2019; 23:293–304. PMID: 30827796.
Article28. Grefkes C, Eickhoff SB, Nowak DA, Dafotakis M, Fink GR. Dynamic intra- and interhemispheric interactions during unilateral and bilateral hand movements assessed with fMRI and DCM. Neuroimage. 2008; 41:1382–1394. PMID: 18486490.
Article
- Full Text Links
-
- Actions
-
Cited
- CITED
-
- Close
- Share
-
- Similar articles
-
- Post-Stroke Cognitive Impairment: Pathophysiological Insights into Brain Disconnectome from Advanced Neuroimaging Analysis Techniques
- Prognosis and Recovery of Motor Function with Lesion–Symptom Mapping in Patients with Stroke
- Neuroanatomical Predictors of Dysphagia after Stroke: Voxel-Based Lesion Symptom Mapping Study
- Neuroanatomical Localization of Rapid Eye Movement Sleep Behavior Disorder in Human Brain Using Lesion Network Mapping
- Neural Substrates of Aphasia in Acute Left Hemispheric Stroke Using VoxelBased Lesion-symptom Brain Mapping
