Comparison of T1rho and T2 Mapping of Knee Articular Cartilage in an Asymptomatic Population
- Affiliations
-
- 1Department of Radiology, Korea University Guro Hospital, Korea University College of Medicine, Seoul 08308, Korea. hongsj@korea.ac.kr
- 2Department of Radiology, Korea University Anam Hospital, Korea University College of Medicine, Seoul 02841, Korea.
- 3Department of Radiology, Korea University Ansan Hospital, Korea University College of Medicine, Ansan 15355, Korea.
- 4Siemens Healthcare, Seoul 03737, Korea.
- KMID: 2466288
- DOI: http://doi.org/10.3348/kjr.2016.17.6.912
Abstract
OBJECTIVE
To analyze subregional differences in T1rho (T1Ï) and T2 values and their correlation in asymptomatic knee cartilage, and to evaluate angular dependence with magic angles.
MATERIALS AND METHODS
Six asymptomatic volunteers underwent knee MRI with T1Ï and T2 mapping. T1Ï and T2 values were measured by two radiologists independently, at nine subregions in the medial femoral condyle (MFC) cartilage, at angles of ± 0°, 15°, 35°, 55°, 75° respective to a vertical line (B0) bisecting the width of the distal femur, and at two locations in the patella. Subregional values of T1Ï and T2 were analyzed and significant differences in three divided portions of the MFC (anterior, central, and posterior) were statistically evaluated. Correlation between T1Ï and T2 and angular dependence with magic angles were also assessed for statistical significance.
RESULTS
T1Ï values were lowest at +15° and highest at -55°. T2 values were lowest at +75° and highest at +35°. Both T1Ï and T2 were higher in superior patella than inferior patella. T1Ï showed significant differences in the three divided portions of the MFC, while T2 showed significant differences only between central and posterior portions. There was a weak correlation between T1Ï and T2 (r = 0.217, p = 0.127). T1Ï showed more angular dependence than T2.
CONCLUSION
T1Ï and T2 showed different subregional values and angular dependence in asymptomatic knee cartilage with a weak correlation. Awareness of these differences will aid in assessment of cartilage in a specific subregion of the knee.
Keyword
MeSH Terms
Figure
-
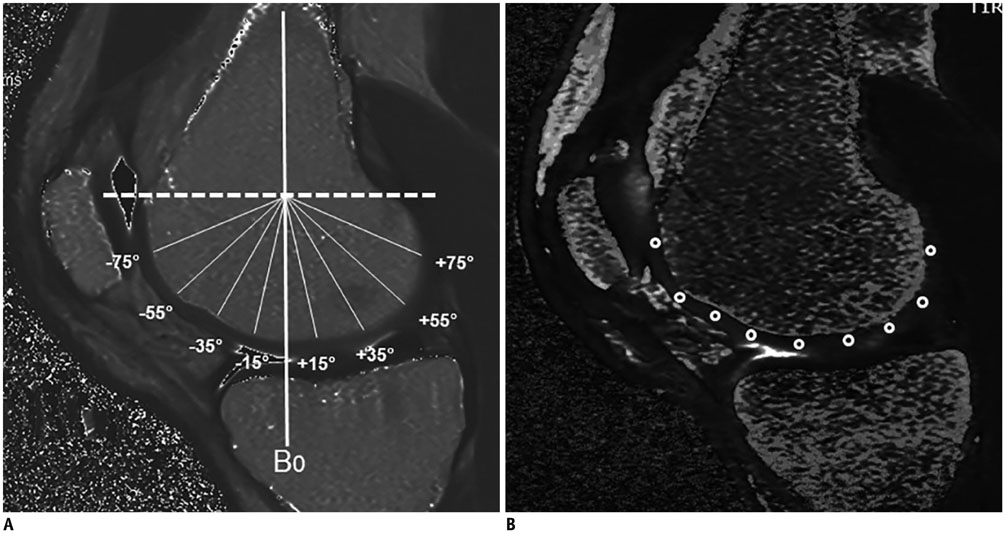
Fig. 1 T2 (A) and T1ρ (B) maps with ROIs in nine subregions in MFC. Dashed white line indicates horizontal line crossing posterior margin of MFC cartilage. ROIs were drawn at angles of ± 0°, 15°, 35°, 55°, 75° degrees respective to vertical line (B0) bisecting width of distal femur, which was perpendicular to dashed white line. MFC = medial femoral condyle, ROIs = regions of interest, T1ρ = T1rho
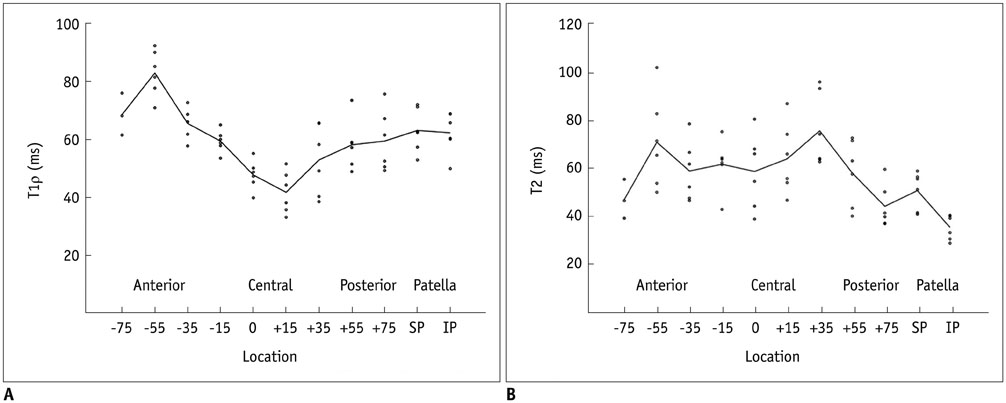
Fig. 2 Line graphs of mean value overlaid on scatter plots of T1ρ (A) and T2 (B) values (ms) at each angle (degrees) of medial femoral condyle and patella. IP = inferior patella, SP = superior patella, T1ρ = T1rho
Cited by 1 articles
-
Clinical Feasibility of Synthetic Magnetic Resonance Imaging in the Diagnosis of Internal Derangements of the Knee
Jisook Yi, Young Han Lee, Ho-Taek Song, Jin-Suck Suh
Korean J Radiol. 2018;19(2):311-319. doi: 10.3348/kjr.2018.19.2.311.
Reference
-
1. Felson DT, Lawrence RC, Dieppe PA, Hirsch R, Helmick CG, Jordan JM, et al. Osteoarthritis: new insights. Part 1: the disease and its risk factors. Ann Intern Med. 2000; 133:635–646.2. Nüesch E, Dieppe P, Reichenbach S, Williams S, Iff S, Jüni P. All cause and disease specific mortality in patients with knee or hip osteoarthritis: population based cohort study. BMJ. 2011; 342:d1165.3. Li X, Pai A, Blumenkrantz G, Carballido-Gamio J, Link T, Ma B, et al. Spatial distribution and relationship of T1rho and T2 relaxation times in knee cartilage with osteoarthritis. Magn Reson Med. 2009; 61:1310–1318.4. Regatte RR, Akella SV, Lonner JH, Kneeland JB, Reddy R. T1rho relaxation mapping in human osteoarthritis (OA) cartilage: comparison of T1rho with T2. J Magn Reson Imaging. 2006; 23:547–553.5. Li X, Benjamin Ma C, Link TM, Castillo DD, Blumenkrantz G, Lozano J, et al. In vivo T(1rho) and T(2) mapping of articular cartilage in osteoarthritis of the knee using 3 T MRI. Osteoarthritis Cartilage. 2007; 15:789–797.6. Dunn TC, Lu Y, Jin H, Ries MD, Majumdar S. T2 relaxation time of cartilage at MR imaging: comparison with severity of knee osteoarthritis. Radiology. 2004; 232:592–598.7. Keenan KE, Besier TF, Pauly JM, Han E, Rosenberg J, Smith RL, et al. Prediction of glycosaminoglycan content in human cartilage by age, T1ρ and T2 MRI. Osteoarthritis Cartilage. 2011; 19:171–179.8. Mlynárik V, Trattnig S, Huber M, Zembsch A, Imhof H. The role of relaxation times in monitoring proteoglycan depletion in articular cartilage. J Magn Reson Imaging. 1999; 10:497–502.9. Mosher TJ, Dardzinski BJ. Cartilage MRI T2 relaxation time mapping: overview and applications. Semin Musculoskelet Radiol. 2004; 8:355–368.10. Gründer W, Wagner M, Werner A. MR-microscopic visualization of anisotropic internal cartilage structures using the magic angle technique. Magn Reson Med. 1998; 39:376–382.11. Mlynárik V, Degrassi A, Toffanin R, Vittur F, Cova M, Pozzi-Mucelli RS. Investigation of laminar appearance of articular cartilage by means of magnetic resonance microscopy. Magn Reson Imaging. 1996; 14:435–442.12. Mosher TJ, Smith H, Dardzinski BJ, Schmithorst VJ, Smith MB. MR imaging and T2 mapping of femoral cartilage: in vivo determination of the magic angle effect. AJR Am J Roentgenol. 2001; 177:665–669.13. Akella SV, Regatte RR, Wheaton AJ, Borthakur A, Reddy R. Reduction of residual dipolar interaction in cartilage by spin-lock technique. Magn Reson Med. 2004; 52:1103–1109.14. Buck FM, Bae WC, Diaz E, Du J, Statum S, Han ET, et al. Comparison of T1rho measurements in agarose phantoms and human patellar cartilage using 2D multislice spiral and 3D magnetization prepared partitioned k-space spoiled gradient-echo snapshot techniques at 3 T. AJR Am J Roentgenol. 2011; 196:W174–W179.15. Eckstein F, Ateshian G, Burgkart R, Burstein D, Cicuttini F, Dardzinski B, et al. Proposal for a nomenclature for magnetic resonance imaging based measures of articular cartilage in osteoarthritis. Osteoarthritis Cartilage. 2006; 14:974–983.16. Rogers BA, Murphy CL, Cannon SR, Briggs TW. Topographical variation in glycosaminoglycan content in human articular cartilage. J Bone Joint Surg Br. 2006; 88:1670–1674.17. Nozaki T, Kaneko Y, Yu HJ, Kaneshiro K, Schwarzkopf R, Hara T, et al. T1rho mapping of entire femoral cartilage using depth- and angle-dependent analysis. Eur Radiol. 2016; 26:1952–1962.18. Shiomi T, Nishii T, Nakata K, Tamura S, Tanaka H, Yamazaki Y, et al. Three-dimensional topographical variation of femoral cartilage T2 in healthy volunteer knees. Skeletal Radiol. 2013; 42:363–370.19. Hannila I, Räinä SS, Tervonen O, Ojala R, Nieminen MT. Topographical variation of T2 relaxation time in the young adult knee cartilage at 1.5 T. Osteoarthritis Cartilage. 2009; 17:1570–1575.20. Yoon HJ, Yoon YC, Choe BK. T2 values of femoral cartilage of the knee joint: comparison between pre-contrast and post-contrast images. Korean J Radiol. 2014; 15:123–129.21. Kaneko Y, Nozaki T, Yu H, Chang A, Kaneshiro K, Schwarzkopf R, et al. Normal T2 map profile of the entire femoral cartilage using an angle/layer-dependent approach. J Magn Reson Imaging. 2015; 42:1507–1516.22. Calvo E, Palacios I, Delgado E, Sánchez-Pernaute O, Largo R, Egido J, et al. Histopathological correlation of cartilage swelling detected by magnetic resonance imaging in early experimental osteoarthritis. Osteoarthritis Cartilage. 2004; 12:878–886.23. Xia Y. Relaxation anisotropy in cartilage by NMR microscopy (muMRI) at 14-microm resolution. Magn Reson Med. 1998; 39:941–949.
- Full Text Links
-
- Actions
-
Cited
- CITED
-
- Close
- Share
-
- Similar articles
-
- The Effects of Proteoglycan and Type II Collagen on T1rho Relaxation Time of Articular Cartilage
- Quantitative T2 Mapping of Articular Cartilage of the Glenohumeral Joint at 3.0T in Rotator Cuff Disease Patients: the Evaluation of Degenerative Change of Cartilage
- The Change of Articular Cartilage Thickness of the Knee Joint Related to Age in Korean
- T2 Values of Femoral Cartilage of the Knee Joint: Comparison between Pre-Contrast and Post-Contrast Images
- Giant Intra-articular Osteochondroma of the Knee: A Case Report
